

Comprehensive Expression Profiling and Molecular Basis of CDC28 Protein Kinase Regulatory Subunit 2 in Cervical Cancer
- PMID: 35935749
- PMCID: PMC9352497
- DOI: 10.1155/2022/6084549
Comprehensive Expression Profiling and Molecular Basis of CDC28 Protein Kinase Regulatory Subunit 2 in Cervical Cancer
Abstract
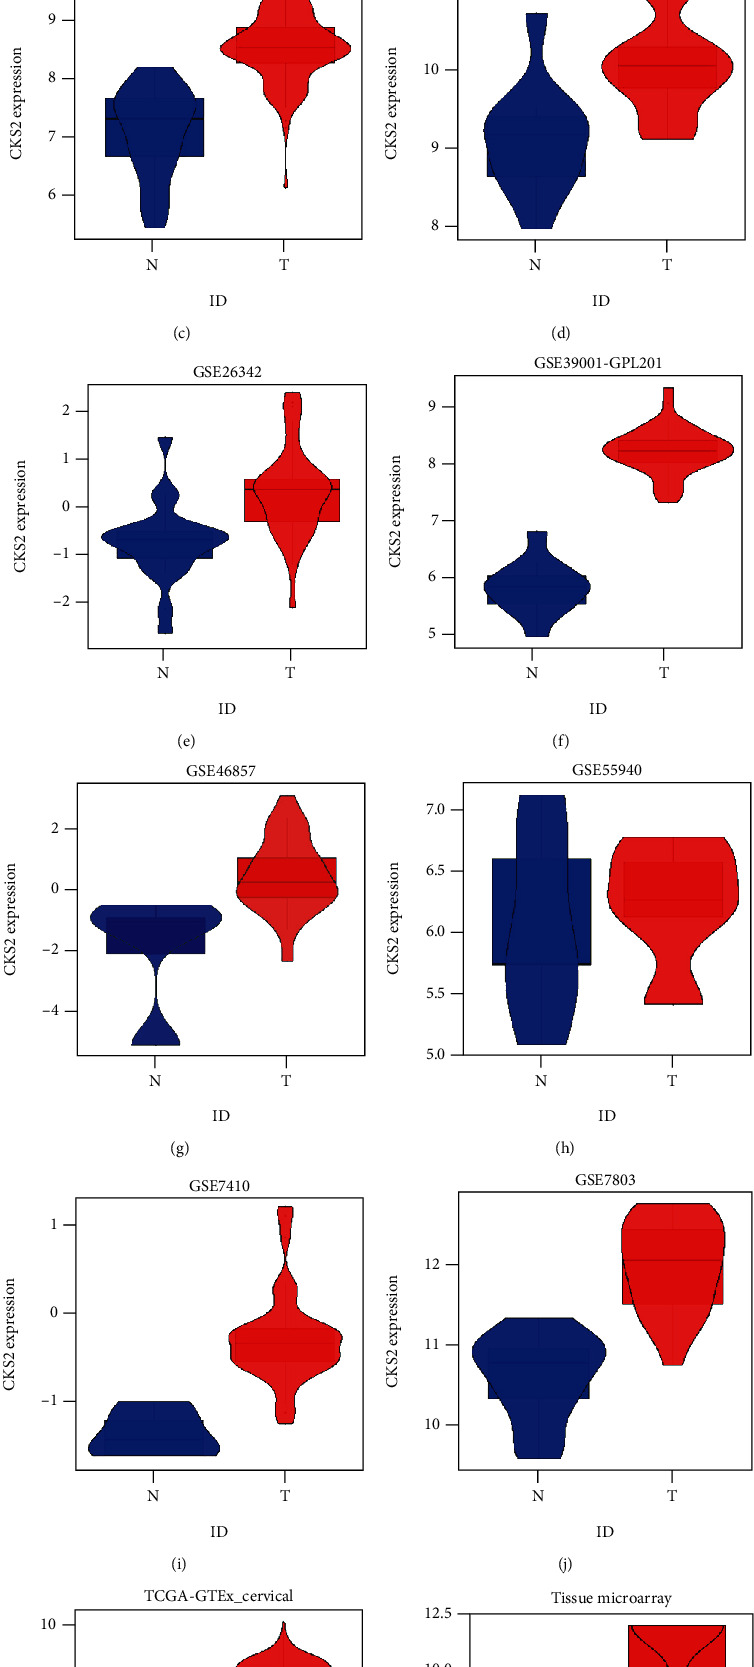
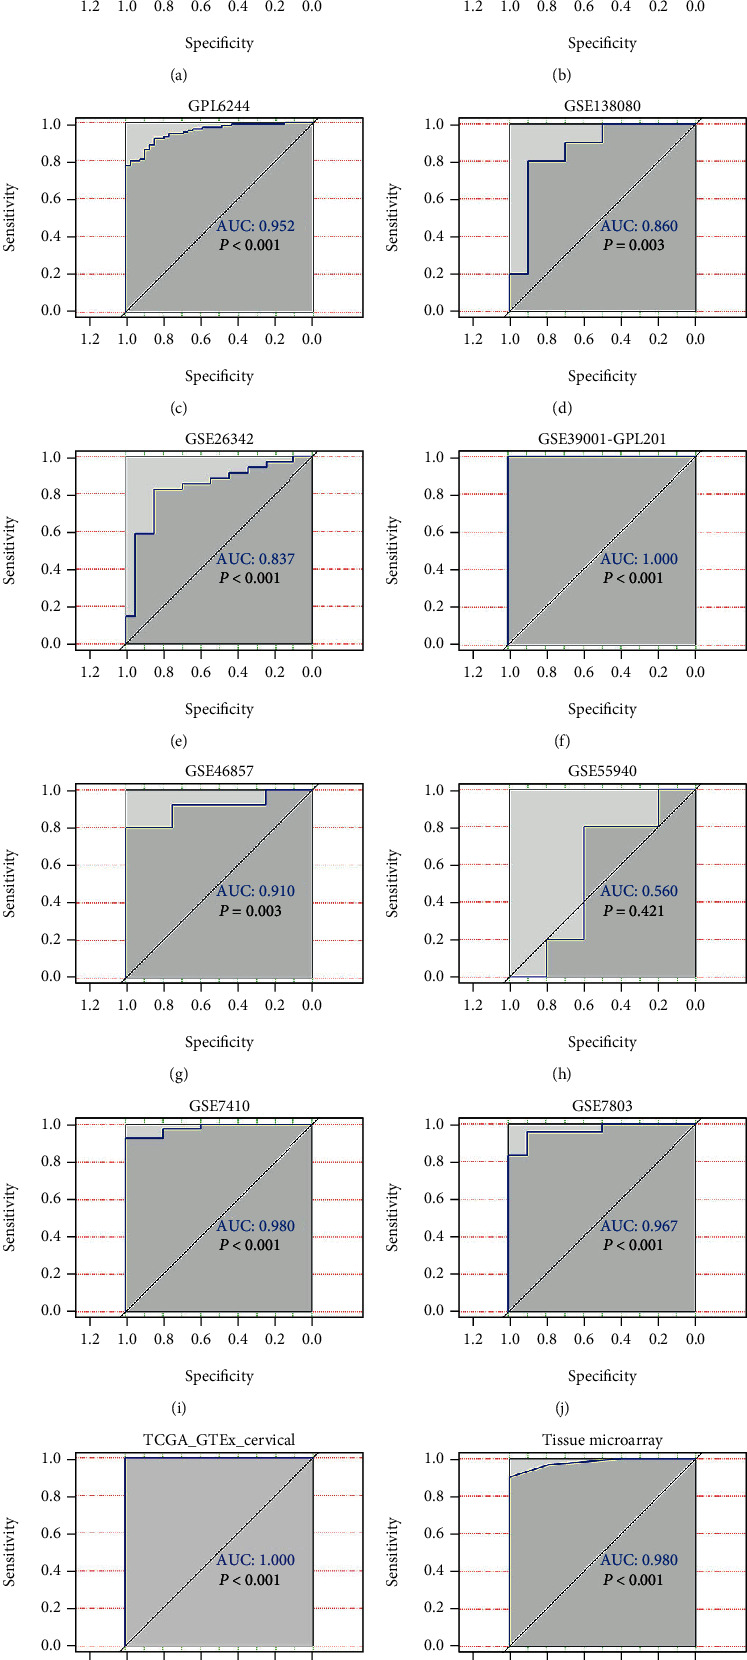
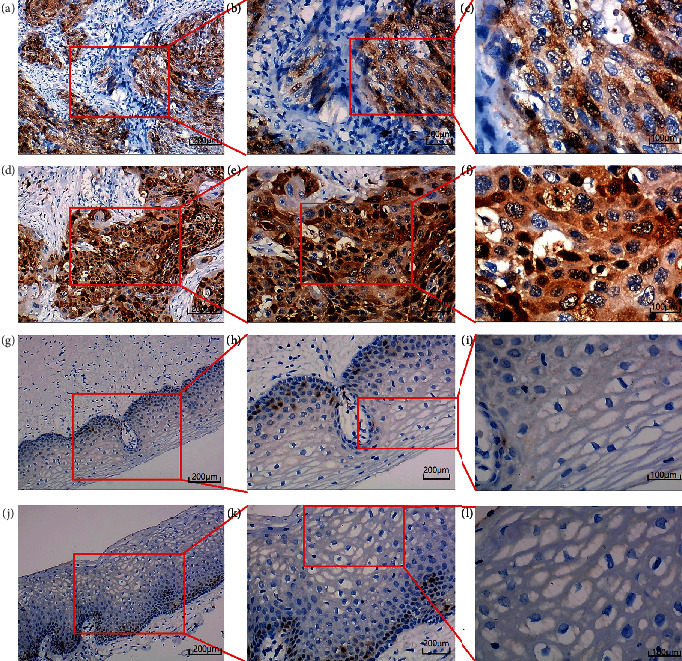
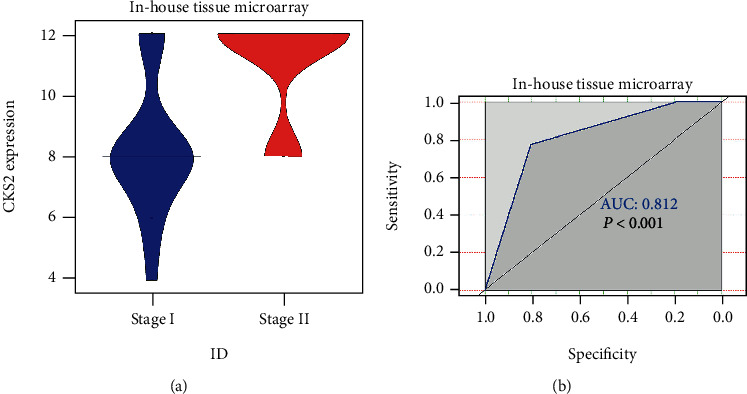
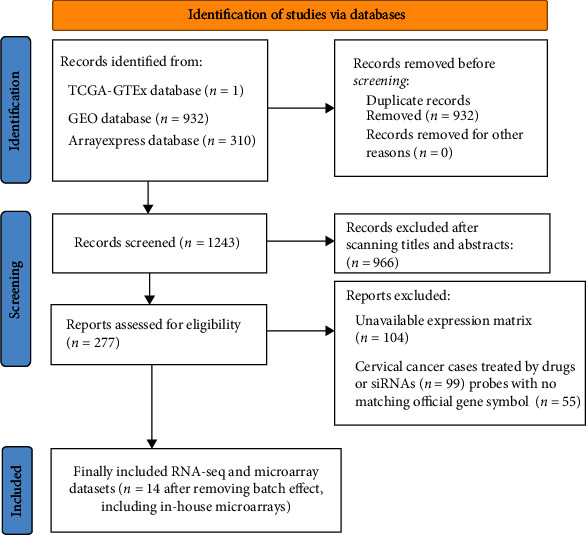
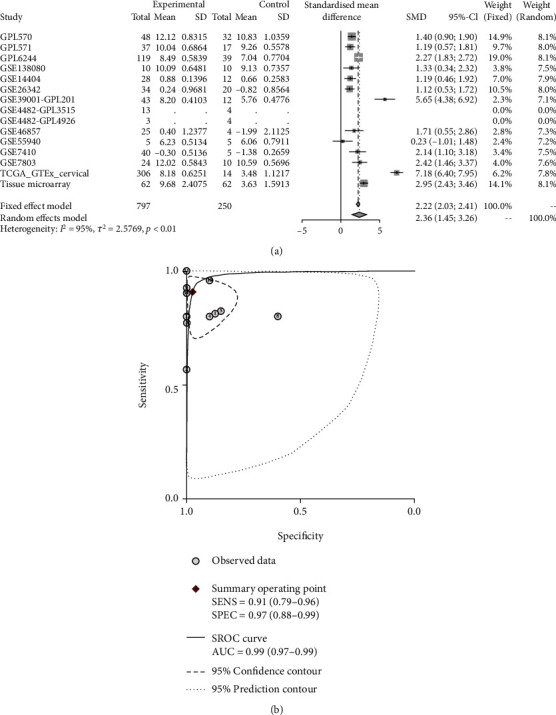
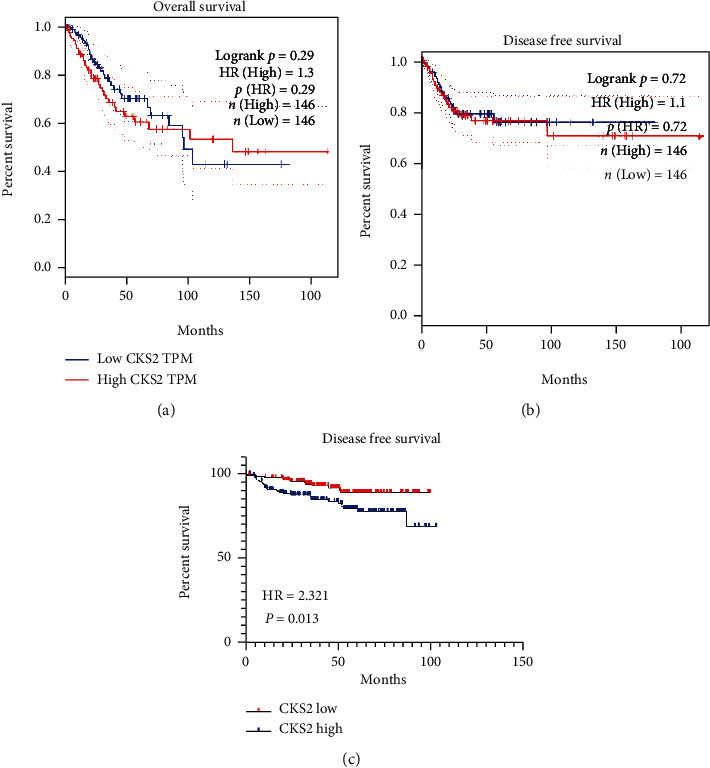
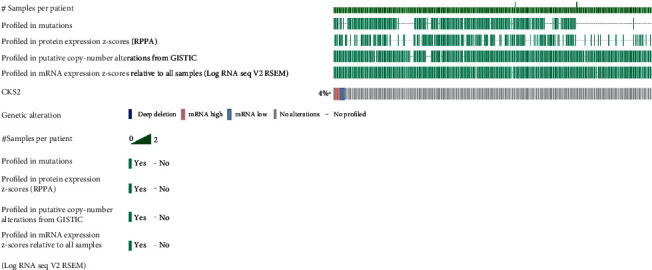
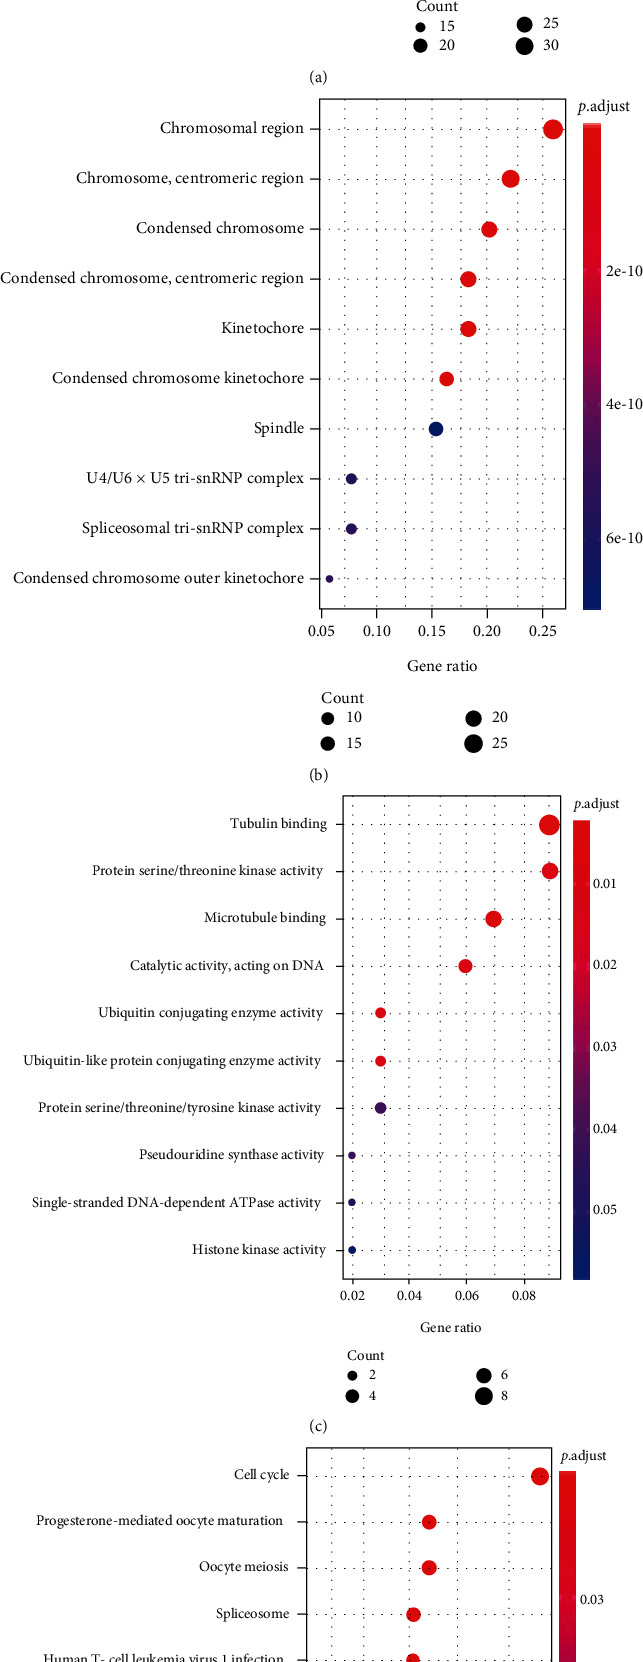
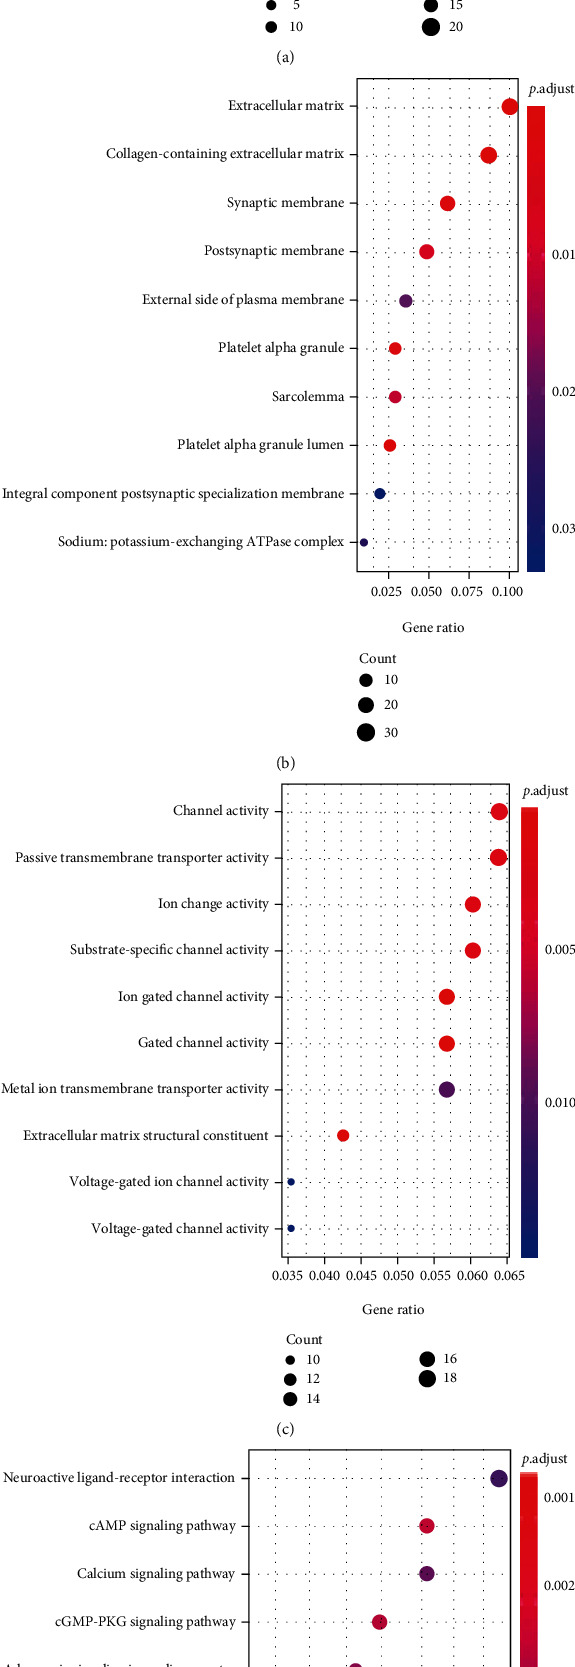
More and more evidence suggests the oncogenic function of overexpressed CDC28 protein kinase regulatory subunit 2 (CKS2) in various human cancers. However, CKS2 has rarely been studied in cervical cancer. Herein, taking advantage of massive genetics data from multicenter RNA-seq and microarrays, we were the first group to perform tissue microarrays for CKS2 in cervical cancer. We were also the first to evaluate the clinical significance of CKS2 with large samples (980 cervical cancer cases and 422 noncancer cases). We further excavated the mechanism of the tumor-promoting activities of CKS2 in cervical cancer through analysis of genetic mutation profiles, Gene Ontology (GO), and Kyoto Encyclopedia of Genes and Genomes (KEGG) significant enrichment of genes coexpressed with CKS2. According to the results, expression data from multilevels unanimously supported the overexpression of CKS2 in cervical cancer. Patients with cervical cancer in stage II from inhouse microarrays had significantly higher expression of CKS2, and CKS2 overexpression had an adverse impact on the disease-free survival status of cervical cancer patients in GSE44001. Both mutation types of mRNA high and mRNA low appeared in cervical cancer cases from the TCGA Firehose project. Gene coexpressed with CKS2 participated in pathways including the cell cycle, estrogen signaling pathway, and DNA replication. In summary, upregulated CKS2 is closely associated with the malignant clinical development of cervical cancer and might serve as a valuable therapeutic target in cervical cancer.
Copyright © 2022 Li Qin et al.
Conflict of interest statement
The authors declare that they have no conflicts of interest.
Figures
Similar articles
-
Biological functions and therapeutic potential of CKS2 in human cancer.Front Oncol. 2024 Aug 12;14:1424569. doi: 10.3389/fonc.2024.1424569. eCollection 2024. Front Oncol. 2024. PMID: 39188686 Free PMC article. Review.
-
CKS2 (CDC28 protein kinase regulatory subunit 2) is a prognostic biomarker in lower grade glioma: a study based on bioinformatic analysis and immunohistochemistry.Bioengineered. 2021 Dec;12(1):5996-6009. doi: 10.1080/21655979.2021.1972197. Bioengineered. 2021. PMID: 34494924 Free PMC article.
-
Expression Profile and Molecular Basis of Cyclin-Dependent Kinases Regulatory Subunit 2 in Endometrial Carcinoma Detected by Diversified Methods.Pathol Oncol Res. 2022 May 27;28:1610307. doi: 10.3389/pore.2022.1610307. eCollection 2022. Pathol Oncol Res. 2022. PMID: 35693634 Free PMC article.
-
Clinicopathological and biological significance of CDC28 protein kinase regulatory subunit 2 overexpression in human gastric cancer.Int J Oncol. 2011 Aug;39(2):361-72. doi: 10.3892/ijo.2011.1056. Epub 2011 May 25. Int J Oncol. 2011. PMID: 21617860
-
Mitochondrial Function of CKS2 Oncoprotein Links Oxidative Phosphorylation with Cell Division in Chemoradioresistant Cervical Cancer.Neoplasia. 2019 Apr;21(4):353-362. doi: 10.1016/j.neo.2019.01.002. Epub 2019 Mar 8. Neoplasia. 2019. PMID: 30856376 Free PMC article.
Cited by
-
CKS2 induces autophagy-mediated glutathione metabolic reprogramming to facilitate ferroptosis resistance in colon cancer.Mol Med. 2024 Nov 15;30(1):219. doi: 10.1186/s10020-024-00979-5. Mol Med. 2024. PMID: 39548421 Free PMC article.
-
Biological functions and therapeutic potential of CKS2 in human cancer.Front Oncol. 2024 Aug 12;14:1424569. doi: 10.3389/fonc.2024.1424569. eCollection 2024. Front Oncol. 2024. PMID: 39188686 Free PMC article. Review.
-
CKS2 Silencing Affects Proliferation and Apoptosis in Multiple Myeloma through the PTEN/ AKT/mTOR Pathway.J Cancer. 2025 Mar 3;16(6):1987-2000. doi: 10.7150/jca.106190. eCollection 2025. J Cancer. 2025. PMID: 40092696 Free PMC article.
References
-
- Kiff J. M., Cotter M., Munro E. G., Leonard M. E., Morgan T. K., Bruegl A. S. Cervical cancer screening in postmenopausal women: is it time to move toward primary high-risk human papillomavirus screening? Journal of Women's Health (2002) . 2021;30(7):972–978. doi: 10.1089/jwh.2020.8849. - DOI - PMC - PubMed
LinkOut - more resources
Full Text Sources
