. 2022 Jul 22:9:944489.
doi: 10.3389/fmed.2022.944489. eCollection 2022.

Interferon-alpha responsible EPN3 regulates hepatitis B virus replication

Affiliations

Interferon-alpha responsible EPN3 regulates hepatitis B virus replication

Xueqian Li et al. Front Med (Lausanne). .

Abstract

Hepatitis B virus (HBV) infection remains a major health problem worldwide, and the current antiviral therapy, including nucleoside analogs, cannot achieve life-long cure, and clarification of antiviral host immunity is necessary for eradication. Here, we found that a clathrin-binding membrane protein epsin3 (EPN3) negatively regulates the expression of HBV RNA. EPN3 expression was induced by transfection of an HBV replicon plasmid, and reduced HBV-RNA level in hepatic cell lines and murine livers hydrodynamically injected with the HBV replicon plasmid. Viral RNA reduction by EPN3 was dependent on transcription, and independent from epsilon structure of viral RNA. Viral RNA reduction by overexpression of p53 or IFN-α treatment, was attenuated by knockdown of EPN3, suggesting its role downstream of IFN-α and p53. Taken together, this study demonstrates the anti-HBV role of EPN3. The mechanism how it decreases HBV transcription is discussed.

Keywords: AID; EPN3; HBV; IFN-α; p53.


Figures

Figure 1
Figure 1
RNA-seq of pPB-transfected Huh7 cells. Huh7 cells were transfected with an HBV-replicon plasmid (pPB), or the empty vector. Three days after transfection, cells were harvested for RNA sequencing. The differentially expressed genes are indicated as a volcano plot (A) and a heatmap (B).
Figure 2
Figure 2
EPN3 negatively regulates the expression of HBV RNA. (A–C) Huh7 cells were transfected with pPB and the indicated siRNAs or the negative control (siNC), and 3 days later, the cells and supernatants were harvested. (A,B bottom, C top) HBV RNA and EPN3 mRNA were quantified by RT-qPCR analysis. (B, top) The total cellular lysates were subjected to western blot analysis. (C, middle and bottom) The cellular (middle) and secreted (bottom) HBV DNA levels were quantified by qPCR analysis. The level of siNC in the control sample is defined as value 1. (D) Cells were transfected with the pgRNA reporter (pCMV1.2xHBV/NL) and the helper plasmid (pcDNA-CP), and siEPN3. Three days later, cells were harvested and subjected to luciferase assay. The NL activity of siNC in the control sample is defined as value 100. (E-I) Cells were transfected with pPB and the FLAG-EPN3 expression vector, and harvested 72 h after transfection. (E) EPN3 overexpression was validated by Western blot. (F–H) The levels of cellular HBV RNA (F), cellular HBV DNA (G), and supernatant HBV DNA (H) were determined by RT-qPCR and DNA-qPCR. (I) The levels of supernatant HBsAg were measured by ELISA. The level of the empty vector is defined as value 1. (J) Cells were transfected with the EPN3, pgRNA reporter, and helper plasmids, and subjected to luciferase activity. The NL activity of the empty vector transfectant is defined as value 100. *P < 0.05, **P < 0.01, ***P < 0.001, ****P < 0.0001. Data are representative of two to three independent experiments.
Figure 3
Figure 3
EPN3-mediated HBV RNA reduction in hydrodynamic-based mouse HBV model. C57BL/6 mice were hydrodynamically administrated with pPB and the FLAG-EPN3 or the empty vector (n = 3, each for the empty vector and EPN3). (A) Western blot analysis of the transfected liver. (B) HBV RNA levels were determined by RT-qPCR. (C) qPCR analyses of cytoplasmic HBV DNA. (D) The levels of HBsAg were measured in serum by ELISA. The level of the empty vector sample is defined as value 1. *P < 0.05, **P < 0.01.
Figure 4
Figure 4
EPN3-mediated HBV downregulation depends on transcription. (A) Huh7 cells were transfected with pPB and the EPN3 expression vector. 54 h later, 100 ng/ml actinomycin D (ActD) was added for 18 h to block transcription. Total RNA was extracted to measure by RT-qPCR. The level of the empty vector without ActD treatment sample is defined as value 1. (B) Huh7 cells were transfected with EPN3, pCMV1.2xHBV/NL and pcDNA-CP. ActD was added 18 h before harvest, followed by luciferase assay. The NL activity of the empty vector without ActD treatment sample is defined as value 100. *P < 0.05, ****P < 0.0001. Data are representative of two to three independent experiments.
Figure 5
Figure 5
EPN3 does not require epsilon structures for its anti-HBV effect. Huh7 cells were transfected with the wildtype or mutated pCMV1.2xHBV/NL (WT: wild type, 5′-epsilon, 3′-epsilon, or no epsilon), along with pcDNA-CP and either empty, AID, or EPN3 expression vector. Three days after transfection, cells were harvested and luciferase activity was determined. The NL activity of the empty vector transfectants defined as value 100. *P < 0.05, **P < 0.01. Data are representative of two to three independent experiments.
Figure 6
Figure 6
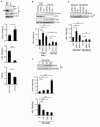
EPN3 suppresses HBV replication downstream of IFN-α and p53. (A) Huh7 cells were transfected with pPB and the p53 expression vector. Three days after transfection, cells were harvested and subjected to western blot (top) and RT-qPCR analysis (middle), and the culture supernatant was to ELISA (bottom). The level of the empty vector transfectant is defined as value 1. (B) Cells were transfected with pPB, the p53 expression vector, and siEPN3. Three days after transfection, cells were harvested for western blot (top) and RT-qPCR analysis (bottom). The level of siNC in the empty vector sample is defined as value 1. (C) The cells were transfected with pPB, and 6 h later, treated with IFN-α for 3 days. The expression level of EPN3 was determined using Western blot (top) and RT-qPCR analysis (middle). HBV RNA levels were determined by RT-qPCR (bottom). The level of untreated cells is defined as value 1. (D) Cells were transfected with pPB and siEPN3, and 6 h later, treated with 1,000 U/ml IFN-α for additional 3 days. The amount of EPN3 was determined using Western blot (top). HBV RNA levels were determined by RT-qPCR (bottom). The HBV level of the siNC transfectant, without IFN-α treatment is defined as value 1. *P < 0.05, **P < 0.01, ***P < 0.001, ****P < 0.0001. Data are representative of two to three independent experiments.

Similar articles

Cited by

References

    1. Datta S. An overview of molecular epidemiology of hepatitis B virus (HBV) in India. Virol J. (2008) 5:156. 10.1186/1743-422X-5-156 - DOI - PMC - PubMed
    1. Xie W, Wang B, Wang X, Hou D, Su H, Huang H. Nine hub genes related to the prognosis of HBV-positive hepatocellular carcinoma identified by protein interaction analysis. Ann Transl Med. (2020) 8:478. 10.21037/atm.2020.03.94 - DOI - PMC - PubMed
    1. Yoo J, Hann HW, Coben R, Conn M, DiMarino AJ. Update treatment for HBV infection and persistent risk for hepatocellular carcinoma: prospect for an HBV cure. Diseases. (2018) 6:27. 10.3390/diseases6020027 - DOI - PMC - PubMed
    1. Li W, Cui X, Huo Q, Qi Y, Sun Y, Tan M, et al. . Profile of HBV integration in the plasma DNA of hepatocellular carcinoma patients. Curr Genomics. (2019) 20:61–8. 10.2174/1389202919666181002144336 - DOI - PMC - PubMed
    1. Wei F, Kang D, Cherukupalli S, Zalloum WA, Zhang T, Liu X, et al. . Discovery and optimizing polycyclic pyridone compounds as anti-HBV agents. Expert Opin Ther Patents. (2020) 30:715–21. 10.1080/13543776.2020.1801641 - DOI - PubMed