Review
. 2022 Jul 22:13:952581.
doi: 10.3389/fphar.2022.952581. eCollection 2022.

Fluorescent Tracers for In Vivo Imaging of Lymphatic Targets

Affiliations
Review

Fluorescent Tracers for In Vivo Imaging of Lymphatic Targets

P S Russell et al. Front Pharmacol. .

Abstract

The lymphatic system continues to gain importance in a range of conditions, and therefore, imaging of lymphatic vessels is becoming more widespread for research, diagnosis, and treatment. Fluorescent lymphatic imaging offers advantages over other methods in that it is affordable, has higher resolution, and does not require radiation exposure. However, because the lymphatic system is a one-way drainage system, the successful delivery of fluorescent tracers to lymphatic vessels represents a unique challenge. Each fluorescent tracer used for lymphatic imaging has distinct characteristics, including size, shape, charge, weight, conjugates, excitation/emission wavelength, stability, and quantum yield. These characteristics in combination with the properties of the target tissue affect the uptake of the dye into lymphatic vessels and the fluorescence quality. Here, we review the characteristics of visible wavelength and near-infrared fluorescent tracers used for in vivo lymphatic imaging and describe the various techniques used to specifically target them to lymphatic vessels for high-quality lymphatic imaging in both clinical and pre-clinical applications. We also discuss potential areas of future research to improve the lymphatic fluorescent tracer design.

Keywords: fluorescent imaging; fluorophore; in vivo; lymph node; lymphatic.


Conflict of interest statement

The authors declare that the research was conducted in the absence of any commercial or financial relationships that could be construed as a potential conflict of interest. The handling editor SH declared a past co-authorship with authors JH, AP, JW.

Figures

FIGURE 1
FIGURE 1
Use of fluorophores that emit at different wavelengths allows visualization of lymphatics at different depths for skin-intact imaging. Alternatively, surgical exposure can be used to visualize deeper lymphatic vessels. Intraluminal valves and smooth muscle cells are shown in white and red, respectively. Measurements on the left indicate approximate depths in human skin tissue, and measurements on the right indicate approximate diameters of lymphatic vessels. Fluorescence microlymphography (FML) uses fluorophores emitting at a visible wavelength (∼400–700 nm). The tissue depth at which NIR imaging devices can detect NIR fluorophores (NIR-I wavelength ∼700–1,000 nm; NIR-II wavelength ∼1,000–1,700 nm) is dependent upon their brightness and the sensitivity of the device, but it can be as much as 3–4 cm (Zhu and Sevick-Muraca, 2014).
FIGURE 2
FIGURE 2
Delivery routes for lymphatic uptake of fluorescent tracers. (A) Interstitial transport includes intradermal, subcutaneous, submucosal, peritumoral, or intraparenchymal injection. Other delivery routes (enteral, endotracheal, intra-articular, intravascular) also include interstitial transport prior to lymphatic uptake. The tracers enter lymphatic vessels either singly or bound to interstitial cells (e.g., dendritic cells) or macromolecules (e.g., albumin) via passive transport between endothelial cells or active transport across endothelial cells. Particles >10 nm (or >20 kDa) (blue) are generally taken up by the lymphatics, as opposed to the blood capillaries. Particles >100 nm (or >30 kDa) (yellow) are still taken up by lymphatics but diffuse poorly through the interstitium. Particles <5 nm (or <20 kDa) (black dot) preferentially enter blood capillaries if they remain unbound. (B) Enteral delivery of fluorescent tracers to mesenteric lymphatics can be achieved by using a FA fluorescent tracer (e.g., BODIPY) or conjugating the tracer to a FA. Dietary triglycerides are broken down into FAs and 2-MG by pancreatic lipase prior to absorption. Similarly, lipophilic fluorescent tracers need to be small FAs or stable in the gastrointestinal tract to prevent enteric breakdown. Once absorbed, FAs (>10 carbon atoms in length), including fluorescent FAs, are reesterified into TGs and then incorporated into lipoproteins within the enterocytes. Lipoproteins, primarily chylomicrons, are preferentially taken up in the lacteal. (C) Fluorescent tracers can be injected directly into lymphatic vessels or nodes. Although not shown here, the tracer may enter the LN through intra-nodal high endothelial venules after intravenous injection. Also not shown is intraperitoneal delivery. Abbreviations: FA, fatty acid; GAGs, glycosaminoglycans; MG, 2-monoglyceride; TG, triglyceride.
FIGURE 3
FIGURE 3
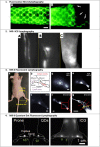
Examples of fluorescent lymphatic imaging. 1) Fluorescence microlymphography (FML) of the nude mouse tail after the injection of 5 μL of 25% 2,000 kDa FITC-dextran at the distal tip. The direction of lymph flow is from left to right. Bar, 400 μm. (A) Typical continuous lymphatic network 22 min after injection. (B) Same tail, 28 days after injection of an FSaII cell suspension. Large arrows indicate attenuated vessels possibly inside the tumor. Small arrows indicate the increased apparent diameter due to engorgement and/or flattening of the lymphatic capillary. Reproduced with permission from Leu et al.(2000). 2) ICG lymphography. Left-arm of a 38-year-old woman with left breast cancer who underwent a mastectomy and axillary lymph node dissection. (A) Before surgery with no edema. ICG lymphography showed a linear pattern. (B) Three months after surgery. Although the patient complained of a heavy feeling in the left upper arm, significant limb volume change was not seen. A splash pattern was observed on the left upper arm. (C) Twelve months after surgery. The left arm became significantly larger clinically despite the use of a compression sleeve. A stardust pattern was observed throughout the left arm. Reproduced with permission from Akita et al. (2016). 3) NIR-II fluorescent lymphography. Images demonstrate the superior resolution of imaging ICG in the NIR-II range and of BTC-1070 compared to ICG and IR26. (a) Digital photograph of a nude mouse fixed on an imaging plate, showing the injection site (yellow arrow) of contrast agents and the lymphatic drainage imaging window (dash square). (b) Schematic illustration of the anatomical structure of the lymphatic system in the hindlimb of nude mice; the green arrow represents the lymphatic drainage from the paw to the sciatic lymph node. (c–g) Fluorescence images of lymphatic drainage using IR26 (c), ICG (d, e), and BTC1070 (f, g) in the hindlimb of nude mice on an InGaAs camera. (g) High-magnification (×3) image of the ankle (red square in f), showing that at least five collateral lymph vessels were resolved. Scale bar, 2.5 mm IR26 and BTC1070 imaging signals were collected at wavelengths of 1,200–1,700 nm under 1,064 nm excitation. ICG was excited at 808 nm, and images were collected in the NIR-I (850–950 nm) and NIR-II (1,000–1,700 nm) regions, respectively. Reproduced with permission from Wang et al. (2019). 4) NIR-II quantum dot fluorescent lymphography. Mouse footpads were injected with 50 μL ultrabright PbS/CdS core/shell quantum dot solution (100 pmol). Shown is a comparison of popliteal and sacral lymph nodes imaged with QDots at the NIR-IIb window and ICG at the NIR-I window, respectively. The signal intensity of LNs is labeled with values in green. Reproduced with permission from Tian et al. (2020).
FIGURE 4
FIGURE 4
General structures of (A) cyanines, (B) hemicyanines, and (C) streptocyanines.
FIGURE 5
FIGURE 5
Optical characteristics of ICG and absorption spectra of hemoglobin and water. Based on information from Miwa (2016). The area in pink represents the “optical window” (650–900 nm) of the far-red/NIR-I spectrum for optimum in vivo imaging. Abbreviations: AUs, absorbance units; ICG, indocyanine green; Hb, deoxygenated hemoglobin; HbO2, oxygenated hemoglobin.

Similar articles

Cited by

References

    1. Abdallah M., Müllertz O. O., Styles I. K., Mörsdorf A., Quinn J. F., Whittaker M. R., et al. (2020). Lymphatic Targeting by Albumin-Hitchhiking: Applications and Optimisation. J. Control Release 327, 117–128. 10.1016/j.jconrel.2020.07.046 - DOI - PubMed
    1. Akita S., Nakamura R., Yamamoto N., Tokumoto H., Ishigaki T., Yamaji Y., et al. (2016). Early Detection of Lymphatic Disorder and Treatment for Lymphedema Following Breast Cancer. Plast. Reconstr. Surg. 138 (2), 192e–202e. 10.1097/PRS.0000000000002337 - DOI - PubMed
    1. Alander J. T., Kaartinen I., Laakso A., Pätilä T., Spillmann T., Tuchin V. V., et al. (2012). A Review of Indocyanine Green Fluorescent Imaging in Surgery. Int. J. Biomed. Imag. 2012, 1–26. 10.1155/2012/940585 - DOI - PMC - PubMed
    1. Andersen H. S., Bennedsen A. L. B., Burgdorf S. K., Eriksen J. R., Eiholm S., Toxværd A., et al. (2017). In Vivo and Ex Vivo Sentinel Node Mapping Does Not Identify the Same Lymph Nodes in Colon Cancer. Int. J. Colorectal Dis. 32 (7), 983–990. 10.1007/s00384-017-2777-9 - DOI - PubMed
    1. Ansari S. A., Satar R., Jafri M. A., Rasool M., Ahmad W., Kashif Zaidi S. (2016). Role of Nanodiamonds in Drug Delivery and Stem Cell Therapy. Iran. J. Biotechnol. 14 (3), 130–141. 10.15171/ijb.1320 - DOI - PMC - PubMed

LinkOut - more resources