

(±)-5-bromo-2-(5-fluoro-1-hydroxyamyl) Benzoate Protects Against Oxidative Stress Injury in PC12 Cells Exposed to H2O2 Through Activation of Nrf2 Pathway
- PMID: 35935850
- PMCID: PMC9348035
- DOI: 10.3389/fphar.2022.943111
(±)-5-bromo-2-(5-fluoro-1-hydroxyamyl) Benzoate Protects Against Oxidative Stress Injury in PC12 Cells Exposed to H2O2 Through Activation of Nrf2 Pathway
Abstract
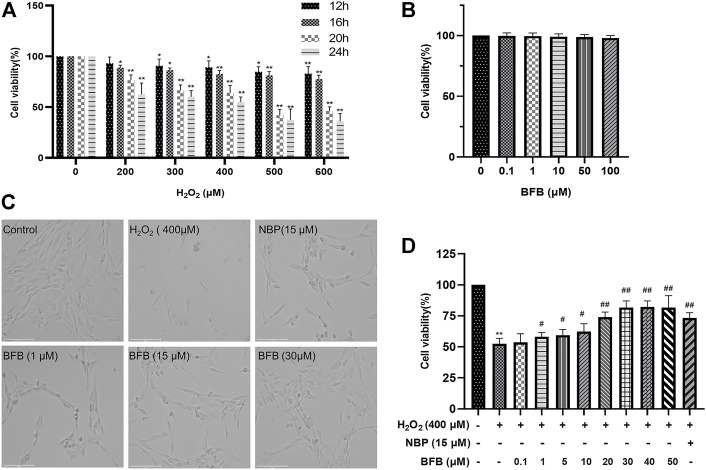
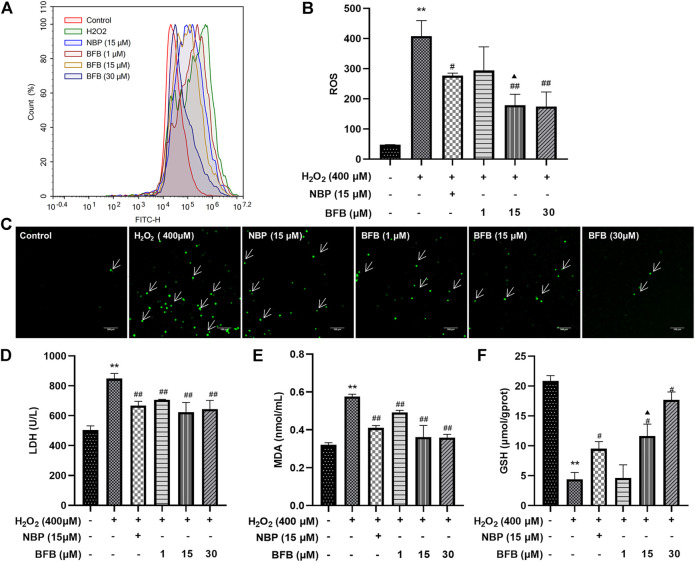
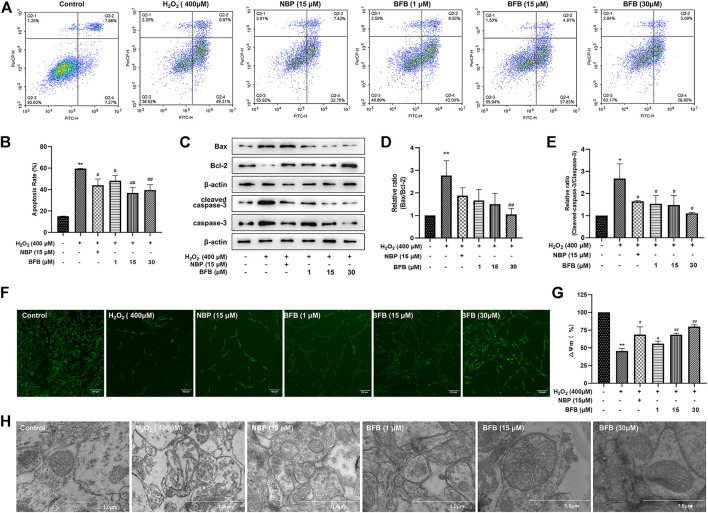
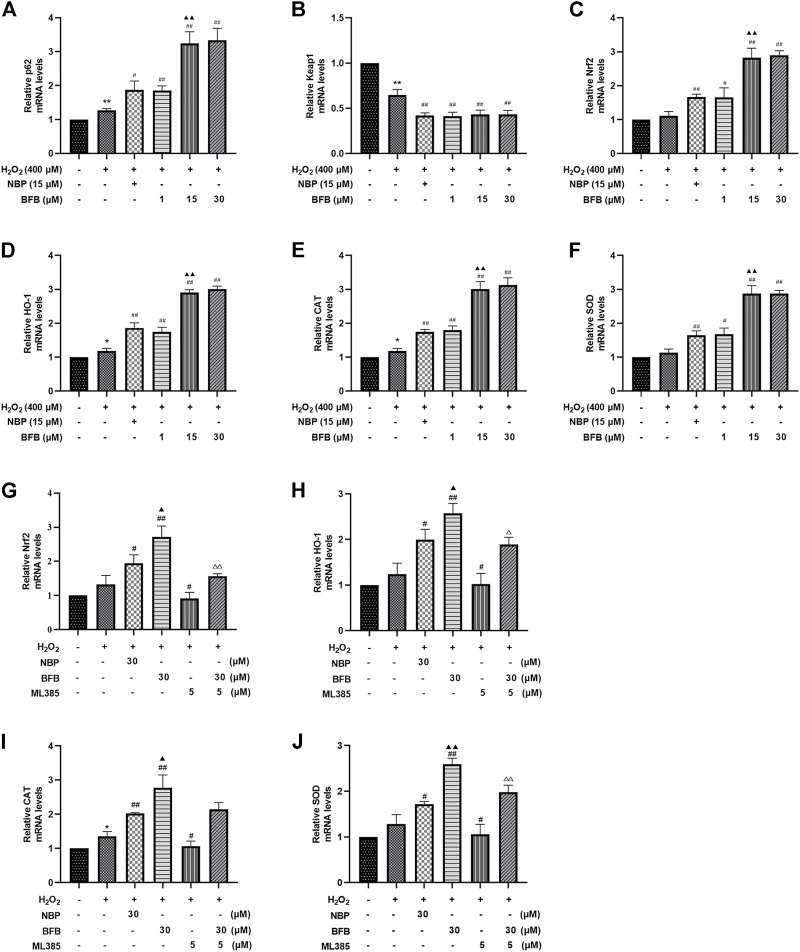
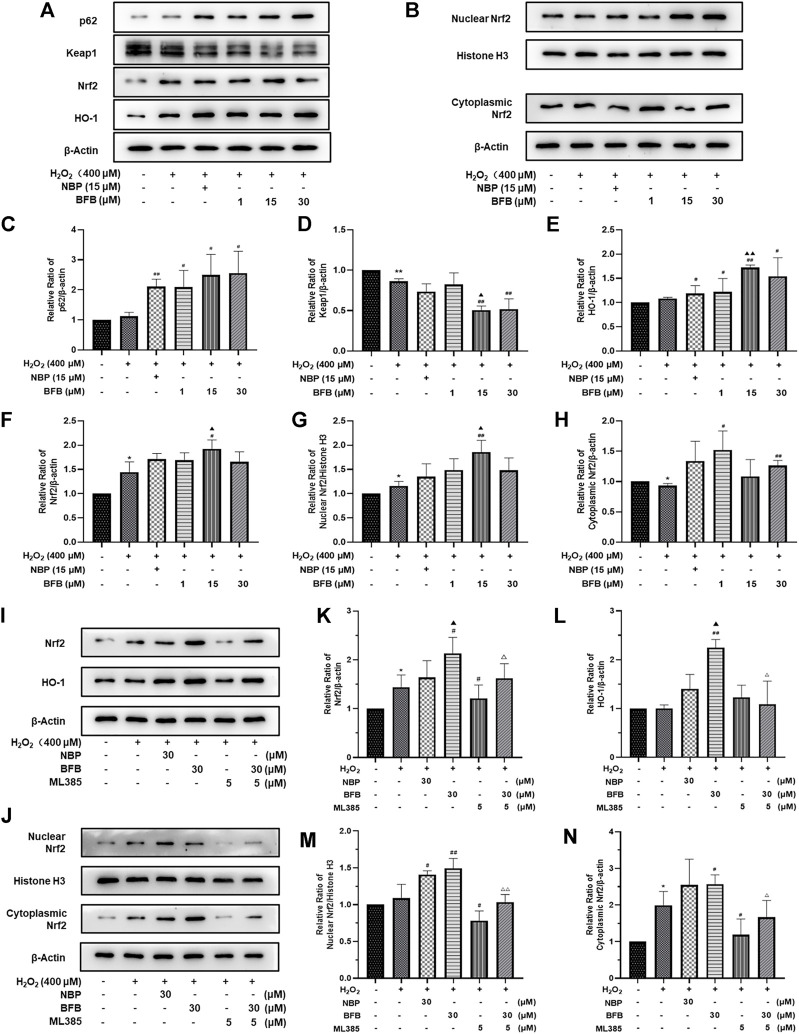
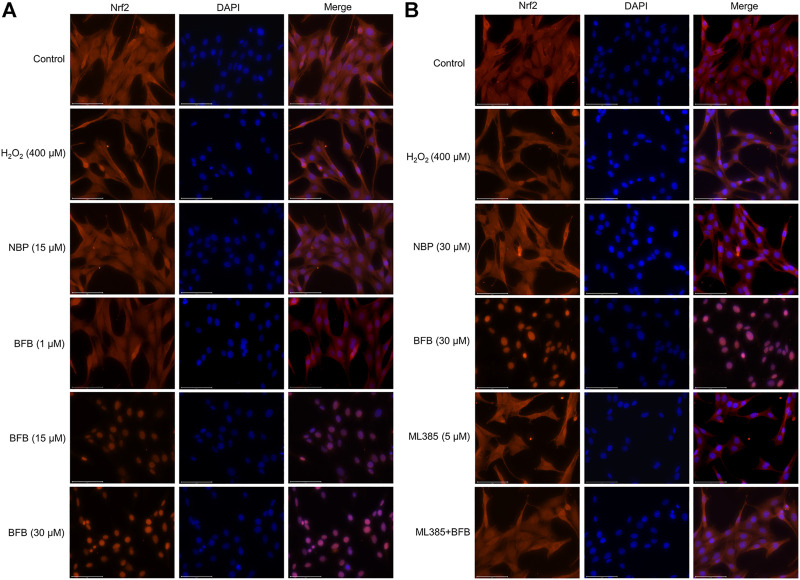
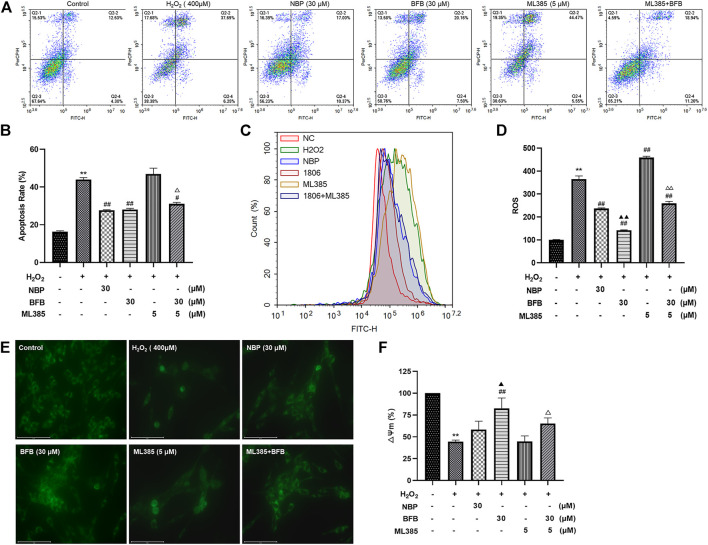
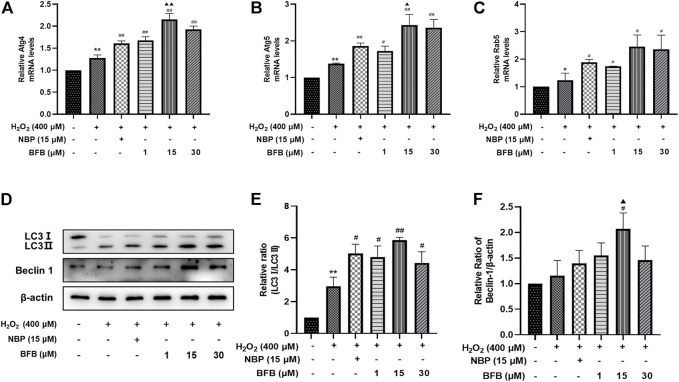
Background: Oxidative stress is associated with the pathogenesis of ischemic stroke (±)-5-bromo-2-(5-fluoro-1-hydroxyamyl) benzoate (BFB) is a novel compound modified by dl-3-n-butylphthalide (NBP). Here, we hypothesized that BFB may protect the PC12 cells against H2O2-induced oxidative stress injury through activation of the Nrf2 pathway. Methods: We measured the cell viability and levels of lactate dehydrogenase (LDH), malondialdehyde (MDA), glutathione (GSH), and reactive oxygen species (ROS) to determine the construction of the H2O2-induced models of oxidative stress in PC12 cells. Additionally, apoptotic cell death, mitochondrial membrane potential, and cellular morphology were examined to determine the effect of BFB on oxidative stress injury in H2O2-treated PC12 cells. The expression levels of Nrf2-related and autophagy-related genes and proteins were detected using real time quantative PCR (RT-qPCR), Western Blot, and immunofluorescence analyses. Results: Our study showed that BFB treatment reduced the elevated levels of MDA, LDH, and ROS, and decreased cell viability and GSH in H2O2-treated PC12 cells. We also observed the elevated expression of Nrf2 pathway-related factors and intranuclear transitions and found that Nrf2 inhibitors (ML385) could block the protective effect of BFB. The inhibitory effect of BFB on oxidative stress may be partially regulated by Nrf2 activation, and the initiation and induction of autophagy. Conclusion: BFB inhibited H2O2-induced oxidative stress injury in PC12 cells by activating the Nrf2 pathway, initiating and inducing autophagy, suggesting that BFB may be a promising therapeutic agent in treating neurological disorders like cerebral ischemia.
Keywords: BFB; H2O2; Nrf2; PC12 cell; autophagy.
Copyright © 2022 Qi, Zhang, Fu, Pi, Shi, Fan, Zhang, Xiao, Shang, Lin, Gao, Chang and Gao.
Conflict of interest statement
The authors declare that the research was conducted in the absence of any commercial or financial relationships that could be construed as a potential conflict of interest.
Figures
Similar articles
-
Nrf2 Pathway and Autophagy Crosstalk: New Insights into Therapeutic Strategies for Ischemic Cerebral Vascular Diseases.Antioxidants (Basel). 2022 Sep 2;11(9):1747. doi: 10.3390/antiox11091747. Antioxidants (Basel). 2022. PMID: 36139821 Free PMC article. Review.
-
Neuroprotective effects of Tiaogeng decoction against H2O2-induced oxidative injury and apoptosis in PC12 cells via Nrf2 and JNK signaling pathways.J Ethnopharmacol. 2021 Oct 28;279:114379. doi: 10.1016/j.jep.2021.114379. Epub 2021 Jun 30. J Ethnopharmacol. 2021. PMID: 34216727
-
Theaflavic acid from black tea protects PC12 cells against ROS-mediated mitochondrial apoptosis induced by OGD/R via activating Nrf2/ARE signaling pathway.J Nat Med. 2020 Jan;74(1):238-246. doi: 10.1007/s11418-019-01333-4. Epub 2019 Jun 21. J Nat Med. 2020. PMID: 31227974
-
Zhachong Shisanwei pill drug-containing serum protects H2O2-Induced PC12 cells injury by suppressing apoptosis, oxidative stress via regulating the MAPK signaling pathway.Front Pharmacol. 2024 Oct 9;15:1445597. doi: 10.3389/fphar.2024.1445597. eCollection 2024. Front Pharmacol. 2024. PMID: 39449968 Free PMC article.
-
Carnosic acid protects against ferroptosis in PC12 cells exposed to erastin through activation of Nrf2 pathway.Life Sci. 2021 Feb 1;266:118905. doi: 10.1016/j.lfs.2020.118905. Epub 2020 Dec 14. Life Sci. 2021. PMID: 33333051
Cited by
-
Influence of Temperature during Freeze-Drying Process on the Viability of Bifidobacterium longum BB68S.Microorganisms. 2023 Jan 11;11(1):181. doi: 10.3390/microorganisms11010181. Microorganisms. 2023. PMID: 36677474 Free PMC article.
-
Pregnane X receptor (PXR) deficiency protects against spinal cord injury by activating NRF2/HO-1 pathway.CNS Neurosci Ther. 2023 Nov;29(11):3460-3478. doi: 10.1111/cns.14279. Epub 2023 Jun 2. CNS Neurosci Ther. 2023. PMID: 37269088 Free PMC article.
-
Neuroprotective Effects of a New Derivative of Chlojaponilactone B against Oxidative Damaged Induced by Hydrogen Peroxide in PC12 Cells.Molecules. 2022 Sep 16;27(18):6049. doi: 10.3390/molecules27186049. Molecules. 2022. PMID: 36144782 Free PMC article.
-
Nrf2 Pathway and Autophagy Crosstalk: New Insights into Therapeutic Strategies for Ischemic Cerebral Vascular Diseases.Antioxidants (Basel). 2022 Sep 2;11(9):1747. doi: 10.3390/antiox11091747. Antioxidants (Basel). 2022. PMID: 36139821 Free PMC article. Review.
-
Activation of the Nrf2/Keap1 signaling pathway mediates the neuroprotective effect of Perillyl alcohol against cerebral hypoxic-ischemic damage in neonatal rats.Redox Rep. 2024 Dec;29(1):2394714. doi: 10.1080/13510002.2024.2394714. Epub 2024 Sep 16. Redox Rep. 2024. PMID: 39284589 Free PMC article.
References
LinkOut - more resources
Full Text Sources