. 2022 Jul 22:13:906625.
doi: 10.3389/fphar.2022.906625. eCollection 2022.

The human cathelicidin peptide LL-37 inhibits pancreatic cancer growth by suppressing autophagy and reprogramming of the tumor immune microenvironment

Affiliations

The human cathelicidin peptide LL-37 inhibits pancreatic cancer growth by suppressing autophagy and reprogramming of the tumor immune microenvironment

Zhu Zhang et al. Front Pharmacol. .

Abstract

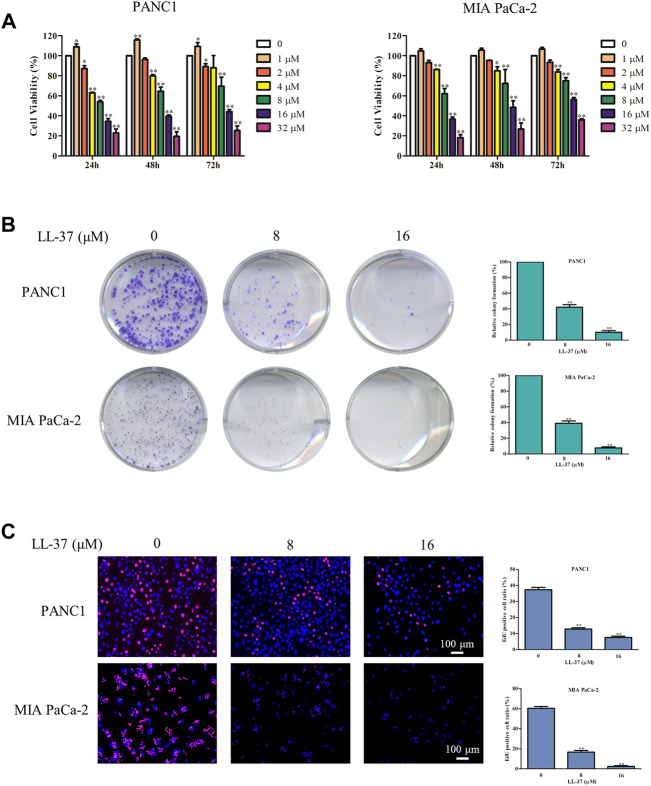
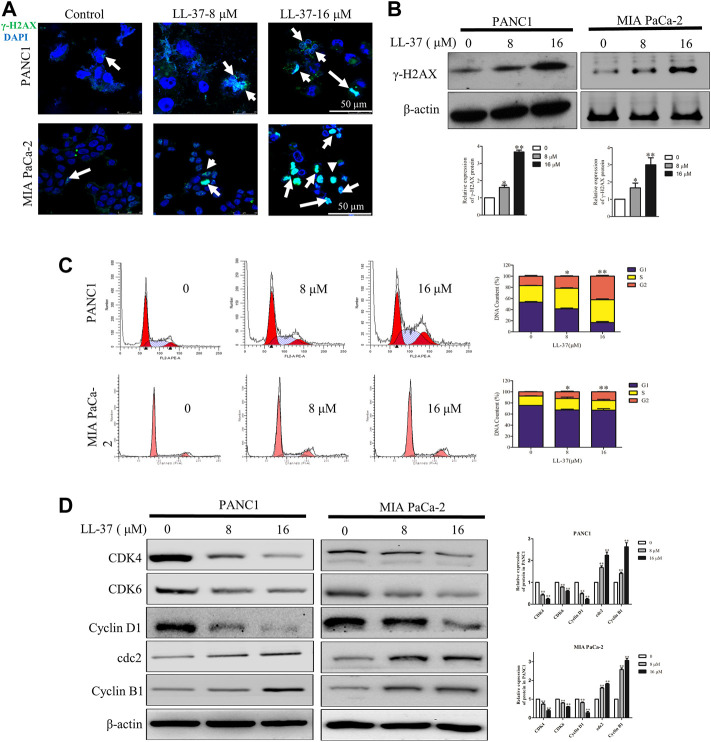
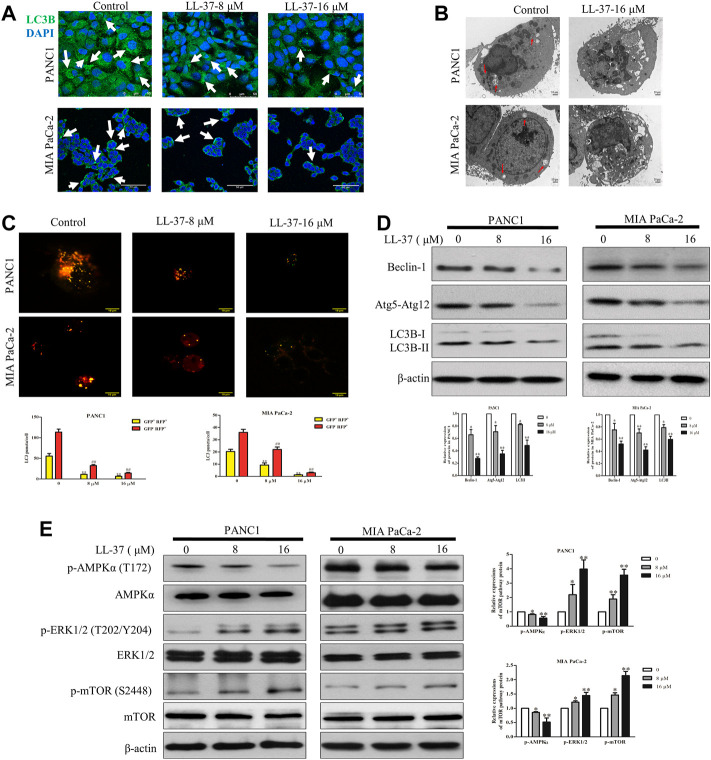
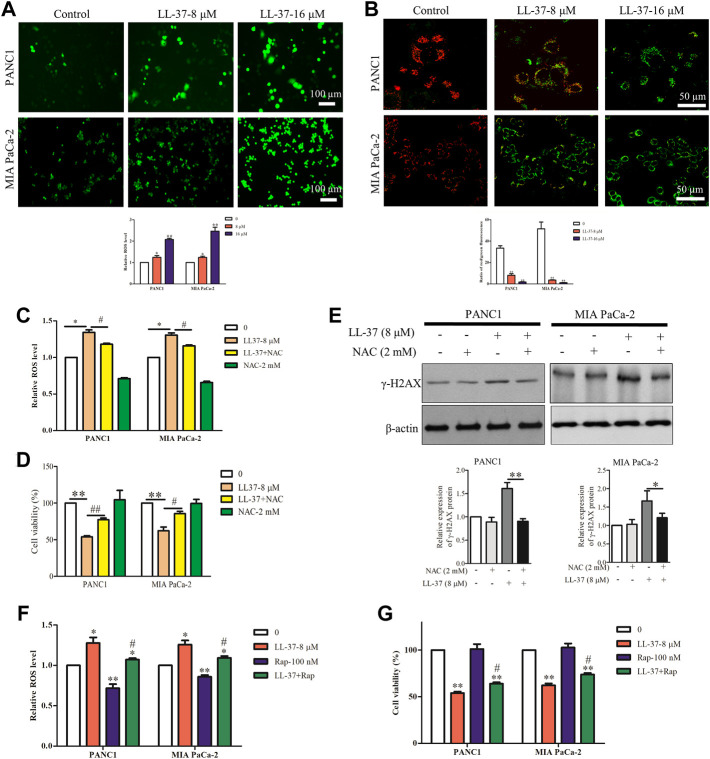
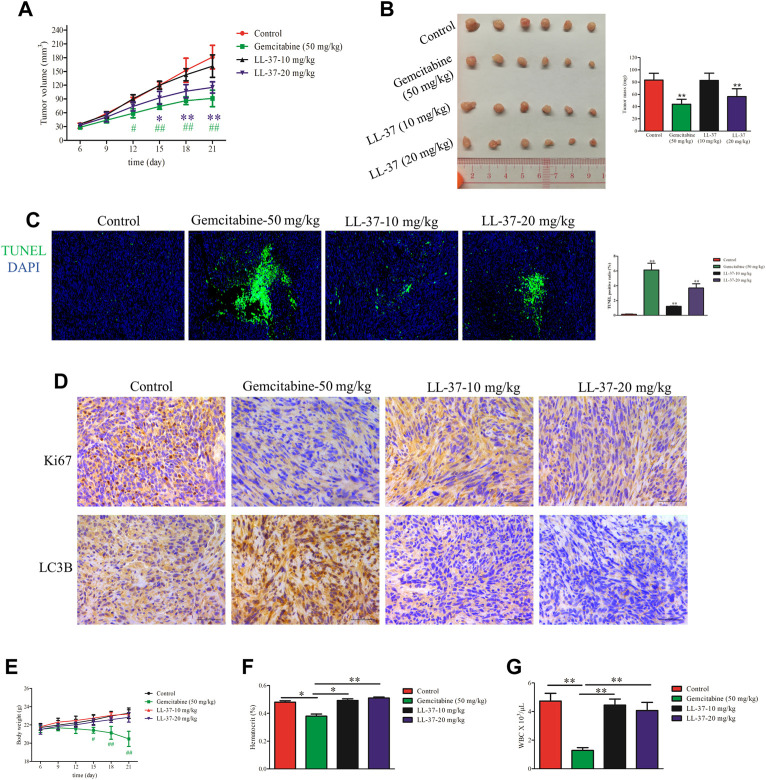
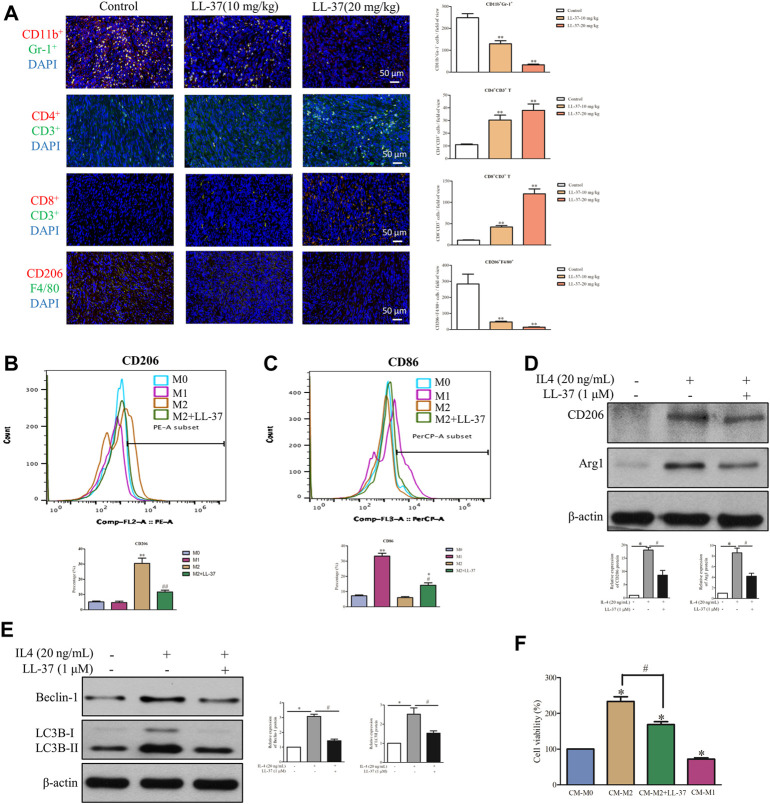
Pancreatic cancer is amongst the most lethal malignancies, while its poor prognosis could be associated with promotion of autophagy and the tumor immune microenvironment. Studies have confirmed the pro-tumorigenic nature of the cathelicidin family of peptide LL-37 in several types of cancer. However, at higher doses, LL-37 exerts significant cytotoxicity against gastrointestinal cancer cells. In our study, we investigated the anti-tumorigenic potential of LL-37 in pancreatic cancer and the underlying mechanisms. Our results have shown that LL-37 inhibited the growth of pancreatic cancer both in vitro and in vivo. Mechanistic studies have demonstrated that LL-37 induced DNA damage and cell cycle arrest through induction of reactive oxygen species (ROS). Further study indicates that LL-37 suppressed autophagy in pancreatic cancer cells through activation of mTOR signaling, leading to more accumulation of ROS production and induction of mitochondrial dysfunctions. With combined treatment of LL-37 with the mTOR inhibitor rapamycin, LL-37-induced ROS production and cancer cell growth inhibition were attenuated. Subsequent in vivo study has shown that LL-37 downregulated the immunosuppressive myeloid-derived suppressor cells and M2 macrophages while upregulated the anti-cancer effectors CD8+ and CD4+ T cells in the tumor microenvironment. By using an in vitro co-culture system, it was shown that promotion of M2 macrophage polarization would be suppressed by LL-37 with inhibition of autophagy, which possessed significant negative impact on cancer growth. Taken together, our findings implicate that LL-37 could attenuate the development of pancreatic cancer by suppressing autophagy and reprogramming of the tumor immune microenvironment.

Keywords: LL-37; ROS; autophagy; mTOR signaling; pancreatic cancer; tumor immune microenvironment.


Conflict of interest statement

The handling editor YB declared a shared affiliation with the author S-QZ at the time of review. The remaining authors declare that the research was conducted in the absence of any commercial or financial relationships that could be construed as a potential conflict of interest.

Figures

FIGURE 1
FIGURE 1
LL-37 inhibits the growth of pancreatic cancer cells. (A) The cell viability of human PANC1 and MIA PaCa-2 cells treated with various concentrations of LL-37 (1–32 μM) for 24, 48 or 72 h was determined by MTT assay. (B) Colony formation assay was used to evaluate the proliferation ability of PANC1 and MIA PaCa-2 cells. (C) The proliferation of PANC1 and MIA PaCa-2 cells was detected by EdU staining (red). DAPI (blue) stained the nuclei. Cells treated with DMSO were used as negative controls. The data of all drug treatment groups were normalized to the control group. Data are presented as mean ± SD of three independent experiments conducted in triplicate. *p < 0.05, **p < 0.01 vs. control (0 μM).
FIGURE 2
FIGURE 2
LL-37 induces DNA damage and cell cycle arrest in pancreatic cancer cells. LL-37 induced DNA damage by increasing γ-H2AX expression, as determined by immunofluorescence microscopy and western blotting (A,B), respectively after LL-37 (8 and 16 μM) treatment for 24 h. (C) The cell cycle distributions in PANC1 and MIA PaCa-2 cells were analyzed by flow cytometry after LL-37 treatment for 24 h. The data are presented as means ± SD. *p < 0.05, **p < 0.01 vs. control (0 μM) value in the G2 phase. (D) The expressions of cell cycle arrest related proteins were determined by western blotting after LL-37 treatment for 24 h. Non-arbitrary band density data relative to the housekeeping protein ß-actin are presented as mean ± SD, *p < 0.05, **p < 0.01 vs. control (0 μM).
FIGURE 3
FIGURE 3
LL-37 inhibits autophagy in pancreatic cancer cells. (A) LL-37 (8 and 16 μM) decreased the formation of autophagosomes in pancreatic cancer cells as determined using immunofluorescence microscopy. (B) Autophagic vacuoles in PANC1 and MIA PaCa-2 cells treated with 16 μM LL-37 or DMSO were observed by TEM. The red arrow indicates autophagic vacuoles. (C) The autophagic flux in LL-37-treated PANC1 and MIA PaCa-2 cells was tested using the Autophagy Tandem Sensor RFP-GFP-LC3B. Representative images were photographed under a confocal microscope. The average numbers of yellow and red LC3B dots per cell are shown, **p < 0.01 vs. control of yellow dots, ##p < 0.01 vs. control of red dots. (D) The levels of autophagy markers LC3II, Atg5–Atg12 and Beclin-1 in PANC1 and MIA PaCa-2 cells were measured by western blotting after treatment with LL-37 for 24 h. (E) The mTOR pathway involved in the inhibitory effect of LL-37 on autophagy was determined by western bloting. Cells treated with DMSO were used as negative controls. Three independent experiments were each performed in triplicate. Representative protein bands are shown for comparison. Non-arbitrary band density data relative to the housekeeping protein ß-actin are presented as mean ± SD, *p < 0.05, **p < 0.01 vs. control (0 μM).
FIGURE 4
FIGURE 4
LL-37 increases the intracellular production of reactive oxygen species (ROS) in pancreatic cancer cells. (A) ROS were detected using the fluorescence dye CM-H2DCFDA and immunofluorescence microscopy. ROS fluorescence was measured using a SpectraMax Plate Reader (Molecular Devices) with excitation/emission wavelengths of 495/520 nm. Data are presented as mean ± SD of three independent experiments conducted in triplicate. *p < 0.05, **p < 0.01 vs. control (0 μM). (B) Effect of LL-37 on the MMP in PANC1 and MIA PaCa-2 cells was measured using JC-1 staining method. Representative images were photographed under a confocal microscope. The red/green fluorescence ratio was quantified by the Image J. **p < 0.01 vs. control (0 μM). (C) The ROS production of pancreatic cancer cells treated with LL-37 in the presence and absence of a ROS scavenger NAC (2 mM) was determined. *p < 0.05 vs. control; # p < 0.05 vs. LL-37 (8 µM). (D) The viability of pancreatic cancer cells treated with LL-37 in the presence and absence of a ROS scavenger NAC was determined using an MTT assay. **p < 0.01 vs. control; # p < 0.05, ## p < 0.01 vs. LL-37 (8 µM). (E) The expression of γ-H2AX in PANC1 and MIA PaCa-2 cells treated with LL-37 in the presence and absence of NAC was determined by western blotting. Non-arbitrary band density data relative to that of the housekeeping protein ß-actin are presented as mean ± SD, *p < 0.05, **p < 0.01 vs. LL-37 (8 µM). The ROS production (F) and cell viability (G) were determined in pancreatic cancer cells treated with LL-37 in the presence and absence of an autophagy inducer (rapamycin; 100 nM), respectively. *p < 0.05, **p < 0.01 vs. control; # p < 0.05 vs. LL-37 (8 µM).
FIGURE 5
FIGURE 5
LL-37 inhibited the growth of pancreatic tumors in vivo. (A) The subcutaneous tumor diameters were measured every 3 days, and the tumor volumes were calculated using the formula: (short diameter)2 × (long diameter) × 0.5. *p < 0.05, **p < 0.01 for LL-37 20 mg/kg vs. control group; # p < 0.05, ## p < 0.01 for gemcitabine vs. control group. (B) The tumor weights in the control group, positive drug group (gemcitabine 50 mg/kg), low-dose LL-37 (10 mg/kg) group and high-dose LL-37 (20 mg/kg) group. **p < 0.01 vs. control group. (C) Tumor tissues from mice in different groups were subjected to a TUNEL apoptosis assay. (D) Immunohistochemistry analysis to detect Ki67 and LC3Ⅱ expression in the tumor tissues of mice in different groups (scale bar = 50 μm, magnification × 400). (E) The body weights were measured every 3 days # p < 0.05, ## p < 0.01 gemcitabine vs. control group. After treatment for 14 days, the hematocrit (F) and white blood cells (G) in the peripheral blood were evaluated. *p < 0.05, **p < 0.01 vs. gemcitabine group.
FIGURE 6
FIGURE 6
LL-37 reprogrammed the immune cells in the tumor microenvironment. (A) A dual-immunofluorescence analysis was used to identify the myeloid-derived suppressor cells (MDSCs), CD4+ T cells, CD8+ T cells and M2 macrophages in the tumor tissues (scale bar = 50 μM, 400× magnification). The positively stained cells were quantified using Image-pro plus 6.0. **p < 0.01 vs. Control group. The effect of LL-37 on the polarization of macrophages was determined using a flow cytometer. F4/80 is the common marker of macrophages cell. (B) CD206 is a specific surface marker for M2 macrophages. (C) CD86 is a specific surface marker for M1 macrophages. The percentage of CD206 and CD86 expression on F4/80 macrophages were quantified. *p < 0.05, **p < 0.01 vs. M0 group, # p < 0.05, # # p < 0.01 vs. M2 group. The effect of LL-37 on the expression of the M2 macrophage markers (D) and autophagy markers (E) measured using western blot in RAW264.7 cells treated with IL-4. Non-arbitrary band density data relative to those of the housekeeping protein ß-actin are presented as mean ± SD, *p < 0.01 for IL-4 treatment vs. control, # p < 0.01 for LL-37 + IL-4 treatment vs. IL-4 treatment. (F) Cell viability of PAN02 cultured with conditioned medium from M0 macrophages (CM-M0), M1 macrophages (CM-M1), M2 macrophages (CM-M2) and M2 macrophages + LL-37 (CM-M2+LL-37). CM-M1 is positive control. Data are presented as the means ± SD of three independent experiments each conducted in triplicate. *p < 0.01 for CM-M2 vs. CM-M0, # p < 0.01 for CM-M2+LL-37 vs. CM-M2.

Similar articles

Cited by

References

    1. Bang S., Kim H. S., Choo Y, S., Park S W., Chung J, B., Song S, Y., et al. (2006). Differences in immune cells engaged in cell-mediated immunity after chemotherapy for far advanced pancreatic cancer. Pancreas 32 (1), 29–36. 10.1097/01.mpa.0000191651.32420.41 PubMed Abstract | 10.1097/01.mpa.0000191651.32420.41 | Google Scholar - DOI - DOI - PubMed
    1. Carriere A., Romeo Y., Acosta-Jaquez H. A., Moreau J., Bonneil E., Thibault P., et al. (2011). ERK1/2 phosphorylate raptor to promote ras-dependent activation of MTOR complex 1 (MTORC1). J. Biol. Chem. 286 (1), 567–577. 10.1074/jbc.M110.159046 PubMed Abstract | 10.1074/jbc.M110.159046 | Google Scholar - DOI - DOI - PMC - PubMed
    1. Chen D., Xie J., Fiskesund R., Dong W., Liang X., Lv J., et al. (2018). Chloroquine modulates antitumor immune response by resetting tumor-associated macrophages toward M1 phenotype. Nat. Commun. 9 (1), 873. 10.1038/s41467-018-03225-9 PubMed Abstract | 10.1038/s41467-018-03225-9 | Google Scholar - DOI - DOI - PMC - PubMed
    1. Chen M. L., Pittet M. J., Gorelik L., Flavell R. A., Weissleder R., Von Boehmer H., et al. (2005). Regulatory T cells suppress tumor-specific CD8 T cell cytotoxicity through TGF-β signals in vivo . Proc. Natl. Acad. Sci. U. S. A. 102 (2), 419–424. 10.1073/pnas.0408197102 PubMed Abstract | 10.1073/pnas.0408197102 | Google Scholar - DOI - DOI - PMC - PubMed
    1. Chen X., Qi G., Qin M., Zou Y., Zhong K., Tang Y., et al. (2017). DNA methylation directly downregulates human cathelicidin antimicrobial peptide gene (CAMP) promoter activity. Oncotarget 8 (17), 27943–27952. 10.18632/oncotarget.15847 PubMed Abstract | 10.18632/oncotarget.15847 | Google Scholar - DOI - DOI - PMC - PubMed