

Detecting drug-drug interactions between therapies for COVID-19 and concomitant medications through the FDA adverse event reporting system
- PMID: 35935872
- PMCID: PMC9353301
- DOI: 10.3389/fphar.2022.938552
Detecting drug-drug interactions between therapies for COVID-19 and concomitant medications through the FDA adverse event reporting system
Abstract
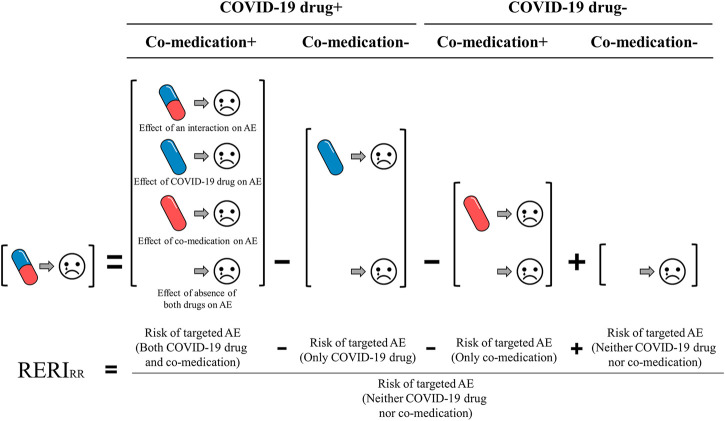
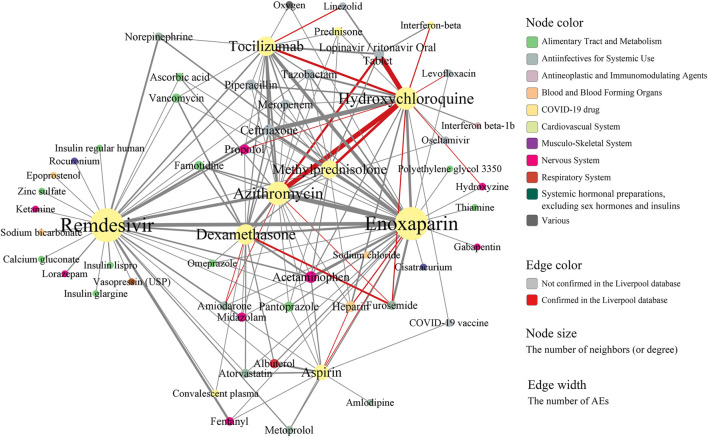
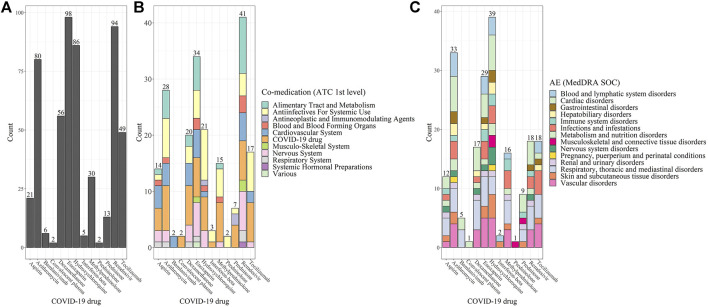
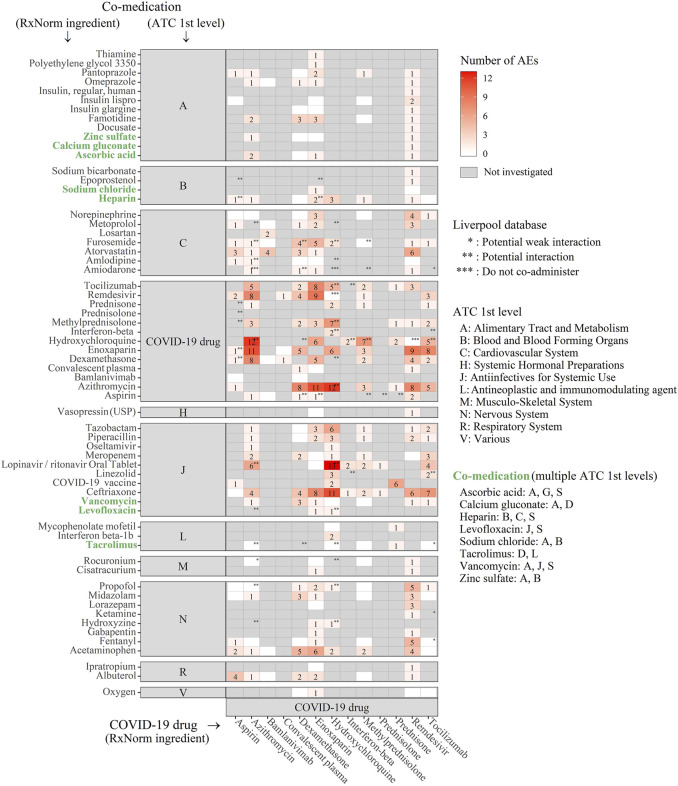
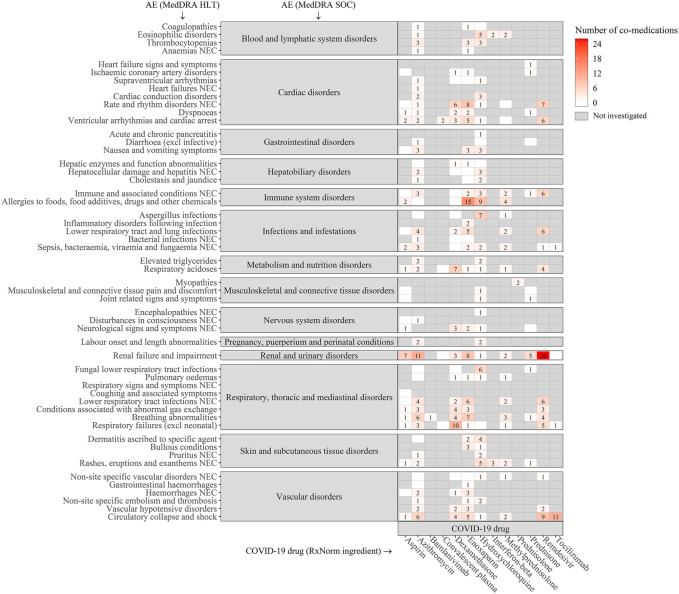
Background: COVID-19 patients with underlying medical conditions are vulnerable to drug-drug interactions (DDI) due to the use of multiple medications. We conducted a discovery-driven data analysis to identify potential DDIs and associated adverse events (AEs) in COVID-19 patients from the FDA Adverse Event Reporting System (FAERS), a source of post-market drug safety. Materials and Methods: We investigated 18,589 COVID-19 AEs reported in the FAERS database between 2020 and 2021. We applied multivariate logistic regression to account for potential confounding factors, including age, gender, and the number of unique drug exposures. The significance of the DDIs was determined using both additive and multiplicative measures of interaction. We compared our findings with the Liverpool database and conducted a Monte Carlo simulation to validate the identified DDIs. Results: Out of 11,337 COVID-19 drug-Co-medication-AE combinations investigated, our methods identified 424 signals statistically significant, covering 176 drug-drug pairs, composed of 13 COVID-19 drugs and 60 co-medications. Out of the 176 drug-drug pairs, 20 were found to exist in the Liverpool database. The empirical p-value obtained based on 1,000 Monte Carlo simulations was less than 0.001. Remdesivir was discovered to interact with the largest number of concomitant drugs (41). Hydroxychloroquine was detected to be associated with most AEs (39). Furthermore, we identified 323 gender- and 254 age-specific DDI signals. Conclusion: The results, particularly those not found in the Liverpool database, suggest a subsequent need for further pharmacoepidemiology and/or pharmacology studies.
Keywords: COVID-19; FAERS; additive interaction; discovery-driven; drug-drug interactions; hypothesis generation; logistic regresion; multiplicative interaction.
Copyright © 2022 Jeong, Nelson, Su, Malin, Li and Chen.
Conflict of interest statement
The authors declare that the research was conducted in the absence of any commercial or financial relationships that could be construed as a potential conflict of interest.
Figures
References
-
- Agency E. M. (2020). COVID‐19: Reminder of risk of serious side effects with chloroquine and hydroxychloroquine. European: European Medicines Agency.
-
- Arshad U., Pertinez H., Box H., Tatham L., Rajoli R. K. R., Curley P., et al. (2020). Prioritization of anti-SARS-cov-2 drug repurposing opportunities based on plasma and target site concentrations derived from their established human pharmacokinetics. Clin. Pharmacol. Ther. 108 (4), 775–790. 10.1002/cpt.1909 - DOI - PMC - PubMed
Grants and funding
LinkOut - more resources
Full Text Sources
Other Literature Sources