. 2022 Jul 21:13:940999.
doi: 10.3389/fphar.2022.940999. eCollection 2022.

Therapeutic effects of total saikosaponins from Radix bupleuri against Alzheimer's disease

Affiliations

Therapeutic effects of total saikosaponins from Radix bupleuri against Alzheimer's disease

Juan Li et al. Front Pharmacol. .

Abstract

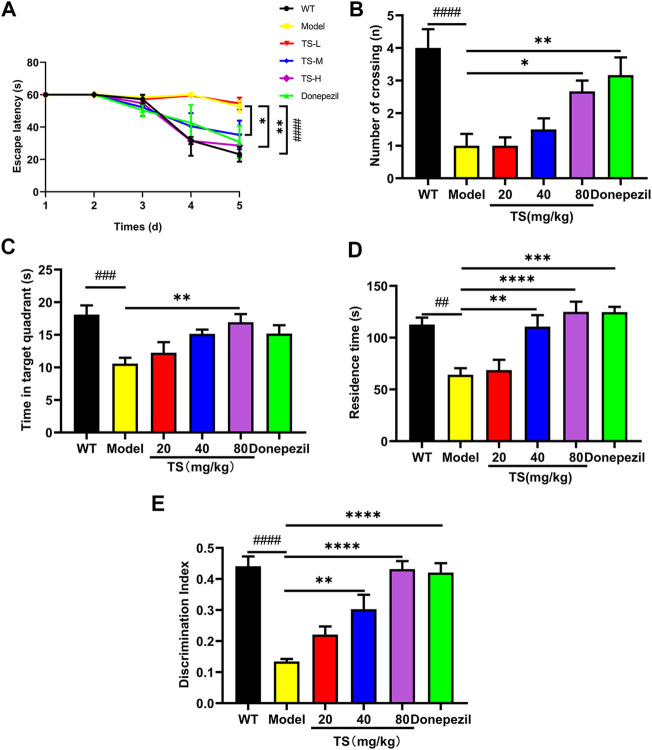
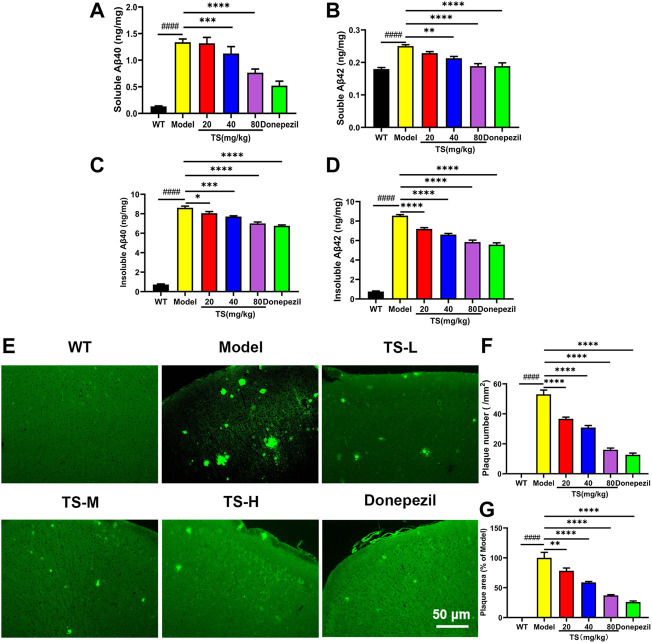
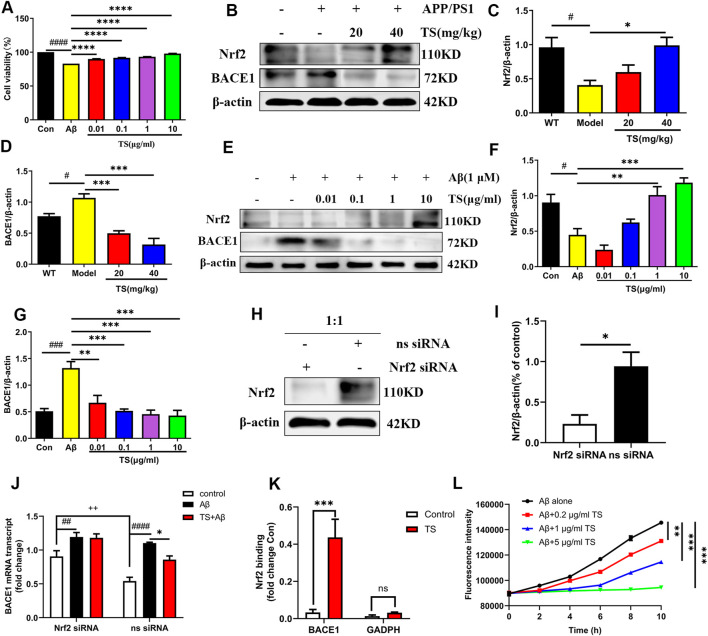
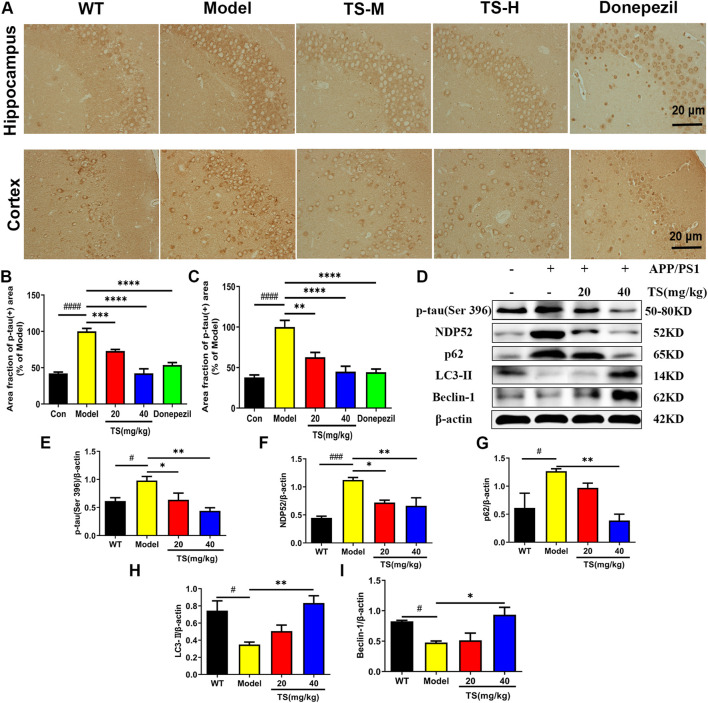
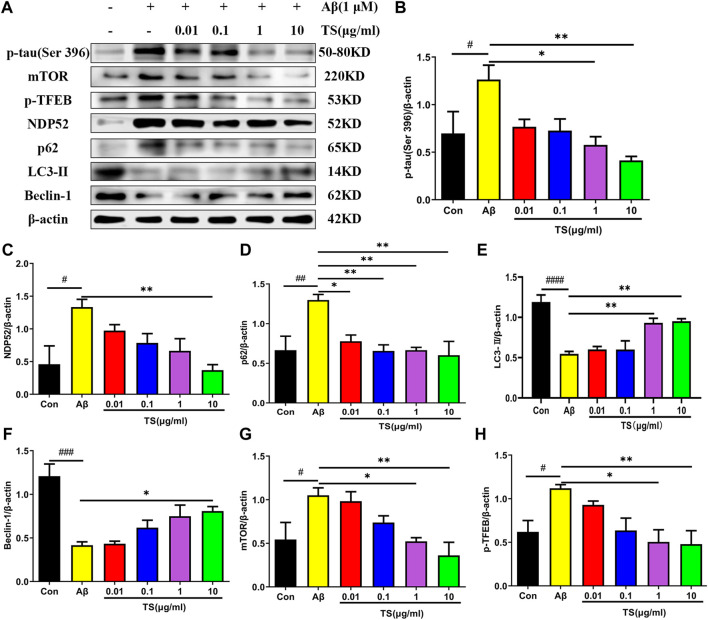
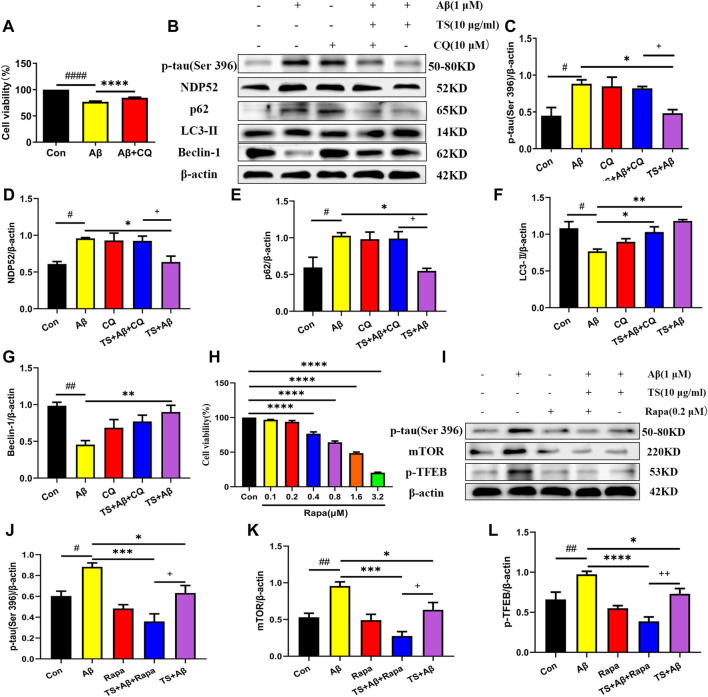
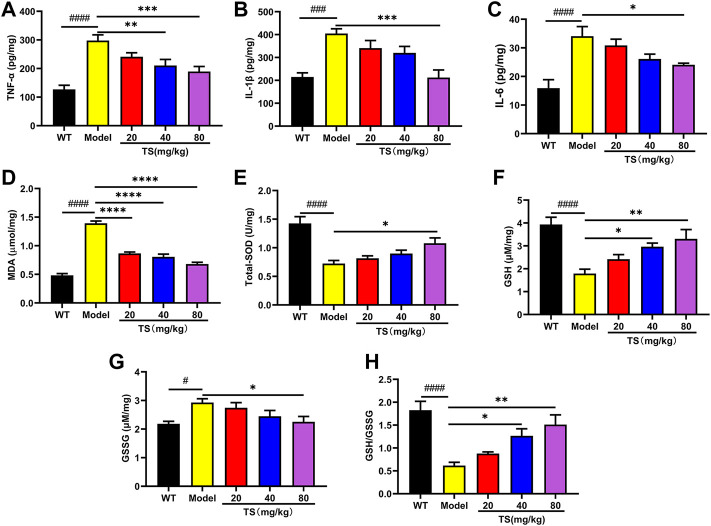
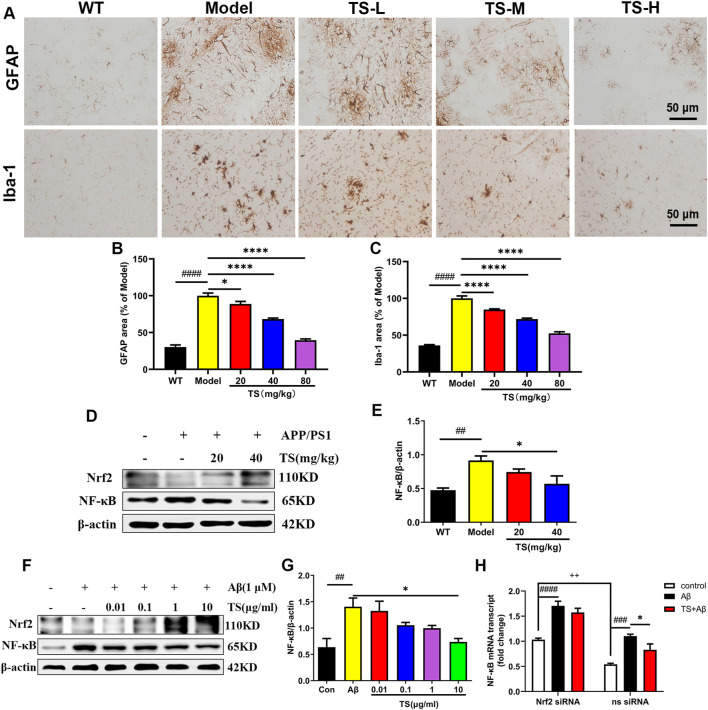
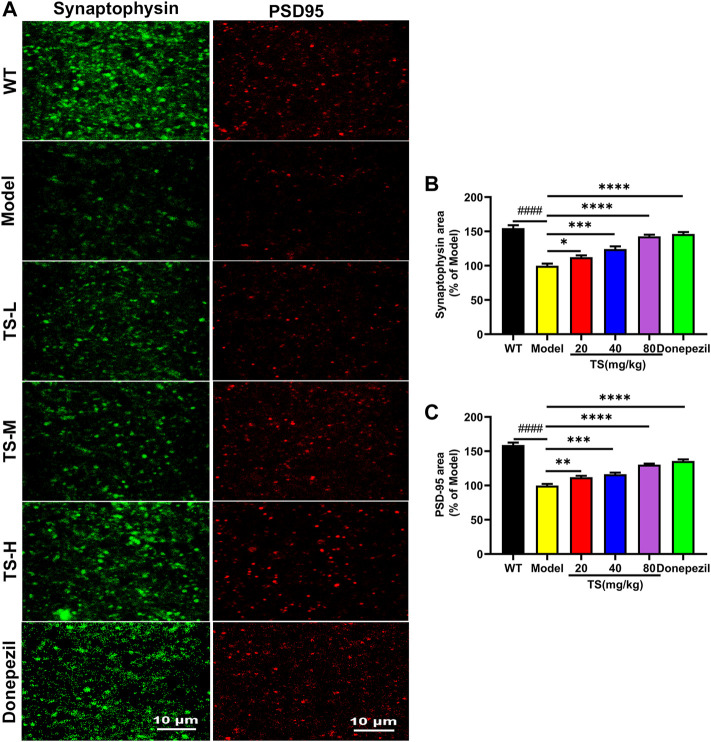
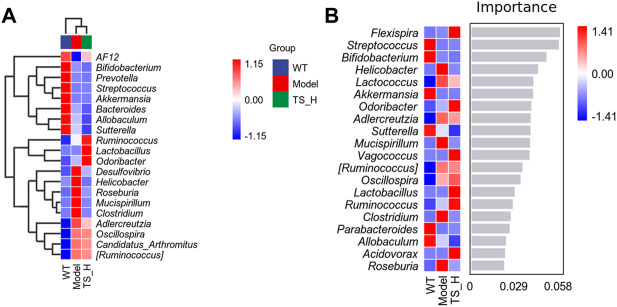
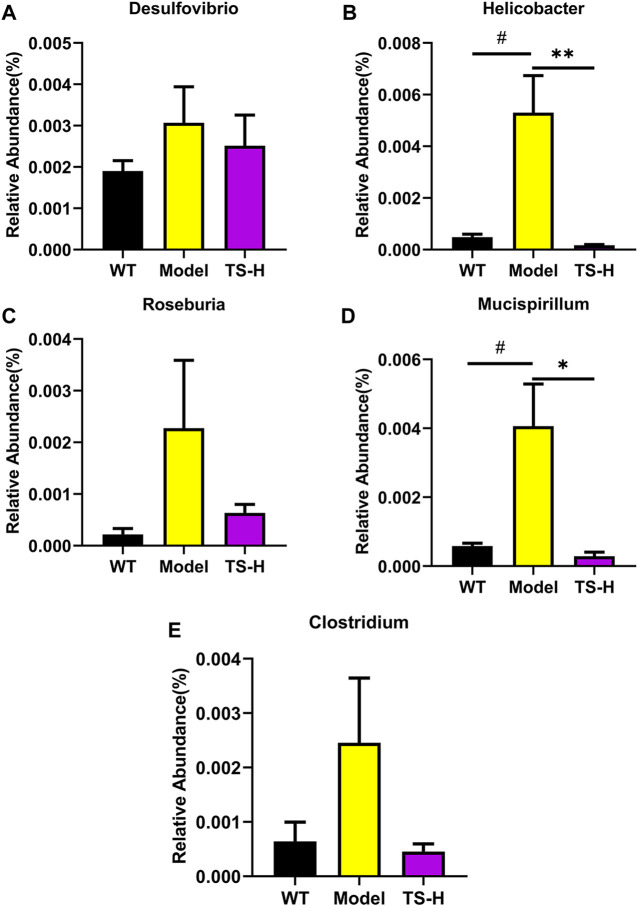
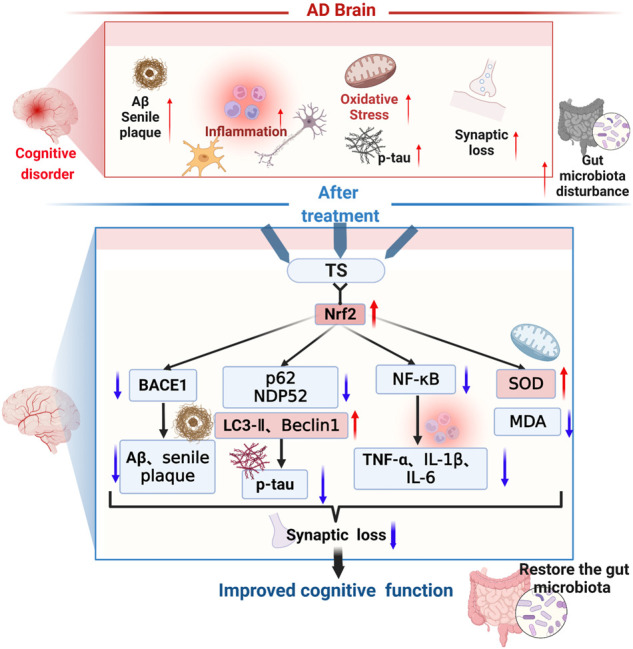
Alzheimer's disease (AD) is a neurodegenerative disease characterized by memory loss and cognitive dysfunction in the elderly, with amyloid-beta (Aβ) deposition and hyperphosphorylation of tau protein as the main pathological feature. Nuclear factor 2 (Nrf2) is a transcription factor that primarily exists in the cytosol of hippocampal neurons, and it is considered as an important regulator of autophagy, oxidative stress, and inflammation. Total saikosaponins (TS) is the main bioactive component of Radix bupleuri (Chaihu). In this study, it was found that TS could ameliorate cognitive dysfunction in APP/PS1 transgenic mice and reduce Aβ generation and senile plaque deposition via activating Nrf2 and downregulating the expression of β-secretase 1 (BACE1). In addition, TS can enhance autophagy by promoting the expression of Beclin-1 and LC3-II, increasing the degradation of p62 and NDP52 and the clearance of phosphorylated tau (p-tau), and reducing the expression of p-tau. It can also downregulate the expression of nuclear factor-κB (NF-κB) to inhibit the activation of glial cells and reduce the release of inflammatory factors. In vitro experiments using PC12 cells induced by Aβ, TS could significantly inhibit the aggregation of Aβ and reduce cytotoxicity. It was found that Nrf2 knock-out weakened the inhibitory effect of TS on BACE1 and NF-κB transcription in PC12 cells. Moreover, the inhibitory effect of TS on BACE1 transcription was achieved by promoting the binding of Nrf2 and the promoter of BACE1 ARE1. Results showed that TS downregulated the expression of BACE1 and NF-κB through Nrf2, thereby reducing the generation of Aβ and inhibiting neuroinflammation. Furthermore, TS can ameliorate synaptic loss and alleviate oxidative stress. In gut microbiota analysis, dysbiosis was demonstrated in APP/PS1 transgenic mice, indicating a potential link between gut microbiota and AD. Furthermore, TS treatment reverses the gut microbiota disorder in APP/PS1 mice, suggesting a therapeutic strategy by remodeling the gut microbe. Collectively, these data shows that TS may serve as a potential approach for AD treatment. Further investigation is needed to clarify the detailed mechanisms underlying TS regulating gut microbiota and oxidative stress.

Keywords: Alzheimer’s disease; Aβ; Nrf2; autophagy; gut microbiota; p-tau; total saikosaponins.


Conflict of interest statement

The authors declare that the research was conducted in the absence of any commercial or financial relationships that could be construed as a potential conflict of interest.

Figures

FIGURE 1
FIGURE 1
Diagram of behavioral experimental equipment. (A) Schematic diagram of Y-maze experimental device. (B) Schematic diagram of NOR experiment. (C) Schematic diagram of Morris water maze device.
FIGURE 2
FIGURE 2
TS ameliorated cognitive impairment in APP/PS1 mice. (A) The effect of TS on the escape latency in APP/PS1 mice was investigated by Morris water maze (#### p < 0.0001, * p = 0.0277, ** p = 0.0010). (B) The effect of TS on the number of crossing platform in APP/PS1 mice was investigated by Morris water maze (#### p < 0.0001, * p = 0.0353, ** p = 0.0044). (C) The effect of TS on the time spent in the target quadrant in APP/PS1 mice by Morris water maze (### p = 0.0007, ** p = 0.0042). (D) The effect of TS on the residence time in APP/PS1 mice was evaluated by Y-maze test (## p = 0.0015, ** p = 0.0024, *** p = 0.001, **** p < 0.0001). (E) The effect of TS on the discrimination index in APP/PS1 mice was investigated by NOR test (#### p < 0.0001, ** p = 0.0021, **** p < 0.0001). # Compared with WT group; * Compared with model group. Data are presented as mean ± S.E.M. (n = 10).
FIGURE 3
FIGURE 3
TS treatment decreased the levels of Aβ and senile plaque in the brain of APP/PS1 mice. (A) The effect of TS on the levels of soluble Aβ40 in the brain of APP/PS1 mice was measured by ELISA (#### p < 0.0001, *** p = 0.0003, **** p < 0.0001). (B) The effect of TS on the levels of soluble Aβ42 in the brain of APP/PS1 mice was measured by ELISA (#### p < 0.0001, ** p = 0.0015, **** p < 0.0001). (C) The effect of TS on the levels of insoluble Aβ40 in the brain of APP/PS1 mice was measured by ELISA (#### p < 0.0001, * p = 0.0220, *** p = 0.0002, **** p < 0.0001). (D) The effect of TS on the levels of insoluble Aβ42 in the brain of APP/PS1 mice was measured by ELISA (#### p < 0.0001, **** p < 0.0001). (E) The effect of TS on the senile plaque in the brain of APP/PS1 mice was investigated by ThS fluorescence. (F) Quantitative analysis of the number of senile plaques in the brain of APP/PS1 mice (#### p < 0.0001, **** p < 0.0001). (G) Quantitative analysis of the positive area of senile plaques in the brain of APP/PS1 mice (#### p < 0.0001, ** p = 0.0069, **** p < 0.0001). #Compared with WT group; *Compared with model group. Data are presented as mean ± SEM (n = 6).
FIGURE 4
FIGURE 4
TS treatment promoted Nrf2 to inhibit the expression of BACE1 in the brain of APP/PS1 mice. (A) The effect of TS on the survival rate of Aβ-induced PC12 cells for 24 h was evaluated by MTT assay (#### p < 0.0001, **** p < 0.0001). (B) The effect of TS on Nrf2 and BACE1 proteins in the brain of APP/PS1 mice were detected by Western blot. (C) Quantitative analysis of the relative expression level of Nrf2 protein in each group (# p = 0.0195, * p = 0.0151). (D) Quantitative analysis of the relative expression level of BACE1 protein in each group (# p = 0.0343, *** p = 0.0008, *** p = 0.001). (E) The effect of TS on Nrf2 and BACE1 protein in Aβ-induced PC12 cells were detected by Western blot. (F) Quantitative analysis of the relative expression concertation of Nrf2 protein in each group (# p = 0.0119, ** p = 0.0027, *** p = 0.0003). (G) Quantitative analysis of the relative expression concertation of BACE1 protein in each group (### p = 0.0003, ** p = 0.0016, *** p = 0.0003, *** p = 0.0002, *** p = 0.0001). (H) PC12 cells were transfected with Nrf2-siRNA and transfection reagent at 1:1 for 36h, and the expression of Nrf2 was detected by Western blotting. (I) Quantitative analysis of the relative expression level of Nrf2 protein in Nrf2-siRNA and ns-siRNA groups (* p = 0.0199). (J) The effect of TS on transcription the level of BACE1 in Nrf2−/− PC12 cells was investigated by qPCR (## p = 0.0093, #### p < 0.0001, * p = 0.0234, ++ p = 0.0030). (K) The effect of TS on the level of Nrf2 and BACE1 promoter binding was investigated by CHIP experiment (*** p = 0.0008). (L) The effect of TS on the level of Aβ aggregation was detected by ThT fluorescence method (** p = 0.0058, *** p = 0.0003, *** p = 0.0002). #: Comparing with WT group; *: Compared with model group; +: Compared with ns siRNA group. Data are presented as mean ± SEM (n = 3).
FIGURE 5
FIGURE 5
Effects of TS on expressions of p-tau, NDP52, p62 and LC3-II proteins in APP/PS1 mice. (A) The effect of TS on p-tau (ser396) in hippocampus and cortex of APP/PS1 mice was investigated by immunohistochemistry. (B) Quantitative analysis of the percentage of p-tau (Ser396) positive area in the hippocampus of APP/PS1 mice (#### p < 0.0001, ***p = 0.0007, ****p < 0.0001). (C) Quantitative analysis of the percentage of p-tau (Ser396) positive area in the cortex of APP/PS1 mice (#### p < 0.0001, **p = 0.0016, ****p < 0.0001). (D) The effects of TS on expressions of p-tau (Ser 396), NDP52, p62 and LC3-II proteins in the brain of APP/PS1 mice were detected by Western blot. (E) Quantitative analysis of the relative expression level of p-tau (Ser 396) protein in each group (# p = 0.0332, * p = 0.0436, ** p = 0.0042). (F) Quantitative analysis of the relative expression level of NDP52 protein in each group (### p = 0.0008, *p = 0.0177, **p = 0.0086). (G) Quantitative analysis of the relative expression level of p62 protein in each group (# p = 0.0379, **p = 0.0086). (H) Quantitative analysis of the relative expression level of LC3-II protein in each group (# p = 0.0216, ** p = 0.0073). (I) Quantitative analysis of the relative expression level of Beclin-1 protein in each group (# p = 0.0496, *p = 0.0136). #Compared with WT group; *Compared with model group. Data are presented as mean ± SEM (n = 3).
FIGURE 6
FIGURE 6
TS treatment promoted autophagy and clear p-tau. (A) The effect of TS on p-tau (Ser 396), NDP52, p62 and LC3-II and Beclin-1 proteins in the Aβ-induced PC12 cells were detected by Western blot. (B) Quantitative analysis of the relative expression concertation of p-tau (Ser 396) protein in each group (# p = 0.0409, *p = 0.0130, **p = 0.0029). (C) Quantitative analysis of the relative expression concertation of NDP52 protein in each group (# p = 0.0113, **p = 0.0057). (D) Quantitative analysis of the gray value of p62 protein bands in each group (## p = 0.0093, *p = 0.0312, **p = 0.0084, **p = 0.0093, **p = 0.0047). (E) Quantitative analysis of the relative expression concertation of LC3-II protein in each group (#### p < 0.0001, **p = 0.0053, **p = 0.0037). (F) Quantitative analysis of the relative expression concertation of Beclin-1 protein in each group (### p = 0.0002, *p = 0.0356). (G) Quantitative analysis of the relative expression level of mTOR protein in each group (# p = 0.0450, *p = 0.0359, **p = 0.0068). (H) Quantitative analysis of the relative expression level of p-TFEB protein in each group (# p = 0.0435, *p = 0.0129, **p = 0.0099). #Compared with WT group; *Compared with model group. Data are presented as mean ± SEM (n = 3).
FIGURE 7
FIGURE 7
TS promoted autophagy in Aβ-induced PC12 cells to clear p-tau. (A) The effect of CQ on the survival rate of Aβ-induced PC12 cells for 24 h was evaluated by MTT assay (#### p < 0.0001, **** p < 0.0001). (B) The effects of CQ on expression of p-tau (Ser 396), NDP52, p62, LC3-II and Beclin-1 proteins in the Aβ-induced PC12 cells after TS treatment were detected by Western blot. (C) Quantitative analysis of the relative expression level of p-tau (Ser 396) protein in each group (# p = 0.0128, *p = 0.0205, + p = 0.0495). (D) Quantitative analysis of the relative expression level of NDP52 protein in each group (# p = 0.0134, *p = 0.0217, + p = 0.0386). (E) Quantitative analysis of the relative expression level of p62 protein bands in each group (# p = 0.0226, *p = 0.0124, + p = 0.0200). (F) Quantitative analysis of the relative expression level of LC3-II protein in each group (# p = 0.0101, *p = 0.0277, **p = 0.0016). (G) Quantitative analysis of the relative expression level of Beclin-1 protein in each group (## p = 0.0013, **p = 0.0056). (H) MTT assay was used to test the effect of Rapa on PC12 cells for 24 h (**** p < 0.0001). (I) The effects of Rapa on expression of p-tau (Ser 396), mTOR and p-TFEB proteins in the Aβ-induced PC12 cells after TS treatment were detected by Western blot. (J) Quantitative analysis of the relative expression level of p-tau (Ser 396) protein in each group (# p = 0.00175, ***p = 0.0002, *p = 0.0315, + p = 0.0442). (K) Quantitative analysis of the relative expression level of mTOR protein in each group (## p = 0.0062, ***p = 0.0002, *p = 0.0305, + p = 0.0250). (L) Quantitative analysis of the relative expression level of p-TFEB protein in each group (## p = 0.0041, ****p < 0.0001, *p = 0.0288, ++ p = 0.0081). #: Compared with WT group; *Compared with model group; +Comparing with TS+Aβ group. Data are presented as mean ± SEM (n = 3).
FIGURE 8
FIGURE 8
TS treatment inhibited cerebral inflammation and oxidative stress in APP/PS1 mice. (A) The effect of TS on the levels of TNF-α in the brain of APP/PS1 mice was measured by ELISA (#### p < 0.0001, **p = 0.0065, ***p = 0.0008). (B) The effect of TS on the levels of IL-1β in the brain of APP/PS1 mice was measured by ELISA (### p 0.0002, ***p = 0.0002). (C) The effect of TS on the levels of IL-6 in the brain of APP/PS1 mice was measured by ELISA (#### p < 0.0001, *p = 0.0209). (D) The effect of TS on the levels of MDA in the brain of APP/PS1 mice was measured by ELISA (#### p < 0.0001, ****p < 0.0001). (E) The effect of TS on the levels of SOD in the brain of APP/PS1 mice was measured by ELISA (#### p < 0.0001, *p = 0.0129). (F) The effect of TS on the levels of GSH in the brain of APP/PS1 mice was measured by ELISA (#### p < 0.0001, *p = 0.0177, **p = 0.0020). (G) The effect of TS on the levels of GSG in the brain of APP/PS1 mice was measured by ELISA (# p = 0.0123, *p = 0.0248). (H) Quantitative analysis of the ratio of GSH/GSSG (#### p < 0.0001, *p = 0.0178, **p = 0.0010). #Compared with WT group; *Compared with model group. Data are presented as mean ± SEM (n = 6).
FIGURE 9
FIGURE 9
TS treatment reduced astrocytes and microglia activation in APP/PS1 mice. (A) The effects of TS on the activation of astrocytes and microglia in the brain of APP/PS1 mice were investigated by immunohistochemical staining. (B) Quantitative analysis of the percentage of GFAP positive area in the brain of APP/PS1 mice (#### p < 0.0001, *p = 0.0312, ****p < 0.0001). (C) Quantitative analysis of the percentage of Iba-1 positive area in the brain of APP/PS1 mice (#### p < 0.0001, ****p < 0.0001). (D) The effects of TS on expressions of Nrf2 and NF-κB proteins in the brain of APP/PS1 mice were detected by Western blot. (E) Quantitative analysis of the relative expression level of NF-κB protein in each group (## p = 0.0068, *p = 0.0243). (F) The effects of TS on expressions of Nrf2 and NF-κB proteins in the Aβ-induced PC12 cells were detected by Western blot. (G) Quantitative analysis of the relative expression level of NF-κB protein in each group (## p = 0.0048, *p = 0.0126). (H) The effect of TS on the transcription level of NF-κB in Nrf2−/− PC12 cells was detected by qPCR. (### p = 0.0003, #### p < 0.0001, * p = 0.0382, ++ p = 0.0013). #Compared with WT group; *Compared with model group; +Compared with ns siRNA group. Data are presented as mean ± SEM (n = 3).
FIGURE 10
FIGURE 10
TS treatment improved synaptic dysfunction in APP/PS1 mice. (A) The effect of TS on the level of synaptophysin and PSD-95 in the brain of APP/PS1 mice was investigated by immunofluorescence assay. (B) Quantitative analysis of the percentage of synaptophysin positive area in the brain of APP/PS1 mice (#### p < 0.0001, *p = 0.0496, ****p < 0.0001). (C) Quantitative analysis of the percentage of PSD-95 positive area in the brain of APP/PS1 mice (#### p < 0.0001, **p = 0.0059, ***p = 0.0002, ****p < 0.0001). #Compared with WT group; *Compared with model group. Data are presented as mean ± SEM (n = 6).
FIGURE 11
FIGURE 11
Differences in the diversity and composition of gut microbial genes among WT mice, APP/PS1 mice and TS treatment APP/PS1 mice. (A) Alpha diversity analysis-Chao1 index and Observed species index box chart. (B) Venn diagram. (C) Column pictures of relative abundance and composition of gut microbiota at phylum level in each group. *p < 0.05 versus WT group (n = 5).
FIGURE 12
FIGURE 12
Heatmaps of most differentially abundant taxa in WT mice, APP/PS1 mice and TS treatment APP/PS1 mice. (A) Heat-map of microbial community composition. (B) Random forest analysis map. n = 5 for each treatment.
FIGURE 13
FIGURE 13
Relative abundance of five representative microbial species at the genus levels in WT mice, APP/PS1 mice and TS treatment APP/PS1 mice. (A) Desulfovibrio. (B) Helicobacter (# p = 0.0113, **p = 0.0084). (C) Roseburia. (D) Mucispirillum (# p = 0.0239, *p = 0.0169). (E) Clostridium. Data were expressed as mean ± SEM. #Compared with WT group; *Compared with model group (n = 3).
FIGURE 14
FIGURE 14
The therapeutic effects and related mechanisms of TS against AD. The following pathological phenomena occur in the AD brain: (1) increased Aβ generation, aggregation and increased deposition of senile plaques; (2) enhanced activation of microglia and astrocytes, elevated inflammatory cytokines levels; (3) increased oxidative stress and decreased secretion of antioxidant stress factors; (4) increased synaptic loss; (5) aggravated gut mictobiota dysbiosis and increased the pathogenic bacteria. Finally, these pathological changes led to the cognitive dysfunction of the AD patients. TS treatment could improve cognitive function through multiple mechanisms. Firstly, TS regulated the transcription and expression of BACE1 via Nrf2, reduced the generation and aggregation of Aβ, thus inhibited the deposition of senile plaque. Secondly, TS downregulated the expression of p62 and NDP52 by promoting autophagy, upregulated the expression of LC3-II and Beclin-1, thus promoting the clearance of p-tau. Thirdly, TS downregulated the transcription and expression of NF-κB via Nrf2, reduced the levels of inflammatory cytokines, thus ameliorated the neuroinflammation. Fourthly, TS increased the level of SOD and reduced the level of MDA, alleviating oxidative stress. Eventually, TS ameliorated synapse loss and alleviated the gut microbiota dysbiosis. Red arrows represent upregulation and blue arrows represent downregulation. AD, Alzheimer’s disease; TS, Total saikosaponins; Nrf2, nuclear factor 2; BACE1, β-secretase 1; Aβ, amyloid-beta; p-tau, phosphorylated tau; NF-κB, nuclear factor-κB; TNF-α, tumour necrosis factor α; IL-1β, interleukin-1β; IL-6, interleukin-6; SOD, superoxide dismutase; MDA, malondialdehyde.

Similar articles

Cited by

References

    1. Bahn G., Park J. S., Yun U. J., Lee Y. J., Choi Y., Park J. S., et al. (2019). NRF2/ARE pathway negatively regulates BACE1 expression and ameliorates cognitive deficits in mouse Alzheimer's models. Proc. Natl. Acad. Sci. U. S. A. 116 (25), 12516–12523. 10.1073/pnas.1819541116 - DOI - PMC - PubMed
    1. Balamurugan M., Santharaman P., Madasamy T., Rajesh S., Sethy N. K., Bhargava K., et al. (2018). Recent trends in electrochemical biosensors of superoxide dismutases. Biosens. Bioelectron. 116, 89–99. 10.1016/j.bios.2018.05.040 - DOI - PubMed
    1. Bao J., Zheng L., Zhang Q., Li X., Zhang X., Li Z., et al. (2016). Deacetylation of TFEB promotes fibrillar Aβ degradation by upregulating lysosomal biogenesis in microglia. Protein Cell. 7 (6), 417–433. 10.1007/s13238-016-0269-2 - DOI - PMC - PubMed
    1. Branca C., Ferreira E., Nguyen T. V., Doyle K., Caccamo A., Oddo S., et al. (2017). Genetic reduction of Nrf2 exacerbates cognitive deficits in a mouse model of Alzheimer's disease. Hum. Mol. Genet. 26 (24), 4823–4835. 10.1093/hmg/ddx361 - DOI - PMC - PubMed
    1. Busche M. A., Hyman B. T. (2020). Synergy between amyloid-beta and tau in Alzheimer's disease. Nat. Neurosci. 23 (10), 1183–1193. 10.1038/s41593-020-0687-6 - DOI - PMC - PubMed