

Single-Cell RNA-Sequencing Atlas Reveals the Tumor Microenvironment of Metastatic High-Grade Serous Ovarian Carcinoma
- PMID: 35935940
- PMCID: PMC9354882
- DOI: 10.3389/fimmu.2022.923194
Single-Cell RNA-Sequencing Atlas Reveals the Tumor Microenvironment of Metastatic High-Grade Serous Ovarian Carcinoma
Abstract
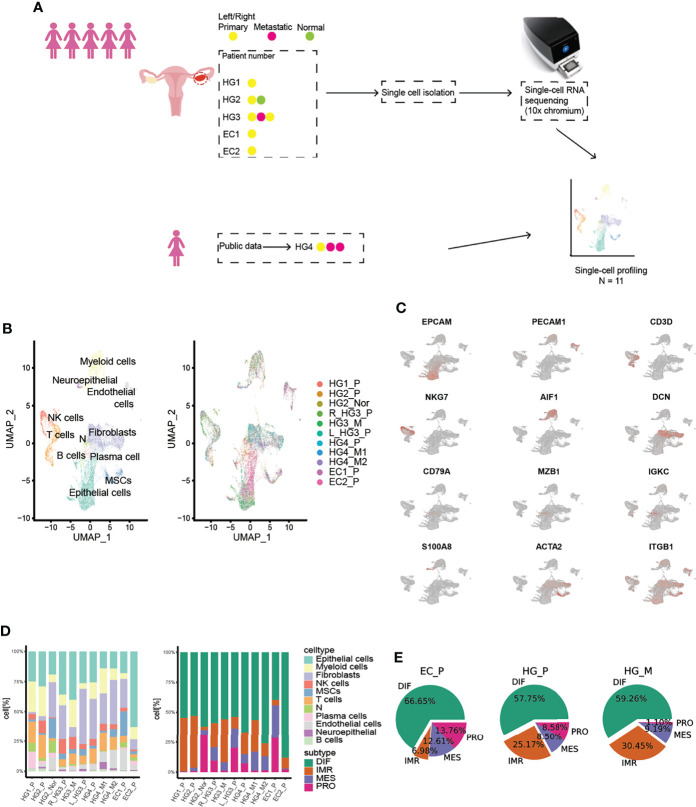
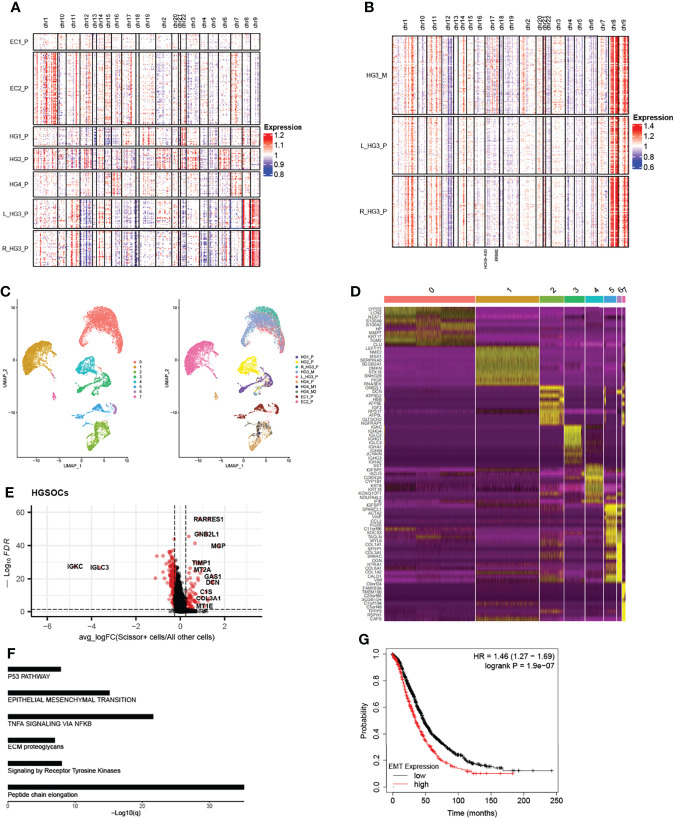
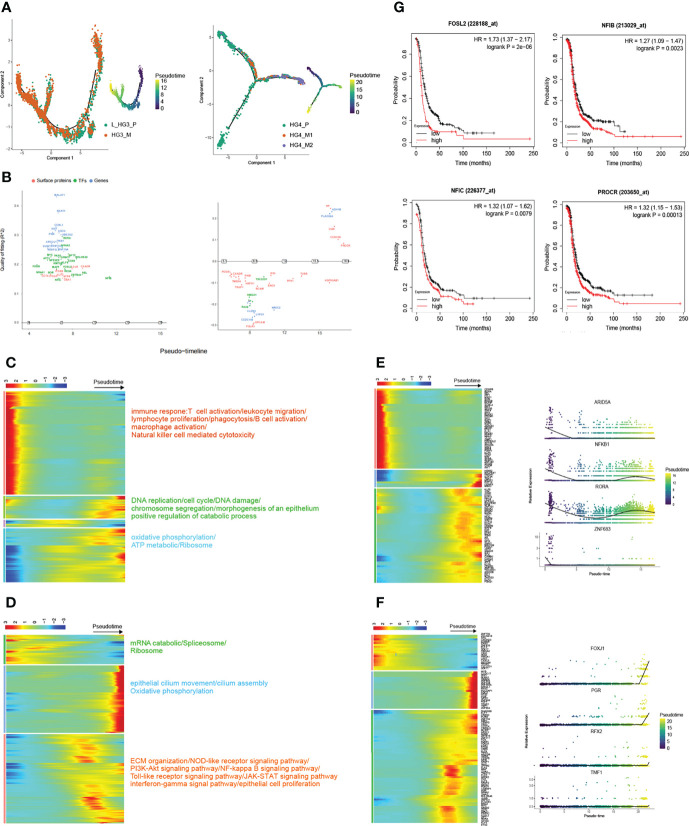
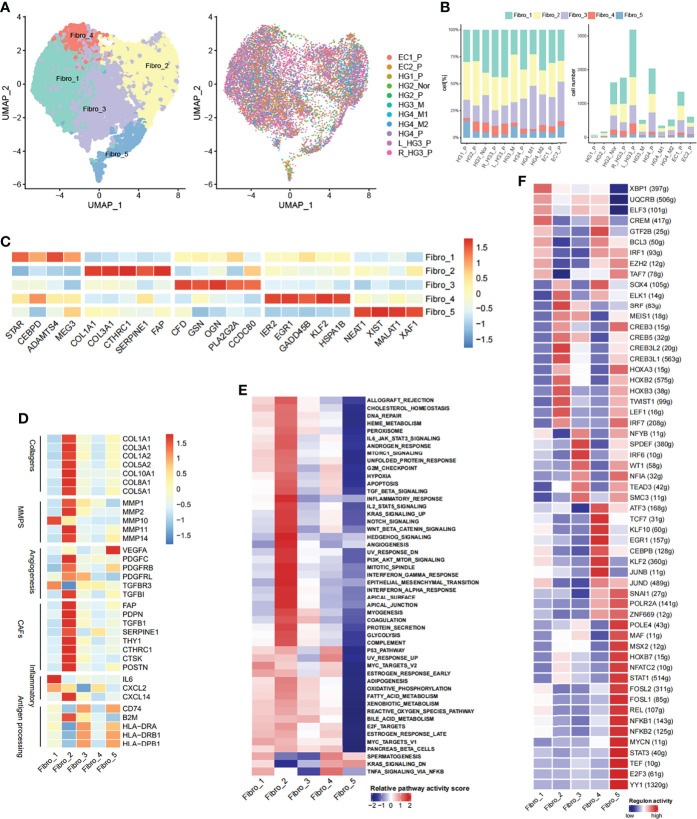
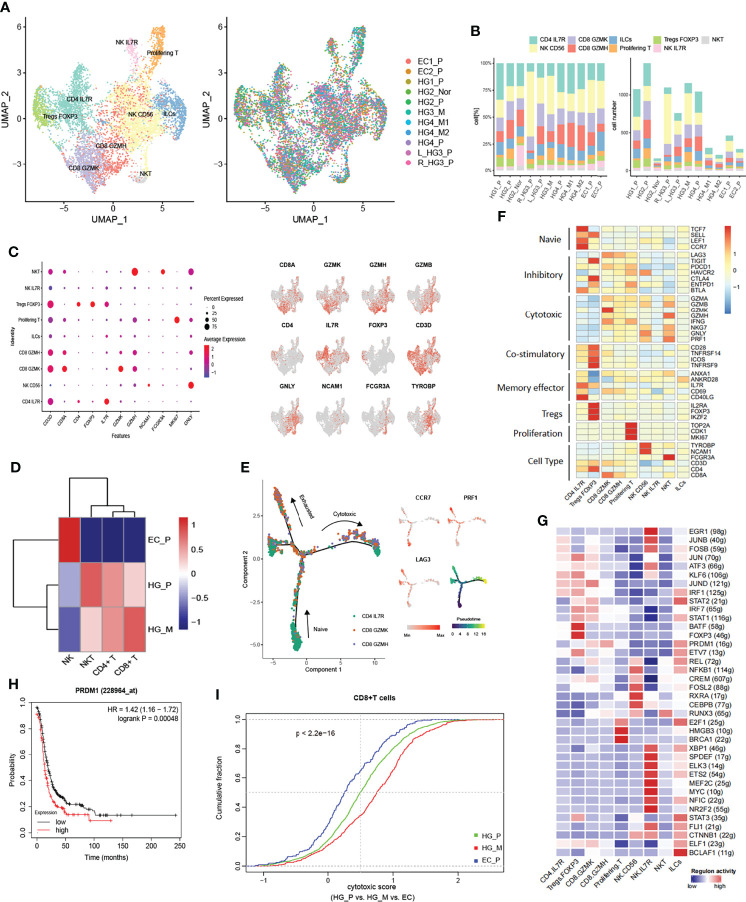
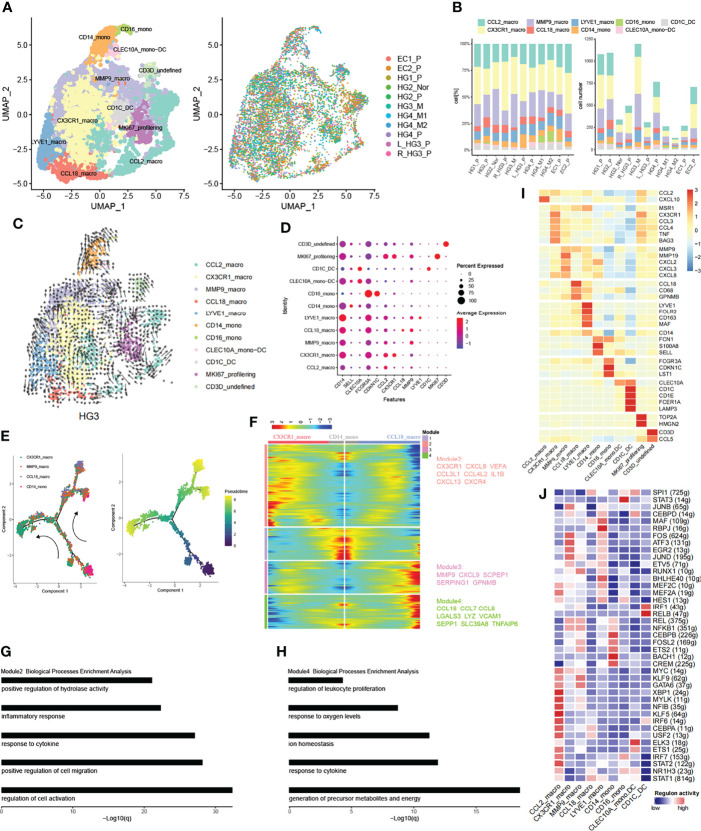
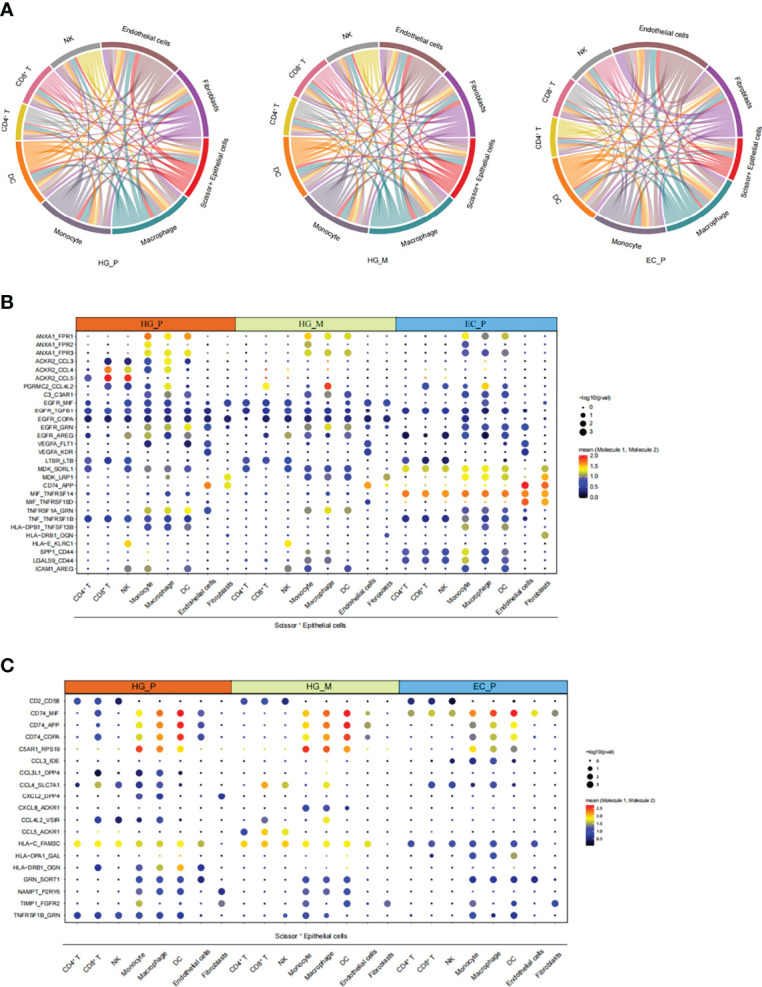
Ovarian cancer is the most common and lethal gynecological tumor in women worldwide. High-grade serous ovarian carcinoma (HGSOC) is one of the histological subtypes of epithelial ovarian cancer, accounting for 70%. It often occurs at later stages associated with a more fatal prognosis than endometrioid carcinomas (EC), another subtype of epithelial ovarian cancer. However, the molecular mechanism and biology underlying the metastatic HGSOC (HG_M) immunophenotype remain poorly elusive. Here, we performed single-cell RNA sequencing analyses of primary HGSOC (HG_P) samples, metastatic HGSOC (HG_M) samples, and endometrioid carcinomas (EC) samples. We found that ERBB2 and HOXB-AS3 genes were more amplified in metastasis tumors than in primary tumors. Notably, high-grade serous ovarian cancer metastases are accompanied by dysregulation of multiple pathways. Malignant cells with features of epithelial-mesenchymal transition (EMT) affiliated with poor overall survival were identified. In addition, cancer-associated fibroblasts with EMT-program were enriched in HG_M, participating in angiogenesis and immune regulation, such as IL6/STAT3 pathway activity. Compared with ECs, HGSOCs exhibited higher T cell infiltration. PRDM1 regulators may be involved in T cell exhaustion in ovarian cancer. The CX3CR1_macro subpopulation may play a role in promoting tumor progression in ovarian cancer with high expression of BAG3, IL1B, and VEGFA. The new targets we discovered in this study will be useful in the future, providing guidance on the treatment of ovarian cancer.
Keywords: T cells; high-grade serous ovarian carcinoma; myeloid cells; scRNA-seq; tumor microenvironment.
Copyright © 2022 Deng, Tan, Zhou, Bai, Cao, Zhong, Huang, Ou, Guo, Liu, Yin, Chen, Luo, Sun and Sheng.
Conflict of interest statement
The authors declare that the research was conducted in the absence of any commercial or financial relationships that could be construed as a potential conflict of interest.
Figures
Similar articles
-
Characterizing tumor biology and immune microenvironment in high-grade serous ovarian cancer via single-cell RNA sequencing: insights for targeted and personalized immunotherapy strategies.Front Immunol. 2025 Jan 17;15:1500153. doi: 10.3389/fimmu.2024.1500153. eCollection 2024. Front Immunol. 2025. PMID: 39896800 Free PMC article.
-
Single-Cell RNA Sequencing Reveals the Tissue Architecture in Human High-Grade Serous Ovarian Cancer.Clin Cancer Res. 2022 Aug 15;28(16):3590-3602. doi: 10.1158/1078-0432.CCR-22-0296. Clin Cancer Res. 2022. PMID: 35675036 Free PMC article.
-
Deciphering tumor immune microenvironment differences between high-grade serous and endometrioid ovarian cancer to investigate their potential in indicating immunotherapy response.J Ovarian Res. 2023 Nov 22;16(1):223. doi: 10.1186/s13048-023-01284-1. J Ovarian Res. 2023. PMID: 37993916 Free PMC article.
-
Morphological subtypes of ovarian carcinoma: a review with emphasis on new developments and pathogenesis.Pathology. 2011 Aug;43(5):420-32. doi: 10.1097/PAT.0b013e328348a6e7. Pathology. 2011. PMID: 21716157 Review.
-
Overview of Tumor Heterogeneity in High-Grade Serous Ovarian Cancers.Int J Mol Sci. 2023 Oct 11;24(20):15077. doi: 10.3390/ijms242015077. Int J Mol Sci. 2023. PMID: 37894756 Free PMC article. Review.
Cited by
-
Serine/threonine kinase 36 induced epithelial-mesenchymal transition promotes docetaxel resistance in prostate cancer.Sci Rep. 2024 Jan 6;14(1):729. doi: 10.1038/s41598-024-51360-9. Sci Rep. 2024. PMID: 38184689 Free PMC article.
-
Metastasis-associated fibroblasts in peritoneal surface malignancies.Br J Cancer. 2024 Aug;131(3):407-419. doi: 10.1038/s41416-024-02717-4. Epub 2024 May 23. Br J Cancer. 2024. PMID: 38783165 Free PMC article. Review.
-
The emergence of DNAM-1 as the facilitator of NK cell-mediated killing in ovarian cancer.Front Immunol. 2025 Jan 6;15:1477781. doi: 10.3389/fimmu.2024.1477781. eCollection 2024. Front Immunol. 2025. PMID: 39835114 Free PMC article.
-
Multi‑omics identification of a novel signature for serous ovarian carcinoma in the context of 3P medicine and based on twelve programmed cell death patterns: a multi-cohort machine learning study.Mol Med. 2025 Jan 8;31(1):5. doi: 10.1186/s10020-024-01036-x. Mol Med. 2025. PMID: 39773329 Free PMC article.
-
The dynamic immune behavior of primary and metastatic ovarian carcinoma.NPJ Precis Oncol. 2025 Apr 25;9(1):120. doi: 10.1038/s41698-025-00818-8. NPJ Precis Oncol. 2025. PMID: 40281242 Free PMC article.
References
-
- Lheureux S, Cristea MC, Bruce JP, Garg S, Cabanero M, Mantia-Smaldone G, et al. . Adavosertib Plus Gemcitabine for Platinum-Resistant or Platinum-Refractory Recurrent Ovarian Cancer: A Double-Blind, Randomised, Placebo-Controlled, Phase 2 Trial. Lancet (2021) 397(10271):281–92. doi: 10.1016/S0140-6736(20)32554-X - DOI - PMC - PubMed
Publication types
MeSH terms
Substances
LinkOut - more resources
Full Text Sources
Medical
Research Materials
Miscellaneous