. 2022 Jul 22:13:941243.
doi: 10.3389/fimmu.2022.941243. eCollection 2022.

Efficient cellular and humoral immune response and production of virus-neutralizing antibodies by the Hepatitis B Virus S/preS116-42 antigen

Affiliations

Efficient cellular and humoral immune response and production of virus-neutralizing antibodies by the Hepatitis B Virus S/preS116-42 antigen

Ana-Maria Pantazica et al. Front Immunol. .

Abstract

Despite the availability of improved antiviral therapies, infection with Hepatitis B virus (HBV) remains a3 significant health issue, as a curable treatment is yet to be discovered. Current HBV vaccines relaying on the efficient expression of the small (S) envelope protein in yeast and the implementation of mass vaccination programs have clearly contributed to containment of the disease. However, the lack of an efficient immune response in up to 10% of vaccinated adults, the controversies regarding the seroprotection persistence in vaccine responders and the emergence of vaccine escape virus mutations urge for the development of better HBV immunogens. Due to the critical role played by the preS1 domain of the large (L) envelope protein in HBV infection and its ability to trigger virus neutralizing antibodies, including this protein in novel vaccine formulations has been considered a promising strategy to overcome the limitations of S only-based vaccines. In this work we aimed to combine relevant L and S epitopes in chimeric antigens, by inserting preS1 sequences within the external antigenic loop of S, followed by production in mammalian cells and detailed analysis of their antigenic and immunogenic properties. Of the newly designed antigens, the S/preS116-42 protein assembled in subviral particles (SVP) showed the highest expression and secretion levels, therefore, it was selected for further studies in vivo. Analysis of the immune response induced in mice vaccinated with S/preS116-42- and S-SVPs, respectively, demonstrated enhanced immunogenicity of the former and its ability to activate both humoral and cellular immune responses. This combined activation resulted in production of neutralizing antibodies against both wild-type and vaccine-escape HBV variants. Our results validate the design of chimeric HBV antigens and promote the novel S/preS1 protein as a potential vaccine candidate for administration in poor-responders to current HBV vaccines.

Keywords: HBV; SVP; adjuvants; antigens; chimeric proteins; vaccine design.


Conflict of interest statement

The authors declare that the research was conducted in the absence of any commercial or financial relationships that could be construed as a potential conflict of interest.

Figures

Figure 1
Figure 1
Design of novel HBV S/preS1 antigens. (A) The amino acid sequences corresponding to the preS1 region of prevalent HBV isolates were aligned using the Blosum62 matrix. Genotypes A to H are indicated on the left side according to their GenBank annotations. The red box illustrates the preS1 antigenic region which can generate virus neutralizing antibodies (numbers in italics apply to genotype D). (B) preS1-derived sequences were inserted between amino acids 126/127 or 126/132 of the antigenic loop (AGL, depicted in light blue) of the S protein. The unique N-glycosylation site at position N146 of the S protein is also shown (Y).
Figure 2
Figure 2
Expression of novel HBV S/preS1 antigens in mammalian cells. HEK293T cells were transfected with pCi plasmids encoding the indicated antigens or the empty pCi plasmid as control (C). (A) Cell lysates were analyzed by western blot under reducing (+DTT) conditions. (B) Cell lysates were analyzed by western blot under non-reducing (-DTT) conditions. Glycosylated (gp) or non-glycosylated (p) S/preS1 proteins were detected with anti-preS1 antibodies. Tubulin was used as a loading control. Representative images are shown (n=3).
Figure 3
Figure 3
Antigenicity of novel HBV S/preS1 antigens produced in mammalian cells. (A, B) HEK293T cells transfected with pCi plasmids encoding the indicated antigens or the empty pCi plasmid as control (C) were pulse-labelled with 35S-protein labelling mix for 30 min and chased for 3 h. Cell lysates and supernatants were immunoprecipitated with either anti-S, or anti-preS1 antibodies and bound proteins were separated by SDS-PAGE and visualized by autoradiography. (C) HEK293T cells were transfected with pCi plasmids encoding the indicated antigens or the empty pCi plasmid as control (Control) for 72 h. Secretion of the HBsAg was quantified by ELISA in cell supernatants and represented as optical density values measured at 450 nm (n=3). Data are represented as means ± SD; Student’s unpaired t test (**** p < 0,0001).
Figure 4
Figure 4
Assembly and purification of the novel S/preS116-42 antigen. (A) HEK293T cells were transfected with pCi plasmids encoding the S/preS121-47, S/preS116-42, and S antigens. Cell supernatants were collected between days 4 and 10 post-transfection, 20-fold concentrated and subjected to ultracentrifugation onto a 15-60% step sucrose gradient. Collected fractions were diluted 1000-fold and analyzed for their HBsAg content by ELISA. Results are shown as optical density values measured at 450 nm. (B) The S/preS116-42 antigen was further purified using the CaptoCore 400 resin, by gravitational flow. A representative image confirming the presence of the antigen in input sample and collected fractions, as determined by western blot using anti-preS1 antibodies is shown (n=3).
Figure 5
Figure 5
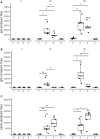
Analysis of the humoral immune response elicited by mammalian cell-derived HVB-S/preS116-42 and HVB-S antigens. (A-C) Group of five mice were immunized 3 times, at 14-day intervals with HEK293T background protein (1), HVB-S/preS116-42 (2), HBV-S (3) and Al(OH)3 adjuvant only (4). Antibody endpoint titres, (A) IgG, (B) IgG1 and (C) IgG2a, at 0, 27 and 49 days post-immunization were calculated based on a 4-parameter logistic regression curve fitted to a pool of immune sera, as the reciprocal sample dilution that would results in three times baseline + standard error as derived from the internal standard curve by multiplication (n=5). Statistical analysis was performed by using the Wilcoxon rank-sum test. Comparisons between groups at the same time point (*, p < 0.05; **, p < 0.01), time points at days 27 and 49 compared to day 0 (##, p < 0.01) and time point at day 49 compared to day 27 (&, p < 0.05) are shown.
Figure 6
Figure 6
The clustered heatmap of the cytokine secretion triggered by mammalian cell-derived HVB-S/preS116-42 and HVB-S antigens. Group of five mice were immunized 3 times, at 14-day intervals with HEK293T background protein (1), HVB-S/preS116-42 (2), HBV-S (3) and Al(OH)3 adjuvant only (4). Cytokine levels were measured in spleen cells harvested from mice of each group (1-4) after stimulation with UV-inactivated HBV (Ag) and compared with unstimulated cells (N). Concanavalin A (CONA) and CD3/CD28 antibodies (CD3/28) were added as positive controls for the in vitro stimulation assay (n=5). Clusters and dendrograms were automatically generated, by using the hclust - manhattan and wald.D2 methods, respectively, in Rstudio (version 1.4.1103, the latticeExtra and dendextend packages). Columns and rows of the heatmap matrix show the analyzed cytokines and the stimulation agents, respectively. The blue and white colours indicate high and low levels of cytokine secretion, respectively.
Figure 7
Figure 7
Binding of antibodies elicited by the HVB-S/preS116-42 antigen to HBV surface proteins. Lysates of HEK293T cells transfected with pCi plasmids encoding for the S, (A), L (B), and SΔ127-150/preS121-47 (C) proteins were used to coat 96-well plates. Serial dilutions of pooled pre-immune sera and of sera from mice immunized with S/preS116-42 were added to the plates, followed by incubation with HRP-conjugated anti-mouse secondary antibodies. Antibody binding is shown as optical density values measured at 450 nm following subtraction of those obtained for the pre-immune sera (n=3). Data are represented as means ± SD for each individual mouse.
Figure 8
Figure 8
Neutralization of WT HBV infection by S and S/preS116-42 antisera. Pooled pre-immune sera or sera from mice immunized with S, S/preS116-42, or background proteins (control) were diluted 1:50 and pre-incubated with HBV inoculum (100 Geq/cell), in medium supplemented with 4% PEG, for 1 h. HepG2hNTCP cells were incubated with the sera-treated HBV inoculum for 16 h, or maintained non-infected, as negative control (NC). Cells incubated with Myrcludex B for 3 h prior to infection were used as a control for the specificity of inhibition of HBV infection. At 16 h post-infection the medium was supplemented with 2.5% DMSO and then changed every two days. Cell media were collected at day 11 post-infection and used to quantify the HBeAg levels by ELISA. Data are shown as percentage of HBV infection in the presence of post-immune sera from infection values obtained in the presence of the pre-immune sera, at the same dilution (n=4). Values in the presence of Myrcludex B and in the negative-control represent percentages of infection from HBV-only samples (n=4). Statistical analysis was performed by using the Mann-Whitney U test. Comparisons between control and HBV-S/preS116-42 or S groups are shown (*, p < 0.05).
Figure 9
Figure 9
Neutralization of G145R HBV infection by S and S/preS116-42 antisera. (A) Huh7 cells were transfected with pGEM-4Z-HBV 1.3 WT or pGEM-4Z-HBV 1.3 G145R. Secretion of HBV particles was quantified in cell media by qPCR at day 7 post-transfection (n=4). Data are represented as means ± SD; Student’s unpaired t test (*, p < 0.05). (B) Serial dilutions of WT and G145R HBV particles were incubated with anti-S antibodies and specific binding was quantified by using the Monolisa HBsAg Ultra kit. Results are shown as optical density values measured at 450 nm (n=3). Data are represented as means ± SD. (C) HepG2hNTCP cells were incubated with WT and G145R HBV particles (100 Geq/cell) for 16 h in the presence of 4% PEG. At 16 h post-infection the medium was supplemented with 2.5% DMSO, then changed every two days. Cell media were collected at day 11 post-infection and used to quantify the HBeAg levels by ELISA. Results are shown as optical density values measured at 450 nm (n=3). Data are represented as means ± SD. (D) Pooled pre-immune sera or sera from mice immunized with S, S/preS116-42, or background proteins (control) were diluted 1:50 and pre-incubated with G145R HBV inoculum (100 Geq/cell), in medium supplemented with 4% PEG, for 1 h. HepG2hNTCP cells were incubated with the sera-treated HBV inoculum for 16 h, or maintained non-infected, as negative control (NC). Cells incubated with Myrcludex B for 3 h prior to infection were used as a control for the specificity of inhibition of HBV infection. At 16 h post-infection the medium was supplemented with 2.5% DMSO and then changed every two days. Cell media were collected at day 11 post-infection and used to quantify the HBeAg levels by ELISA. Data are shown as percentage of HBV infection in the presence of post-immune sera from values obtained in the presence of the pre-immune sera, at the same dilution (n=5). Values in the presence of Myrcludex and in the negative-control represent percentages of infection from G145R HBV-only samples (n=5). Statistical analysis was performed by using the Mann-Whitney U test. Comparisons between control and either antigen groups and between the antigen groups are shown (*, p < 0.05; **, p < 0.01; ns, no statistical significance).

Similar articles

Cited by

References

    1. Stanaway JD, Flaxman AD, Naghavi M, Fitzmaurice C, Vos T, Abubakar I, et al. . The global burden of viral hepatitis from 1990 to 2013: findings from the global burden of disease study 2013. Lancet (2016) 388(10049):1081–8. doi: 10.1016/s0140-6736(16)30579-7 - DOI - PMC - PubMed
    1. World Health Organization . Global hepatitis report, 2017. (2017), 9789241565455.
    1. World Health Organization . Hepatitis b factsheet (2021). Available at: http://www.who.int/news-room/fact-sheets/detail/hepatitis-b (Accessed 4 May 2022).
    1. World Health Organization . Global health sector strategy on viral hepatitis 2016-2021. towards ending viral hepatitis. Geneva: world health organization; (2016).
    1. Cox AL, El-Sayed MH, Kao J-H, Lazarus JV, Lemoine M, Lok AS, et al. . Progress towards elimination goals for viral hepatitis. Nat Rev Gastroenterol Hepatol (2020) 17(9):533–42. doi: 10.1038/s41575-020-0332-6 - DOI - PMC - PubMed

Publication types