. 2022 Jul 22:13:945706.
doi: 10.3389/fimmu.2022.945706. eCollection 2022.

Comparative immunogenicity of an mRNA/LNP and a DNA vaccine targeting HIV gag conserved elements in macaques

Affiliations

Comparative immunogenicity of an mRNA/LNP and a DNA vaccine targeting HIV gag conserved elements in macaques

Antonio Valentin et al. Front Immunol. .

Abstract

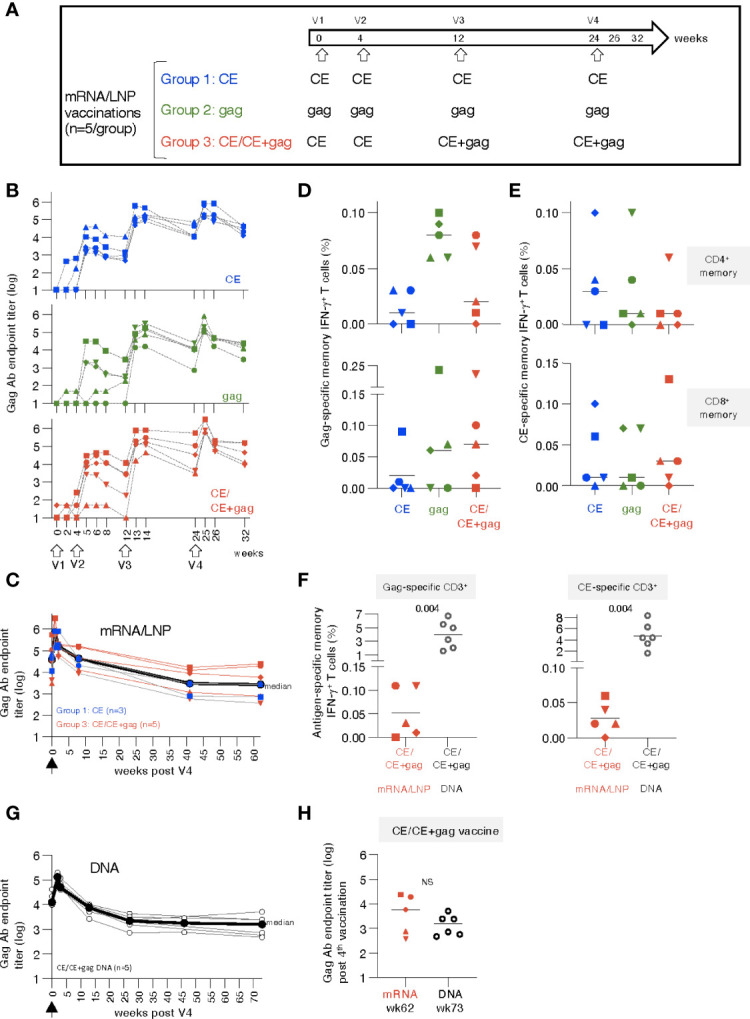
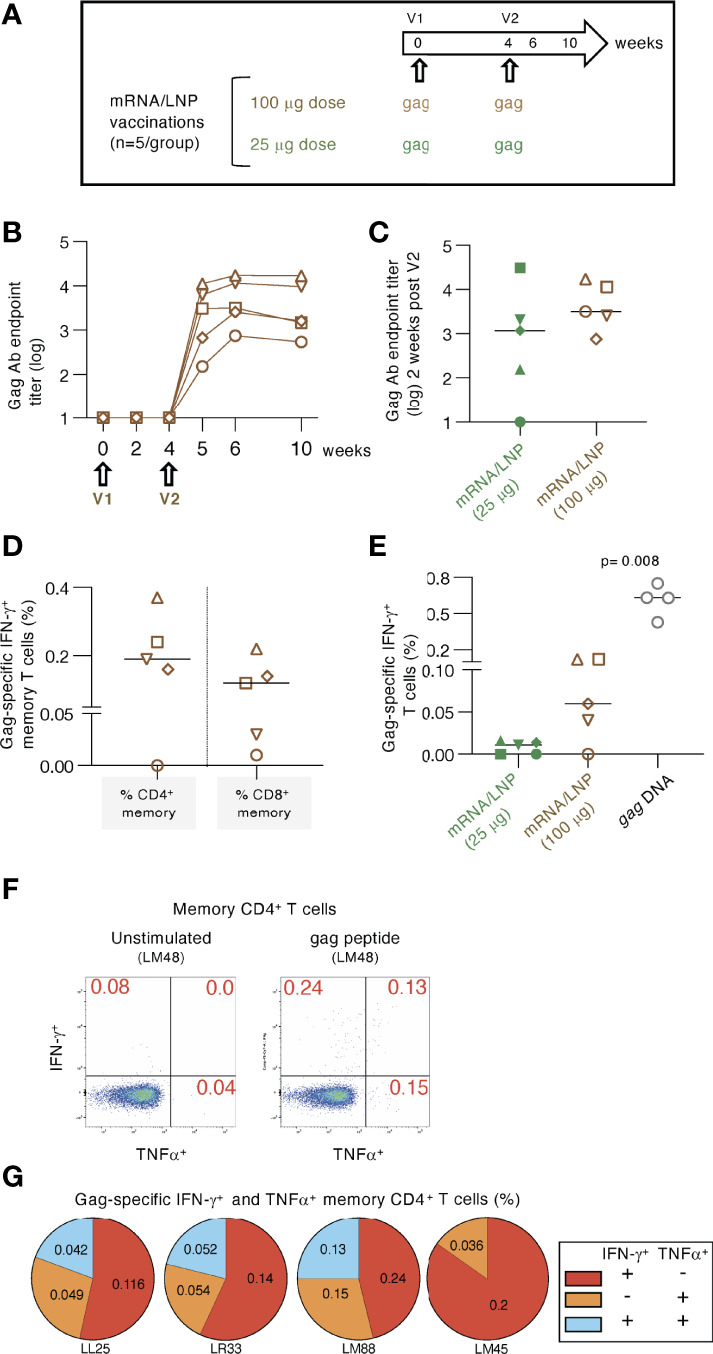
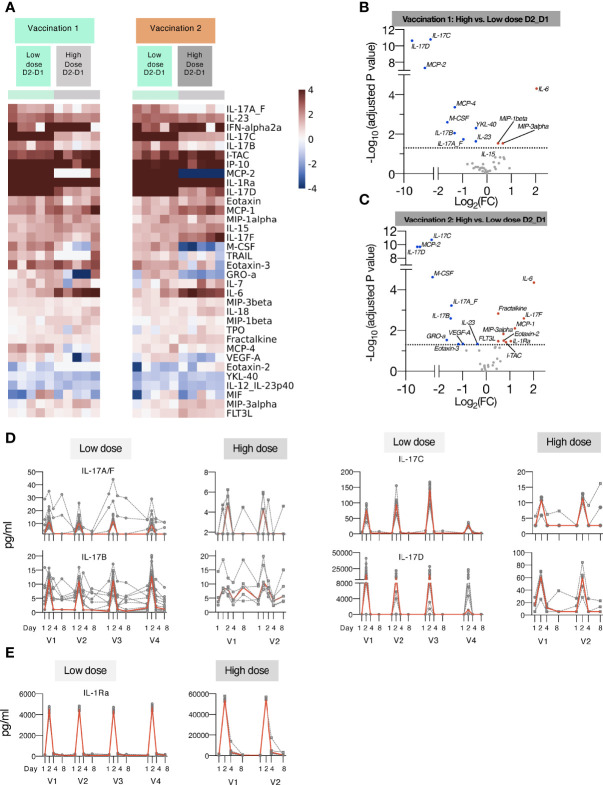
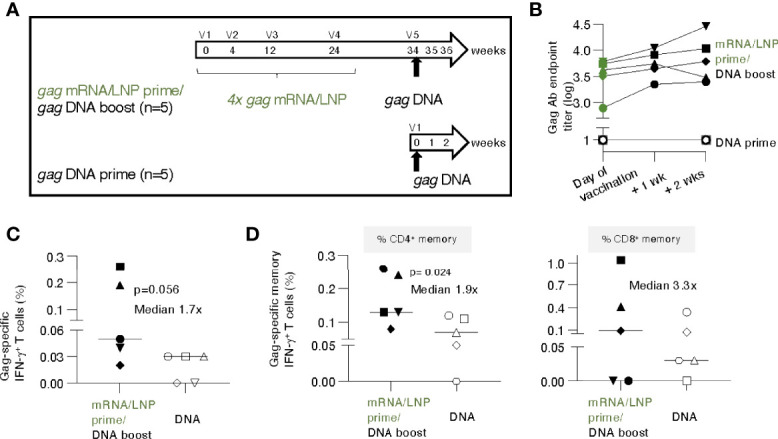
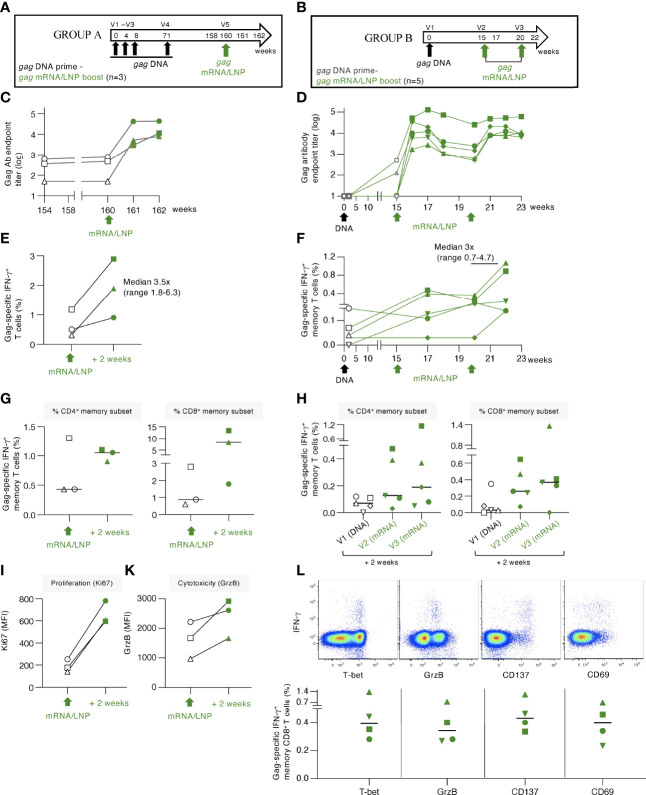
Immunogenicity of HIV-1 mRNA vaccine regimens was analyzed in a non-human primate animal model. Rhesus macaques immunized with mRNA in lipid nanoparticle (mRNA/LNP) formulation expressing HIV-1 Gag and Gag conserved regions (CE) as immunogens developed robust, durable antibody responses but low adaptive T-cell responses. Augmentation of the dose resulted in modest increases in vaccine-induced cellular immunity, with no difference in humoral responses. The gag mRNA/lipid nanoparticle (LNP) vaccine provided suboptimal priming of T cell responses for a heterologous DNA booster vaccination regimen. In contrast, a single immunization with gag mRNA/LNP efficiently boosted both humoral and cellular responses in macaques previously primed by a gag DNA-based vaccine. These anamnestic cellular responses were mediated by activated CD8+ T cells with a phenotype of differentiated T-bet+ cytotoxic memory T lymphocytes. The heterologous prime/boost regimens combining DNA and mRNA/LNP vaccine modalities maximized vaccine-induced cellular and humoral immune responses. Analysis of cytokine responses revealed a transient systemic signature characterized by the release of type I interferon, IL-15 and IFN-related chemokines. The pro-inflammatory status induced by the mRNA/LNP vaccine was also characterized by IL-23 and IL-6, concomitant with the release of IL-17 family of cytokines. Overall, the strong boost of cellular and humoral immunity induced by the mRNA/LNP vaccine suggests that it could be useful as a prophylactic vaccine in heterologous prime/boost modality and in immune therapeutic interventions against HIV infection or other chronic human diseases.

Keywords: HIV; T cell response; antibody; conserved sequences; gag; immune focusing; mRNA/LNP; therapeutic immunization.


Conflict of interest statement

Authors JM, GP, BP and BF report issued patents of relevance to this work. Author MAn was employed by Leidos Biomedical Research, Inc. Authors JG, BP, LO, EL are employed by CureVac AG. The remaining authors declare that the research was conducted in the absence of any commercial or financial relationships that could be construed as a potential conflict of interest.

Figures

Figure 1
Figure 1
mRNA/LNP vaccination of naïve rhesus macaques induces robust antibody and low T cell responses. (A) Schematic representation of the HIV-1 mRNA/LNP vaccination regimens of the three groups receiving four vaccinations (V1 to V4) with the indicated gag immunogens. (B) Plots showing the vaccine-induced Gag Ab measured over time as reciprocal endpoint titers (log). (C) Durability of CE and CE+gag mRNA/LNP vaccine induced Gag antibodies. Gag Ab titers were plotted from eight vaccinated macaques [group 1, n=3 (CE mRNA/LNP), blue symbols; group 3, n=5, red symbols; (CE/CE+Gag mRNA)] described in panel B over 62 weeks post the last vaccination (V4). Black symbols denote median antibody titers. (D, E) Antigen-specific T cell responses by flow cytometry measured two weeks after the 4th vaccination. (D) Gag-specific and (E) CE-specific memory (CD3+CD95+IFN-γ+) T cell responses were measured 2 weeks after the 4th vaccination. (F) Comparison of memory T cell responses in macaques immunized with the mRNA/LNP regimen (group 3) and the homologous DNA vaccine regimen from historical samples (30) at two weeks post vaccination 4. The data were obtained in the same flow cytometer (BD Fortessa) using the same antibody panel and the same gating strategy in these two groups of samples and included an internal positive control. This approach excluded any variability associated with instrument and/or reagent performance. P values are from unpaired t test (Mann-Whitney). (G) The CE/CE+gag DNA vaccine (dose: 2 mg prime, 2 + 2 mg boost) contained IL-12 DNA as vaccine adjuvant and was administered by IM injection followed by electroporation using the same schedule for the matching the mRNA/LNP. Plot showing Gag Ab responses after the 4th vaccination. The last time points of blood collection were weeks 70 and 76, respectively, for 3 animals each and these time points were combined plotted as week 73. (H) Comparison of Gag antibody titers (log) in macaques receiving CE/CE+Gag vaccine as mRNA/LNP (wk 62) and DNA (wk 73) vaccine post the 4th vaccination, respectively.
Figure 2
Figure 2
High dose mRNA/LNP vaccination increased cellular but not humoral responses. (A) Schematic representation of the high-dose (100 μg) gag mRNA/LNP vaccination regimen administered in two vaccinations (V1, V2; brown symbols). The data were compared to the low dose (25 μg) regimen described in Figure 1 (group 2; green symbols). (B) Vaccine-induced Gag Ab titers were plotted over time as reciprocal endpoint titers (log) from macaques immunized with the high dose mRNA/LNP vaccine. (C) Comparison of Gag Ab titers from the high and low dose mRNA/LNP regimens at two weeks after the 2nd vaccination. (D, E) The antigen-specific cellular analysis was performed by flow cytometry at 2 weeks after the 2nd vaccination. (D) Plot showing the Gag-specific CD4+ and CD8+ memory (CD3+CD95+IFN-γ+) T cell responses measured in PBMC. (E) Plot comparing the Gag-specific T cell responses as % of total T cells in macaques immunized twice with low dose (25 μg; described in Figure 1 ) and high dose (100 μg) mRNA/LNP vaccines, respectively. Responses in macaques immunized twice with 1 mg gag DNA (grey symbols) are included. The DNA vaccine contained IL-12 DNA as vaccine adjuvant and was administered by IM injection followed by electroporation. The p value is from t test (Mann-Whitney). (F-G) Analysis of gag mRNA/LNP vaccine induced memory CD4 immune responses. (F) Gating strategy for unstimulated and Gag peptide stimulated memory T cells producing IFN-γ and TNFα. (G) Pie charts showing responses of the 4 animals in the high dose vaccine group.
Figure 3
Figure 3
Changes in plasma cytokines after vaccination with mRNA/LNPs. Plasma cytokine and chemokine levels were measured using the MSD assay on the day of (D1) and days 2, 4 and 8 (D2, D4, and D8) after each vaccination in macaques receiving mRNA/LNPs vaccine. (A, B) Circulating plasma levels of selected analytes for individual animals (grey lines) and median (red lines) are shown upon the mRNA/LNP vaccinations, administered with low (25 μg, left panels) or high (100 μg, right panels) dose. (A) Molecules involved in IFN pathway, IFNα-2a, IL-15, IP-10/CXCL10, and ITAC/CXCL11. (B) Molecules involved in the IL-17 pathway, IL-23, IL-6, and IL-17F. (C) Decay in the circulating plasma levels of IL-12/23p40 between D1 and D2 for the individual animals upon each mRNA/LNP vaccination after receiving low dose (left panel) or high dose (right panel) mRNA/LNP vaccine. (D) Heatmap depicts log2 fold changes (log2 FC) in 35 analytes overtime upon each vaccination (light green: D2_D1; yellow: D4_D1; tan: D8_D1). Cytokine levels at D1 before each vaccination are used as baseline. Comparisons were performed between day1 and day 2 (D2), day 4 (D4) and day 8 (D8), respectively, with data for each animal shown under colored with vaccination 1 to 4 are indicated by the green, orange, blue, and purple bars, respectively. (E, F) Volcano plots of data shown in panel D depict differentially expressed analytes upon the vaccination 1 (E) and vaccination 4 (F) at day 2 versus day 1. Red dots indicate significant upregulation; blue dots indicate significant downregulation (adjusted p value<0.05 represented by the broken horizontal line).
Figure 4
Figure 4
Comparison of cytokine and chemokine levels measured in macaques upon low and high dose mRNA/LNP vaccinations. Plasma cytokine and chemokine levels were measured using the MSD assay in macaques after the 1st and 2nd mRNA vaccine doses, administered at low (green) or high (grey) mRNA/LNP doses. (A) Heatmap depicts log2 fold changes in 34 analytes detected at 24 hours (D2_D1) after Vaccination 1 (green) and Vaccination 2 (orange). Cytokine levels at D1 before each vaccination are used as baseline. (B, C) Volcano plots of data shown in panel A depict differentially induced changes upon Vaccination 1 (B) and Vaccination 2 (C) between low and high mRNA vaccine doses. Red dots indicate analytes significantly more upregulated in animals receiving the high dose vaccine; blue dots indicate analytes significantly more upregulated in animals receiving the low dose vaccine (adjusted p value<0.05 represented by the broken horizontal line). (D, E) Overtime changes in inflammatory modulators upon mRNA/LNPs vaccination. Circulating plasma levels of (D) IL-17 family of cytokines (IL-17A/F, IL-17B, IL-17C, IL-17D) and (E) IL-1Ra for individual animals (grey lines) and median (red lines) are shown upon mRNA vaccination, administered at low (left panels) and high (right panels) mRNA/LNP doses.
Figure 5
Figure 5
gag DNA booster vaccination of macaques primed with mRNA/LNP vaccinations increased T cell responses. (A) Schematic representation of the mRNA/LNP prime - DNA boost vaccination regimen. Five animals previously immunized four times (V1-V4) with gag mRNA/LNP (group 2, 25 μg dose, described in Figure 1 ) received a single gag DNA vaccination (V5; 2 mg dose) at 10 weeks after the last mRNA/LNP vaccination (V4). A group of naïve macaques (n=5) received a single gag DNA vaccination and was added for comparison. The gag DNA vaccine was administered by IM injection followed by electroporation. (B) Gag Ab titers after the single DNA vaccination were plotted over time. (C, D) Gag-specific cellular analysis was performed by flow cytometry two weeks after the DNA vaccination. (C) Total Gag-specific (CD3+IFN-γ+) T cell responses as % of total T cells and (D) Gag-specific memory (CD3+CD95+IFN-γ+) T cell responses are shown. The percent of Gag-specific IFN-γ+ CD4+ (left panel) and CD8+ (right panel) memory T cells in blood were plotted. The p values are from t test (Mann-Whitney).
Figure 6
Figure 6
gag mRNA/LNP booster vaccination of macaques with pre-existing Gag T cell immunity increased T cell responses. (A, B) Schematic representations of the DNA prime - mRNA/LNP booster vaccination regimens. (A) The macaques (n=3) in group A previously received 4 HIV gag DNA vaccinations (week 0, 4, 8 and 71). After a rest period of 89 weeks, they received a single gag mRNA/LNP (25 μg) booster vaccination (V5). (B) Animals in group B received a single gag DNA prime (V1; 2 mg dose), followed 15 weeks later by two gag mRNA/LNP booster vaccinations (V2, V3; 25 μg dose) spaced 5 weeks apart. (C, D) Gag-specific Ab endpoint titers (log) were measured by ELISA during the course of the studies. (C) Gag Ab were measured starting 6 weeks before study start (week 154), at the day of vaccination (week 160), and 2 and 4 weeks upon the mRNA/LNP boost. (D) Gag Ab responses were measured after the gag DNA vaccination, at the start and post the mRNA/LNP vaccinations. (E, F) Gag-specific T cell responses measured by flow cytometry at the indicated timepoints for (E) group A and (F) group (B) Grey symbols denote responses after the DNA vaccination, green symbols denote responses after mRNA/LNP vaccination. (G, H) Gag-specific responses in total (CD3+IFN-γ+) and memory (CD3+CD95+IFN-γ+) T cell subsets are shown. Changes in (I) proliferation, measured by Ki67 staining, and (K) cytotoxicity, measured by granzyme B content, are shown for animals from group A. (L) Dot plots (upper panels) from a representative animal (LI19) from group B showing T-bet, granzyme B content and expression of the co-stimulatory immune checkpoint molecule CD137 and the CD69 activation marker among the Gag-specific IFN-γ+ memory CD8+ T cells after the last vaccination. The graph (lower panel) shows the peak responses after the last vaccination with data from 4 of 5 animals with positive Gag-specific memory (CD8+CD95+IFN-γ+) T cell responses.

Similar articles

Cited by

References

    1. Churchill MJ, Deeks SG, Margolis DM, Siliciano RF, Swanstrom R. HIV Reservoirs: what, where and how to target them. Nat Rev Microbiol (2016) 14(1):55–60. doi: 10.1038/nrmicro.2015.5 - DOI - PubMed
    1. Martinez-Picado J, Deeks SG. Persistent HIV-1 replication during antiretroviral therapy. Curr Opin HIV AIDS (2016) 11(4):417–23. doi: 10.1097/COH.0000000000000287 - DOI - PMC - PubMed
    1. Cohn LB, Chomont N, Deeks SG. The biology of the hiv-1 latent reservoir and implications for cure strategies. Cell Host Microbe (2020) 27(4):519–30. doi: 10.1016/j.chom.2020.03.014 - DOI - PMC - PubMed
    1. Fromentin R, Chomont N. HIV Persistence in subsets of CD4+ T cells: 50 shades of reservoirs. Semin Immunol (2021) 51:101438. doi: 10.1016/j.smim.2020.101438 - DOI - PMC - PubMed
    1. Chen Z, Julg B. Therapeutic vaccines for the treatment of HIV. Transl Res (2020) 223:61–75. doi: 10.1016/j.trsl.2020.04.008 - DOI - PMC - PubMed

Publication types