

A Novel Immune-Related Gene Signature to Identify the Tumor Microenvironment and Prognose Disease Among Patients With Oral Squamous Cell Carcinoma Patients Using ssGSEA: A Bioinformatics and Biological Validation Study
- PMID: 35935989
- PMCID: PMC9351622
- DOI: 10.3389/fimmu.2022.922195
A Novel Immune-Related Gene Signature to Identify the Tumor Microenvironment and Prognose Disease Among Patients With Oral Squamous Cell Carcinoma Patients Using ssGSEA: A Bioinformatics and Biological Validation Study
Abstract
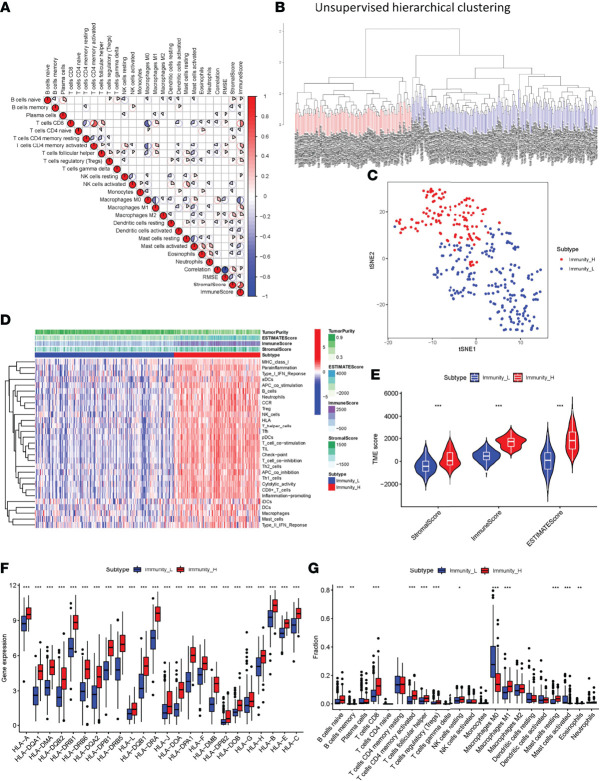
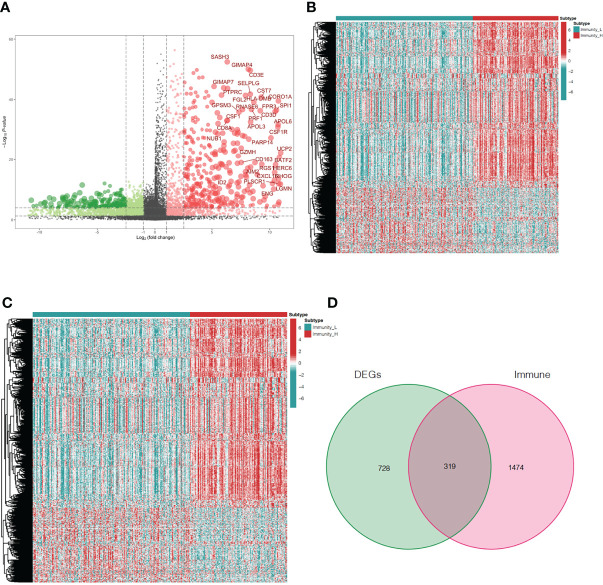
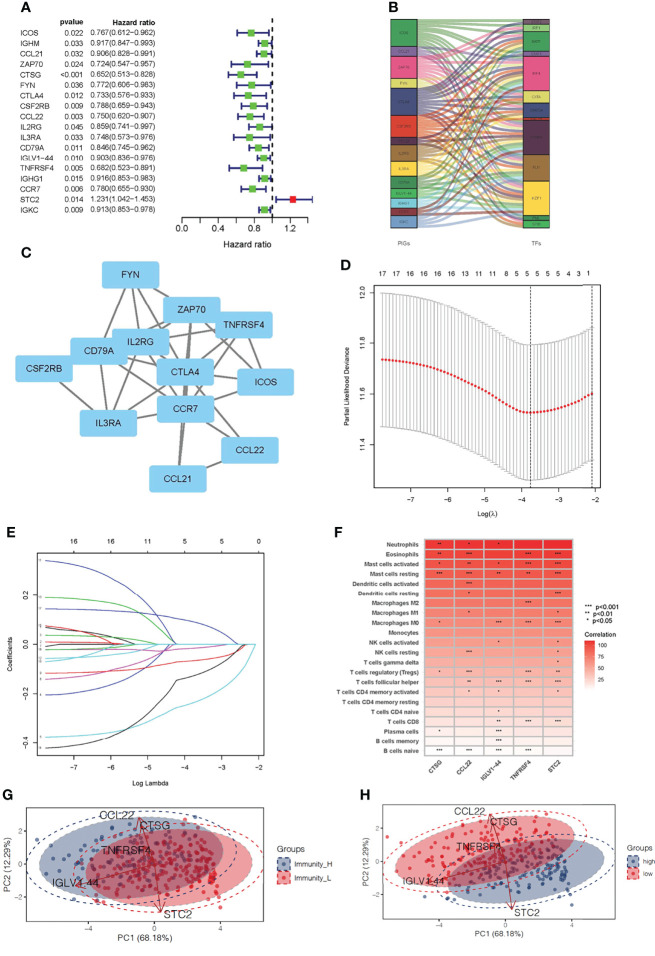
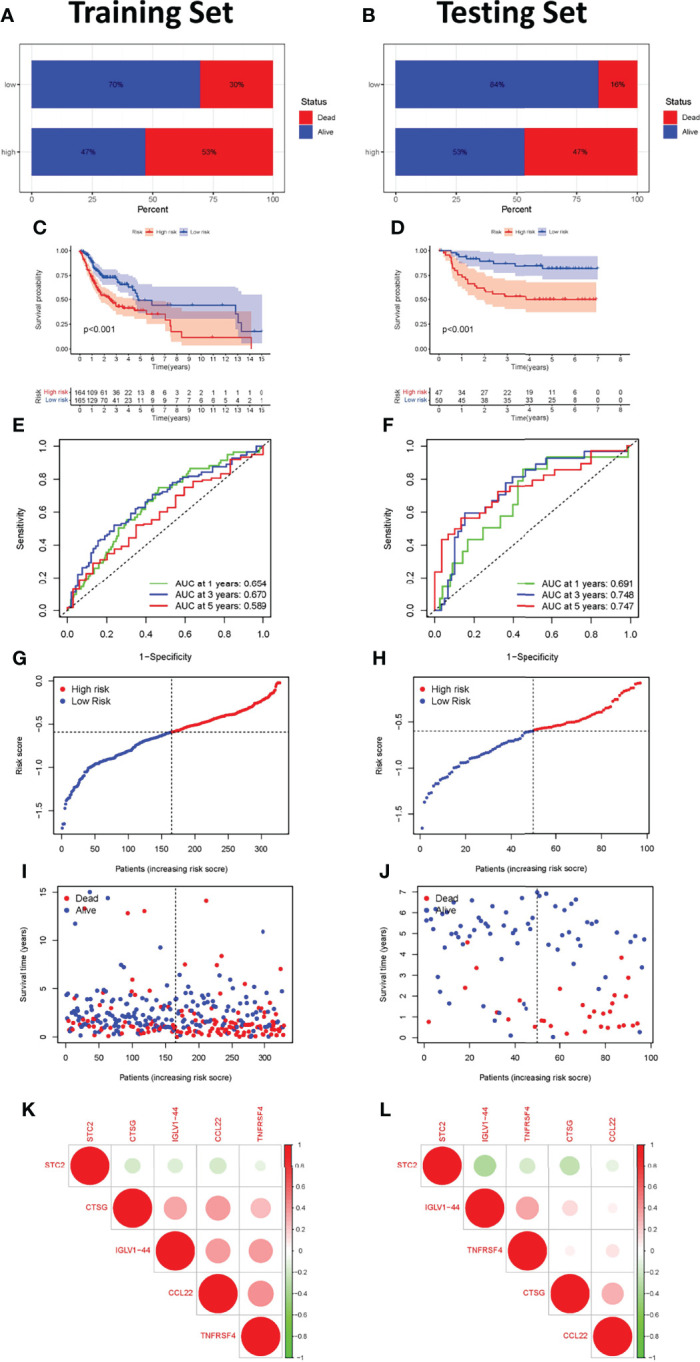
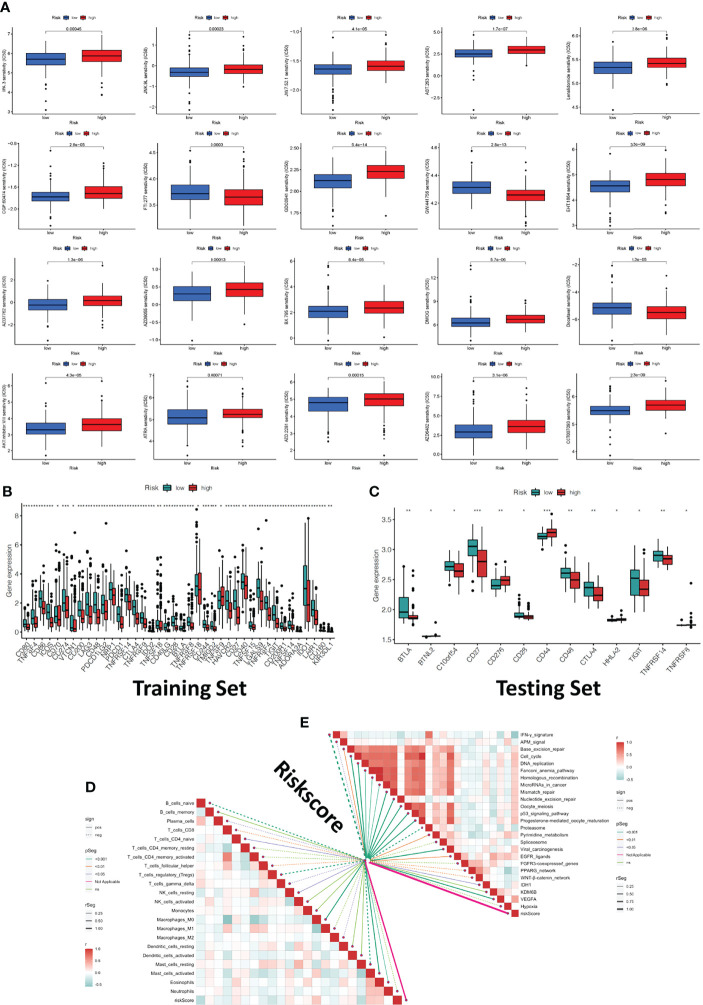
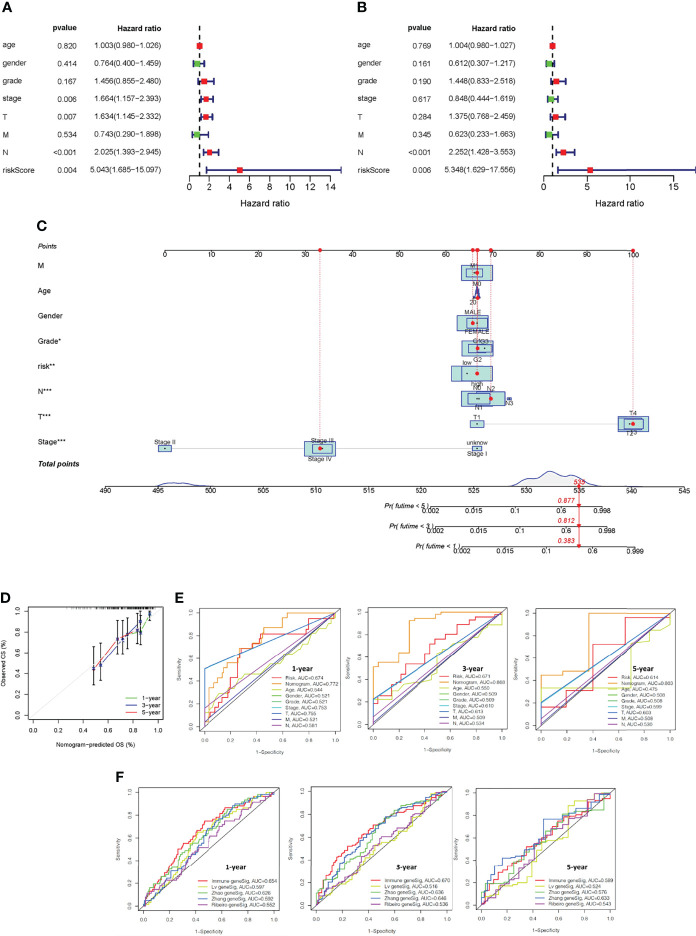
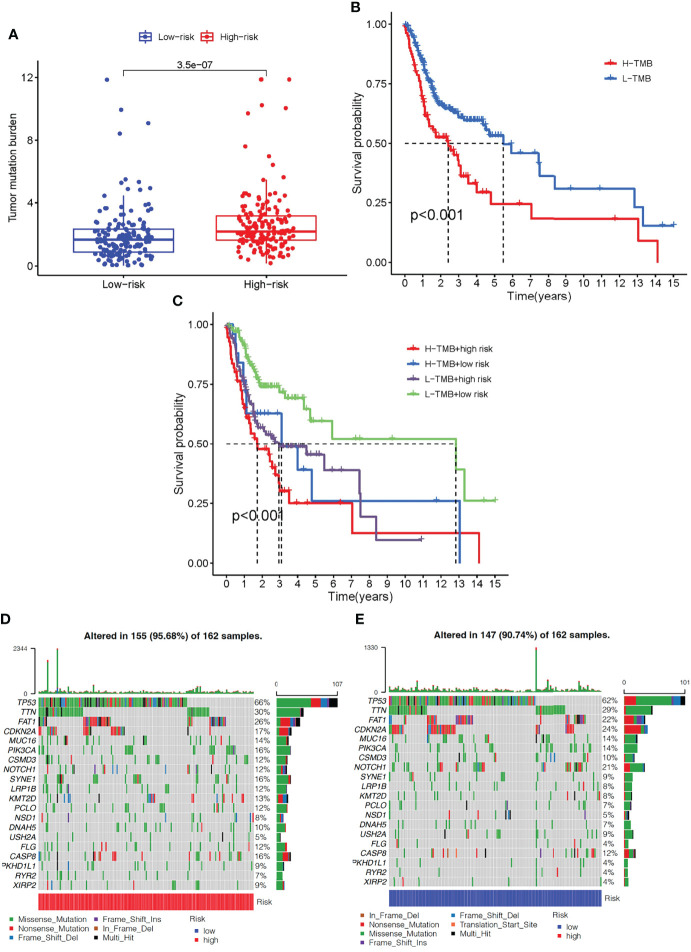
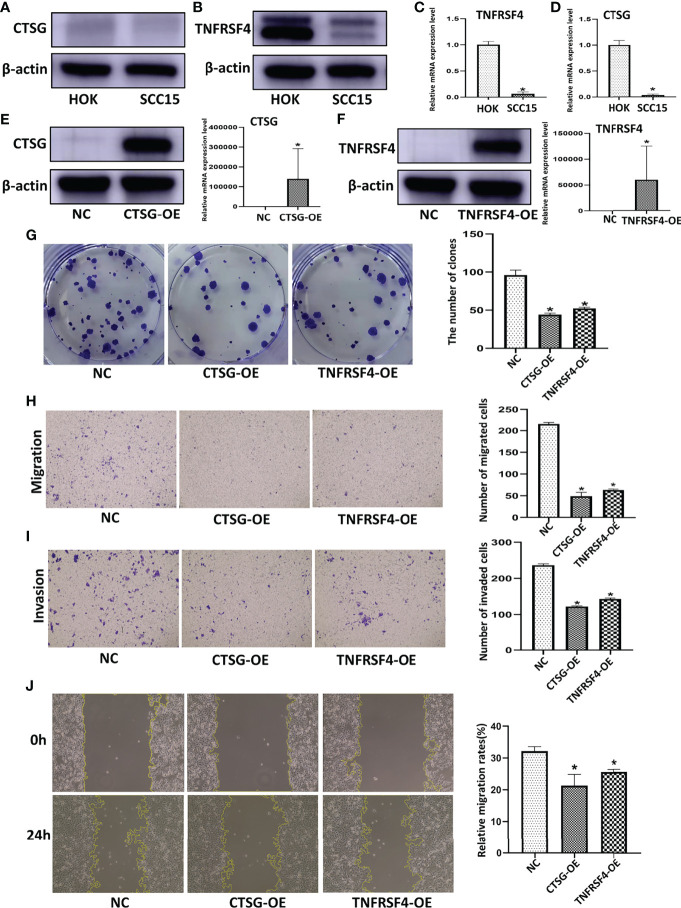
Oral squamous cell carcinoma (OSCC) is the most invasive oral malignancy in adults and is associated with a poor prognosis. Accurate prognostic models are urgently needed, however, knowledge of the probable mechanisms behind OSCC tumorigenesis and prognosis remain limited. The clinical importance of the interplay between the immune system and tumor microenvironment has become increasingly evident. This study explored immune-related alterations at the multi-omics level to extract accurate prognostic markers linked to the immune response and presents a more accurate landscape of the immune genomic map during OSCC. The Cancer Genome Atlas (TCGA) OSCC cohort (n = 329) was used to detect the immune infiltration pattern of OSCC and categorize patients into two immunity groups using single-sample gene set enrichment analysis (ssGSEA) and hierarchical clustering analysis. Multiple strategies, including lasso regression (LASSO), Cox proportional hazards regression, and principal component analysis (PCA) were used to screen clinically significant signatures and identify an incorporated prognosis model with robust discriminative power on the survival status of both the training and testing set. We identified two OSCC subtypes based on immunological characteristics: Immunity-high and immunity low, and verified that the categorization was accurate and repeatable. Immunity_ high cluster with a higher immunological and stromal score. 1047 differential genes (DEGs) integrate with immune genes to obtain 319 immue-related DEGs. A robust model with five signatures for OSCC patient prognosis was established. The GEO cohort (n = 97) were used to validate the risk model's predictive value. The low-risk group had a better overall survival (OS) than the high-risk group. Significant prognostic potential for OSCC patients was found using ROC analysis and immune checkpoint gene expression was lower in the low-risk group. We also investigated at the therapeutic sensitivity of a number of frequently used chemotherapeutic drugs in patients with various risk factors. The underlying biological behavior of the OSCC cell line was preliminarily validated. This study characterizes a reliable marker of OSCC disease progression and provides a new potential target for immunotherapy against this disease.
Keywords: immune infiltration; immune-related gene; oral squamous cell carcinoma; prognostic biomarker; single-sample gene set enrichment analysis.
Copyright © 2022 Chen, Feng, Yan, Zhao, Zhao and Guo.
Conflict of interest statement
The authors declare that the research was conducted in the absence of any commercial or financial relationships that could be construed as a potential conflict of interest.
Figures
Similar articles
-
Identification of a novel necroptosis-related LncRNA signature for prognostic prediction and immune response in oral squamous cell carcinoma.Cancer Biomark. 2024;40(3-4):319-342. doi: 10.3233/CBM-230407. Cancer Biomark. 2024. PMID: 39213052 Free PMC article.
-
Identification of an Immune Score-Based Gene Panel with Prognostic Power for Oral Squamous Cell Carcinoma.Med Sci Monit. 2020 Jun 12;26:e922854. doi: 10.12659/MSM.922854. Med Sci Monit. 2020. PMID: 32529991 Free PMC article.
-
Ferroptosis-related gene signature predicts the prognosis in Oral squamous cell carcinoma patients.BMC Cancer. 2021 Jul 20;21(1):835. doi: 10.1186/s12885-021-08478-0. BMC Cancer. 2021. PMID: 34284753 Free PMC article.
-
Tumor-infiltrating ICOS+ Effector Regulatory T-Cells in Oral Squamous Cell Carcinoma as a Promising Biomarker for Prognosis and 'Hot' Tumor.Anticancer Res. 2022 May;42(5):2383-2393. doi: 10.21873/anticanres.15717. Anticancer Res. 2022. PMID: 35489733 Review.
-
[Role of innate lymphoid cells in oral squamous cell carcinoma microenvironment].Zhonghua Kou Qiang Yi Xue Za Zhi. 2024 Apr 9;59(4):394-399. doi: 10.3760/cma.j.cn112144-20240129-00041. Zhonghua Kou Qiang Yi Xue Za Zhi. 2024. PMID: 38548598 Review. Chinese.
Cited by
-
Decoding the immune microenvironment: unveiling CD8 + T cell-related biomarkers and developing a prognostic signature for personalized glioma treatment.Cancer Cell Int. 2024 Oct 1;24(1):331. doi: 10.1186/s12935-024-03517-9. Cancer Cell Int. 2024. PMID: 39354483 Free PMC article.
-
Impact of Mitophagy-Related Genes on the Diagnosis and Development of Esophageal Squamous Cell Carcinoma via Single-Cell RNA-seq Analysis and Machine Learning Algorithms.J Microbiol Biotechnol. 2024 Nov 28;34(11):2362-2375. doi: 10.4014/jmb.2407.07052. Epub 2024 Sep 23. J Microbiol Biotechnol. 2024. PMID: 39344350 Free PMC article.
-
Spermine Synthase : A Potential Prognostic Marker for Lower-Grade Gliomas.J Korean Neurosurg Soc. 2025 Jan;68(1):75-96. doi: 10.3340/jkns.2024.0080. Epub 2024 Nov 5. J Korean Neurosurg Soc. 2025. PMID: 39492653 Free PMC article.
-
Assessment of prognosis and responsiveness to immunotherapy in colorectal cancer patients based on the level of immune cell infiltration.Front Immunol. 2025 Feb 3;16:1514238. doi: 10.3389/fimmu.2025.1514238. eCollection 2025. Front Immunol. 2025. PMID: 39963131 Free PMC article.
-
Prognostic characteristics of a six-gene signature based on ssGSEA in sarcoma.Aging (Albany NY). 2024 Jan 17;16(2):1536-1554. doi: 10.18632/aging.205443. Epub 2024 Jan 17. Aging (Albany NY). 2024. PMID: 38240704 Free PMC article.
References
Publication types
MeSH terms
LinkOut - more resources
Full Text Sources
Medical