. 2022 Jul 22:13:939907.
doi: 10.3389/fimmu.2022.939907. eCollection 2022.

IFN-I inducible miR-3614-5p targets ADAR1 isoforms and fine tunes innate immune activation

Affiliations

IFN-I inducible miR-3614-5p targets ADAR1 isoforms and fine tunes innate immune activation

Françoise Vuillier et al. Front Immunol. .

Abstract

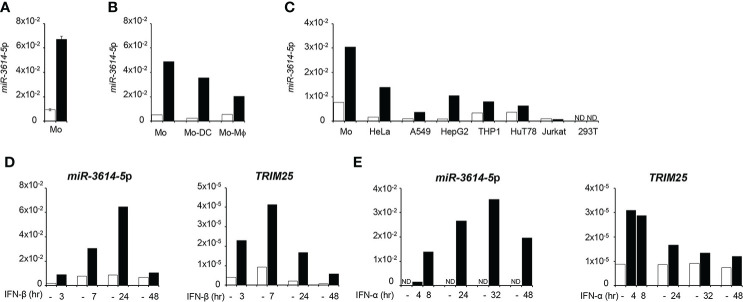
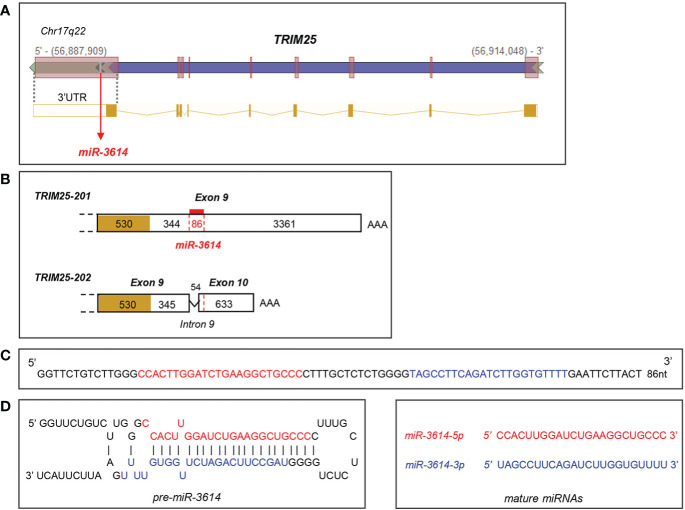
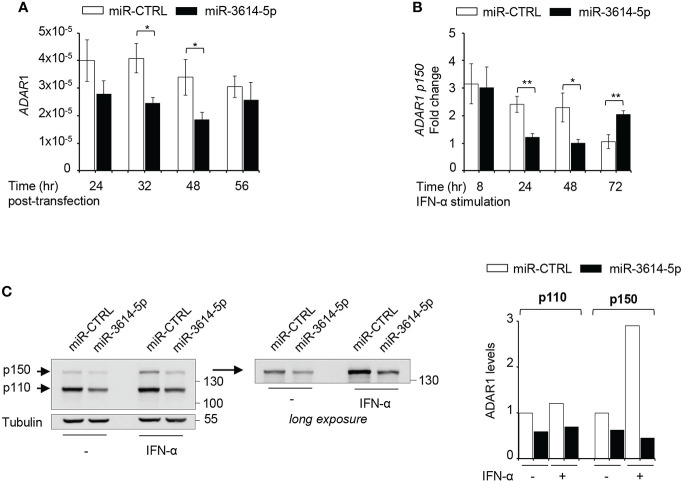
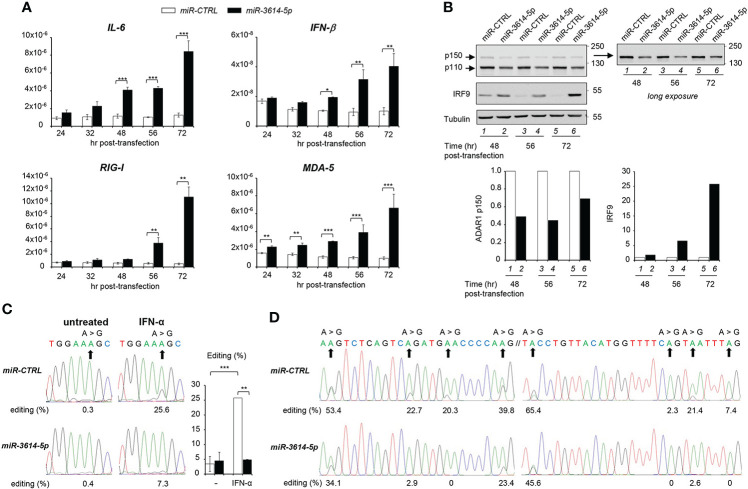
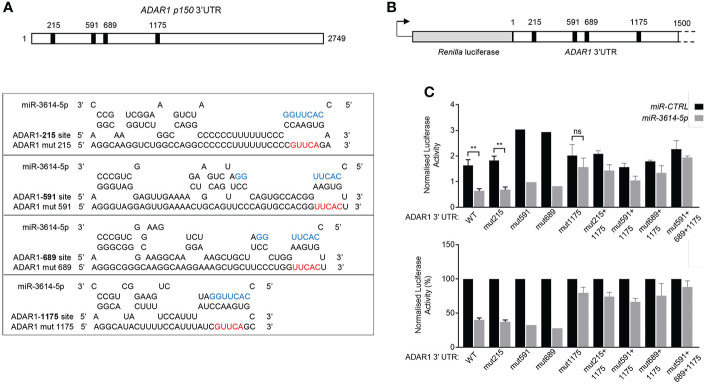
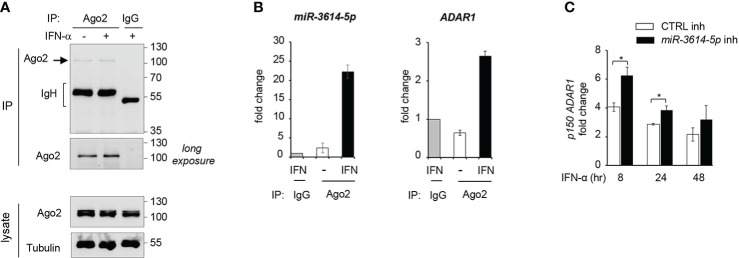
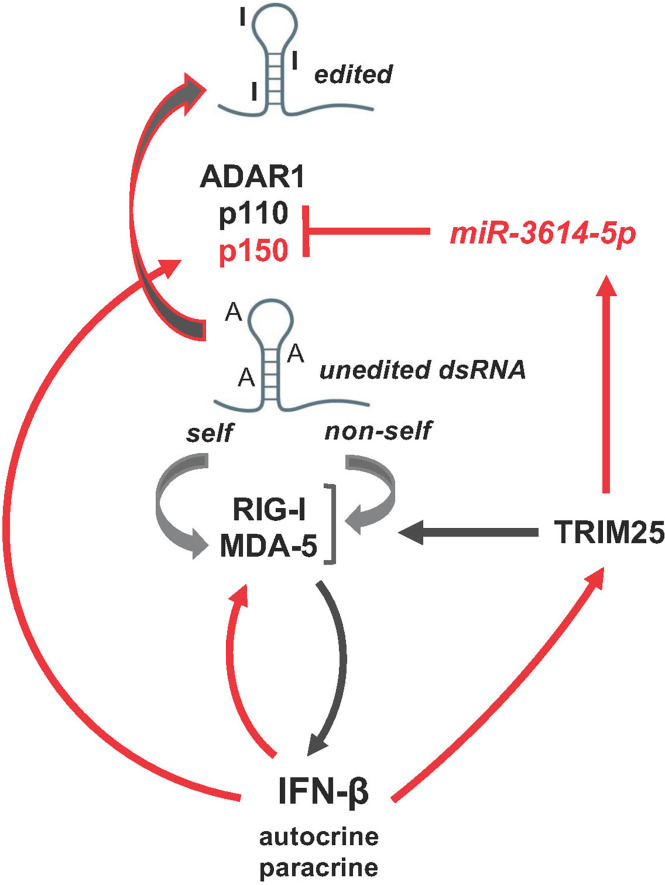
Regulation of innate immune responses is essential for maintenance of immune homeostasis and development of an appropriate immunity against microbial infection. We show here that miR-3614-5p, product of the TRIM25 host gene, is induced by type I interferon (IFN-I) in several human non-immune and immune cell types, in particular in primary myeloid cells. Studies in HeLa cells showed that miR-3614-5p represses both p110 and p150 ADAR1 and reduces constitutive and IFN-induced A-to-I RNA editing. In line with this, activation of innate sensors and expression of IFN-β and the pro-inflammatory IL-6 are promoted. MiR-3614-5p directly targets ADAR1 transcripts by binding to one specific site in the 3'UTR. Moreover, we could show that endogenous miR-3614-5p is associated with Ago2 and targets ADAR1 in IFN-stimulated cells. Overall, we propose that, by reducing ADAR1, IFN-I-induced miR-3614-5p contributes to lowering the activation threshold of innate sensors. Our findings provide new insights into the role of miR-3614-5p, placing it as a potential fine tuner of dsRNA metabolism, cell homeostasis and innate immunity.

Keywords: ADAR1; TRIM25; innate response; microRNA; type I interferon.


Conflict of interest statement

The authors declare that the research was conducted in the absence of any commercial or financial relationships.

Figures

Figure 1
Figure 1
MiR-3614-5p is induced by type I IFN. (A) MiR-3614-5p expression in monocytes purified from two healthy donors and treated with 100pM IFN-β for 24 hr (black) or not treated (white). Results are shown as expression (2-ΔCt) relative to U6 used as housekeeping gene. Values are means ± SEM. (B) Mir-3614-5p expression in monocytes from one donor and in derived macrophages (Mo-Mϕ) and dendritic cells (Mo-DC). IFN-β stimulation and results as in A). (C) Mir-3614-5p expression in different human cell lines and in primary monocytes from a single donor (Mo). Stimulation with IFN-α (100pM) for 8 hr. Data are representative of two independent experiments. ND, not detected. (D) MiR-3614-5p (left panel) and TRIM25 (right panel) levels measured in primary monocytes stimulated with IFN-β (100pM) as indicated. Results for TRIM25 are shown as expression (2-ΔCt) relative to 18S. Data are representative of two independent experiments. (E) MiR-3614-5p (left panel) and TRIM25 (right panel) levels measured in HeLa cells stimulated with IFN-α (100pM) for the indicated times. Results expressed as in D). Data are representative of four independent experiments.
Figure 2
Figure 2
Localisation and sequence of miR-3614. (A) Genomic position of miR-3614 sequence in the human TRIM25 gene (from Intragenic microRNA database, miRIAD). (B) Localisation of miR-3614 in the 3’UTR of TRIM25. Only the last exon(s) of the two protein-coding transcripts, TRIM25-201 and TRIM25-202, is shown. The coding region is yellow-coloured and the 3’UTR is white-coloured. In red the 86 nt miR-3614 sequence that overlaps an intronic splice site. (C) The 86 nt miR-3614 sequence. (D) Secondary structure prediction of the miRNA precursor. MiR-3614-5p and -3p in red and blue, respectively.
Figure 3
Figure 3
A miR-3614-5p mimic targets both ADAR1 isoforms. (A) A miR-3614-5p or a miR-control (miR-CTRL) mimic was retrotransfected in HeLa cells. At the indicated times post-transfection the level of total ADAR1 mRNA was measured by qPCR. Results are shown as expression (2-ΔCt) relative to 18S used as housekeeping gene. Values are means ± SEM (n=3 separate experiments). *p<0.05. (B) HeLa were retrotransfected as in A) with miR-3614-5p or a miR-control (miR-CTRL) and 48 hr later, IFN-α (100pM) was added. Relative expression of p150 ADAR1 was measured at the indicated times after stimulation. The fold change represents the ratio of IFN-stimulated cells relative to unstimulated cells. Values are means ± SEM (n=3), *p<0.05, **p<0.01. (C) HeLa cells were retrotransfected as in A). Twenty-four hr later cells were stimulated with IFN-α (100pM) for 2 days and then processed for western blot analysis. Tubulin was used as loading control. Right panel, the membrane was covered below the 130 kDa marker and exposed for longer time to better visualize the p150 ADAR1 isoform. Protein bands were quantified and normalized to tubulin. For each isoform results are expressed as ratio of miR-3614-5p-transfected cells relative to miR-CTRL-transfected cells. The value in untreated miR-CTRL-transfected cells set to 1. The data are representative of three independent experiments.
Figure 4
Figure 4
MiR-3614-5p impacts innate cytokine expression and RNA editing. (A) HeLa cells were retrotransfected with the mir-3614-5p or the miR-control (miR-CTRL) as mimics. The relative expression of IL-6, IFN-β, RIG-I and MDA-5 was measured at different times after retrotransfection, as indicated. Values are means ± SEM (n=3 separate experiments); *p<0.05; **p<0.01; ***p<0.001. (B) Cells retrotransfected as in A) were lysed for western blot analysis at different times post-transfection. Lysates were immunoblotted as indicated. Tubulin was used as loading control. Right panel, the membrane was covered below the 130 kDa marker and exposed for longer time to better visualize the p150 ADAR1 isoform. Protein bands were quantified and normalized to tubulin. Results are expressed as ratios of miR-3614-5p-transfected cells (black) relative to miR-CTRL-transfected cells (white). Values in miR-CTRL-transfected cells were set to 1. These data are representative of two experiments. (C) HeLa cells were retrotransfected with the mir-3614-5p or the miR-control (miR-CTRL) as mimics. Two days later cells were left untreated or treated with IFN-α (100pM) for an additional 72 hr. RNA was extracted and editing was determined, as described in Materials and Methods. The percentage of editing was measured after sequencing the AZIN1 PCR products. Percentages of editing in AZIN1 transcripts are shown below the chromatograms of a representative experiment. Right histogram, three independent experiments were quantified. Values are means ± SEM; **p<0.01; ***p<0.001. (D) HeLa cells were retrotransfected with mir-3614-5p or miR-control (miR-CTRL) as mimics and left in culture for 56 hr. RNA was extracted and editing was determined, as described in Materials and Methods. The percentage of editing was measured after sequencing the EIF2AK2 PCR products. Two regions of an editing box located in 3’UTR of EIF2AK2 transcripts are represented. The two sequences have their genomic counterpart localized at chr2: 37,328,008-37,328,100 (24). Their percentages of editing are shown below the chromatograms. The data are representative of two independent experiments.
Figure 5
Figure 5
MiR-3614-5p targets ADAR1 3’UTR through one major binding site. (A) Schematic diagram of the 3’UTR of the p150 ADAR1 transcript. Black boxes indicate the location of the four predicted binding sites of miR-3614-5p. Site 215 matches to miR-3614-5p positions 2-8 of the seed sequence with an A opposite to position 1. Site 1175 matches to miR-3614-5p positions 2-10. Site 591 and site 689 are two non-canonical 5-mer binding sites. The RNAhybrid miRNA target prediction tool was used (https://bibiserv.cebitec.uni-bielefeld.de/rnahybrid). Mutant ADAR1 target sites (mut215, mut591, mut689, mut1175) were generated by mutating 5nt complementary to the 5’ seed region of miR-3614-5p. The seed sequence is in blue. The mutated nucleotides are in red. (B) Schematic diagram of the 1.5 kb ADAR1 3’UTR sequence containing the four predicted miR-3614-5p binding sites (black squares) cloned downstream of Renilla luciferase in the psiCHECK-2 vector. (C) Luciferase assay to assess direct interaction of miR-3614-5p with the ADAR1 3’UTR. HeLa cells were retrotransfected with the miR-3614-5p mimic or the non-targeting control mimic (50nM) and the next day transfected with the dual luciferase reporter psiCHECK-2 carrying the ADAR1 3’UTR, as in (B). Twenty four hr later Renilla luciferase activity was measured and normalized to the internal firefly luciferase control (top panel). WT and mut1175 data: mean of four experiments each in triplicate. Mut215 data: mean of 3 experiments each in triplicate. Mut591, mut689 data: one experiment in triplicate. Data on combined mutations: mean of two experiments each in triplicate. Statistics is available only for results with 3 independent experiments. Data represented as mean ± SEM. *p<0.05, **p<0.01, ns = not significant. Normalised luciferase activities (top panel) are represented as percentage of the control mimic (bottom panel). Data are represented as mean ± SEM.
Figure 6
Figure 6
Endogenous miR-3614-5p is associated with Ago-2 and targets ADAR1 in IFN-stimulated cells. (A) HeLa cells were stimulated with IFN-α (100pM) for 24 hr and processed for Argonaute2-miRNA-co-immunoprecipitation. Endogenous Argonaute2 (Ago2) was immunoprecipitated (IP) from whole cell lysates with anti-Ago2 or an IgG control. Samples were analysed by western blot as indicated. (B) miR-3614-5p (left panel) or ADAR1 mRNA (right panel) was measured by qPCR in the Ago2 immunoprecipitated fraction relative to the IgG fraction, shown in A). The Ct values of miR3614-5p or ADAR1 in the IgG immunoprecipitate were substracted from the Ct values in Ago2 immunoprecipitates (IFN-treated or untreated) to generate ΔCts. The results shown are expressed as fold change and represent the expression (2-ΔCt) relative to control IgG set at 1. Data are mean +/- SEM of two independent experiments. (C) HeLa cells were transfected with the miR-3614-5p inhibitor (miR-3614-5p inh) or the control inhibitor (CTRL inh). Two days later, IFN-α (100pM) was added. Relative expression of p150 ADAR1 was measured at different times after stimulation as indicated. The fold change represents the ratio of IFN-treated cells relative to non-treated cells. Values are means ± SEM (n=3 separate experiments). *p < 0.05.
Figure 7
Figure 7
Schematic representation of miR-3614-5p involvement in the network of activation of the dsRNA sensors RIG-I and MDA-5 mediating induction of IFN-I and inflammatory response. Of these intricate pathways only the few actors studied here are depicted. Red arrows, transcriptional gene induction by IFN-I, which acts in an autocrine and paracrine fashion.

Similar articles

Cited by

References

    1. Bartel DP. MicroRNAs: target recognition and regulatory functions. Cell (2009) 136(2):215–33. doi: 10.1016/j.cell.2009.01.002 - DOI - PMC - PubMed
    1. Mehta A, Baltimore D. MicroRNAs as regulatory elements in immune system logic. Nat Rev Immunol (2016) 16(5):279–94. doi: 10.1038/nri.2016.40 - DOI - PubMed
    1. Tomasello E, Pollet E, Vu Manh TP, Uze G, Dalod M. Harnessing mechanistic knowledge on beneficial versus deleterious IFN-I effects to design innovative immunotherapies targeting cytokine activity to specific cell types. Front Immunol (2014) 5:526. doi: 10.3389/fimmu.2014.00526 - DOI - PMC - PubMed
    1. Forster SC, Tate MD, Hertzog PJ. MicroRNA as type I interferon-regulated transcripts and modulators of the innate immune response. Front Immunol (2015) 6:334. doi: 10.3389/fimmu.2015.00334 - DOI - PMC - PubMed
    1. Witten D, Tibshirani R, Gu SG, Fire A, Lui WO. Ultra-high throughput sequencing-based small RNA discovery and discrete statistical biomarker analysis in a collection of cervical tumours and matched controls. BMC Biol (2010) 8:58. doi: 10.1186/1741-7007-8-58 - DOI - PMC - PubMed

Publication types

LinkOut - more resources