. 2022 Jul 22:13:916915.
doi: 10.3389/fimmu.2022.916915. eCollection 2022.

Characterization of the immune cell infiltration landscape in myxofibrosarcoma to aid immunotherapy

Affiliations

Characterization of the immune cell infiltration landscape in myxofibrosarcoma to aid immunotherapy

Zi-Yue Zhao et al. Front Immunol. .

Abstract

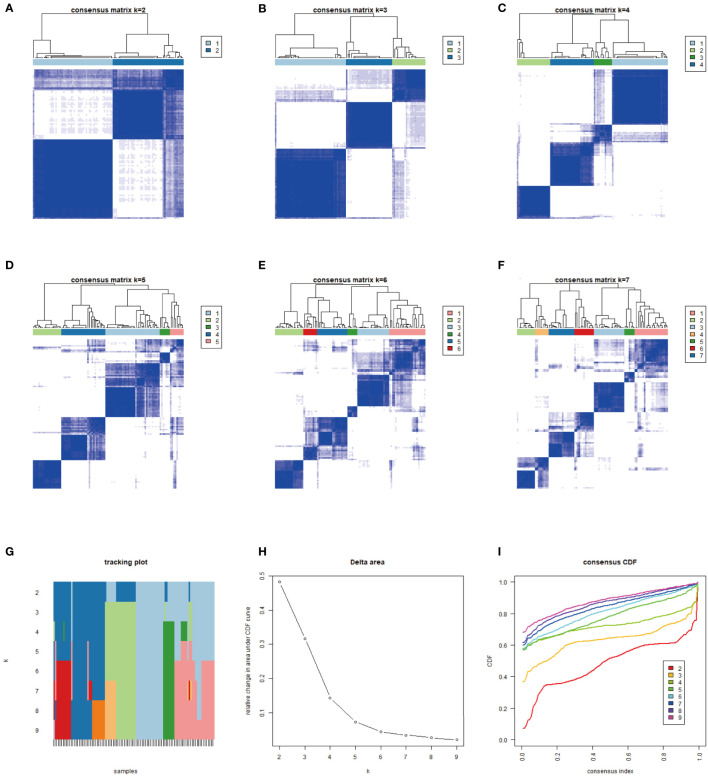
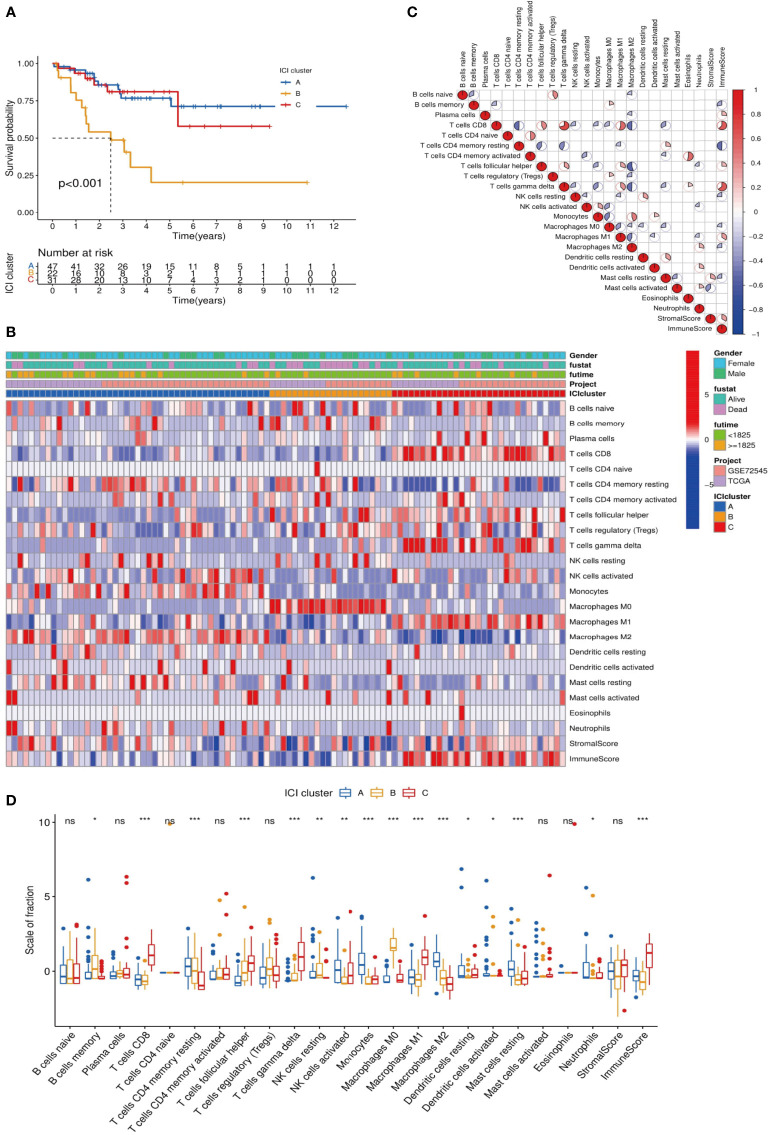
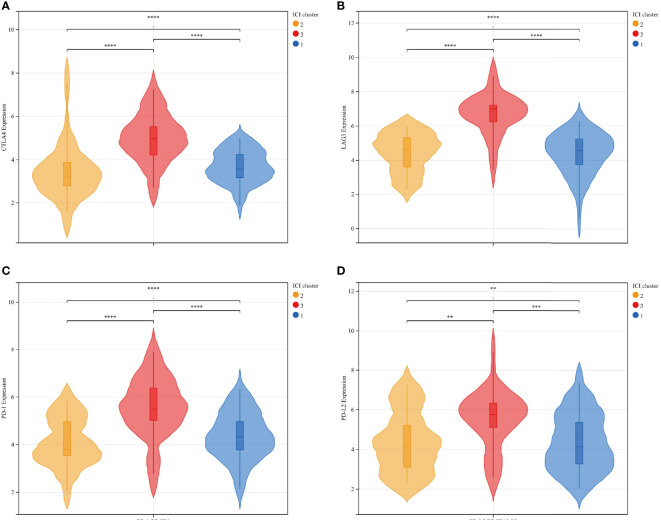
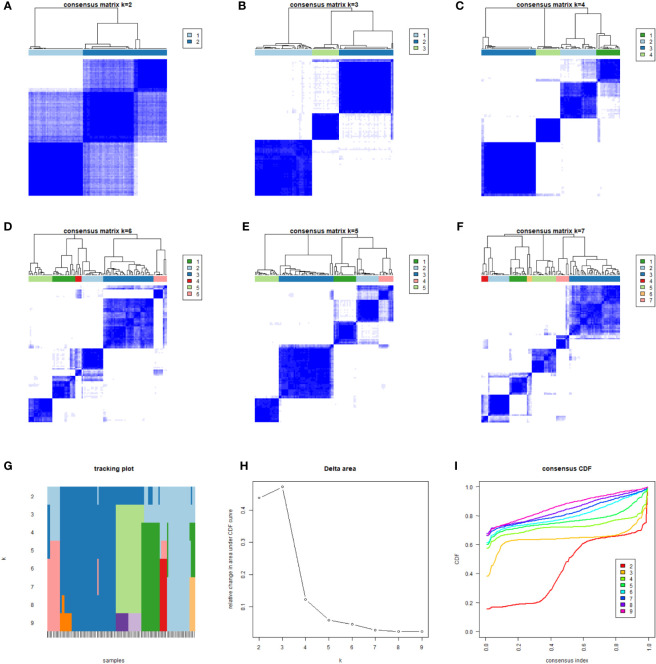
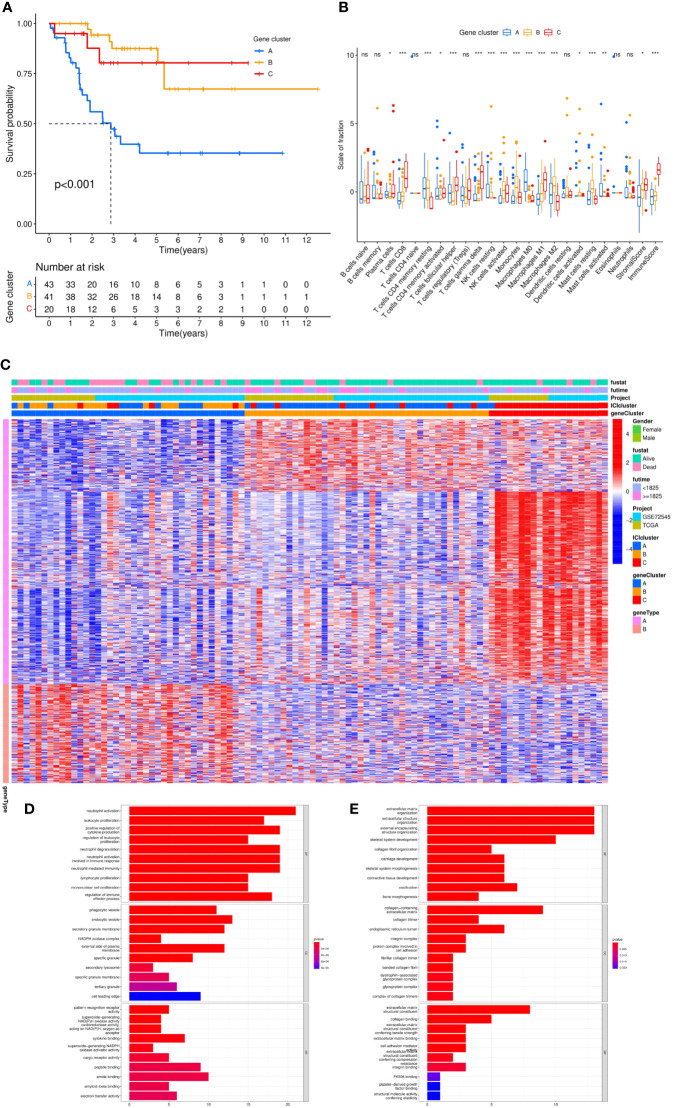
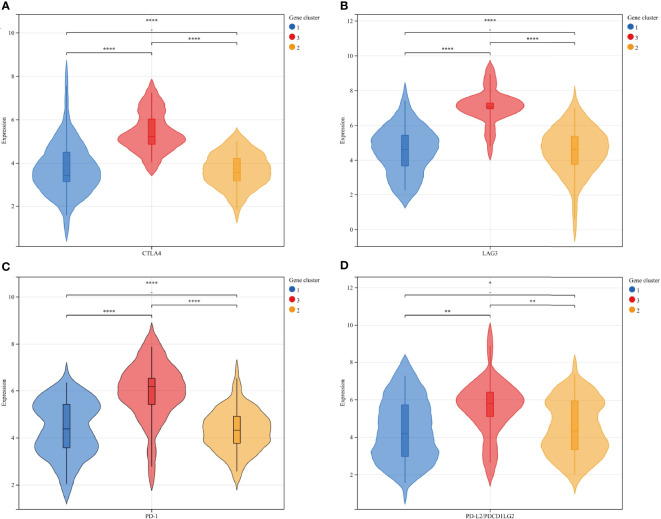
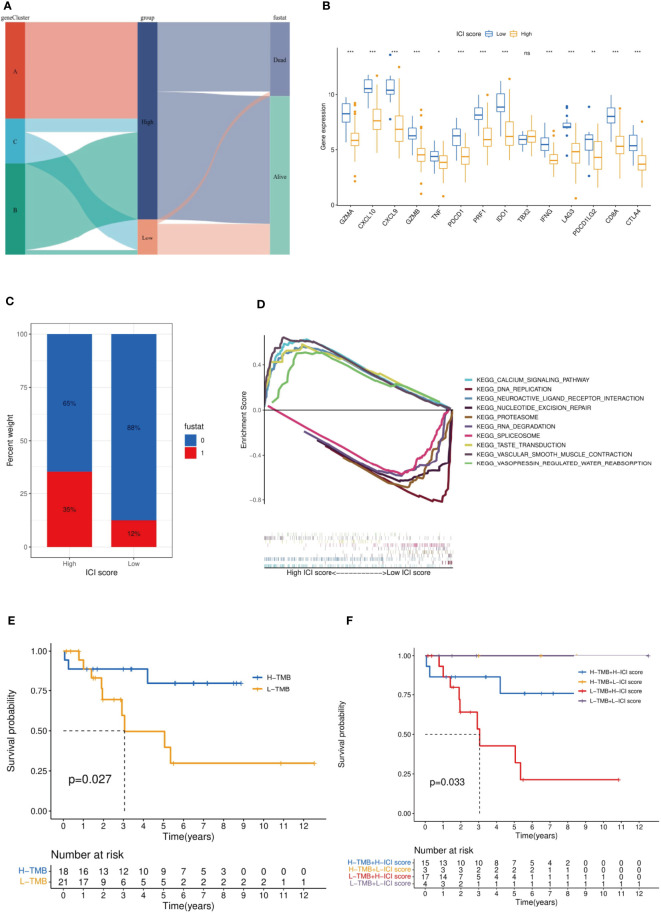
Myxofibrosarcoma (MFS) is a highly malignant subtype of soft tissue sarcoma, accounting for 5% of cases. Immunotherapy guided by immune cell infiltration (ICI) is reportedly a promising treatment strategy. Here, MFS samples (n = 104) from two independent databases were classified as ICI clusters A/B/C and gene clusters A/B/C. Then, a close relationship between ICI and gene clusters was established. We found that the features of these clusters were consistent with the characteristics of immune-inflamed tumors (cluster C), immune-desert tumors (cluster B), and immune-excluded tumors (cluster A). Moreover, cluster C was sensitive to immunotherapy. Finally, an independent ICI score was established to predict the therapeutic effect, which has prospects for application in guiding immunotherapy during clinical practice.

Keywords: ICI; MFS; TME; immunotherapy; prognosis.


Conflict of interest statement

The authors declare that the research was conducted in the absence of any commercial or financial relationships that could be construed as a potential conflict of interest.

Figures

Figure 1
Figure 1
We typed 104 samples from the TCGA-MFS and GEO (GSM 72545) through CIBERSORT analysis. The samples were finally divided into 3 independent subtypes according to the stability of typing results. (A–F) represent the sample purity when the typing was 2–7: The blue square in the figure represents different classification aggregations. The darker the color and the smaller the number of blanks, the lower the difference in the aggregated samples and the higher the purity of typing. (G–I) reflect the purity of typing and the stability in the samples: (G) The abscissa is the sample, and the ordinate is the different classification, reflecting the stability between samples after different classification; (H) Cumulative Distribution Function (CDF) curve showing the sampling error in different classifications; (I) Explanation of CDF curve, although the results of both analyses were better, we still chose 3 types in combination with (A–F).
Figure 2
Figure 2
Analysis of differences among ICI subtypes and immune infiltration characteristics. (A) We analyzed the difference in Overall Survival (OS) among the 3 ICI subtypes and visualized the details via a K-M survival curve: compared with ICI cluster A and ICI cluster C, the OS of ICI cluster B was significantly lower, p <0.001; (B) Unsupervised cluster analysis was used to analyze the distribution of immune infiltration characteristics in MFS samples. The abscissa represents the immune infiltrating characteristics, and the ordinate represents independent samples; (C) We explored the relationships among 24 immune infiltrating characteristics (22 kinds of immune infiltrating cells and Stromal/Immune Score): red indicated a positive correlation, and blue indicated a negative correlation. The higher the correlation, the larger the pie chart area; (D) The differences in expression of 24 immune infiltration characteristics in 3 ICI subtypes are visualized in a box plot: ***p <0.001, **p <0.01, and *p <0.05 ns p>0.05,no significance.
Figure 3
Figure 3
The expression differences between immune checkpoint-related genes and ICI subtypes were represented by a violin plot: CTLA4 (A), LAG3 (B), PD-1 (C), and PD-L2 (D): There was a significant statistical difference among the three groups. Among the four independent genes, ICI cluster C exhibited significantly higher expression than ICI clusters A and B, and the average expression of ICI cluster B was relatively lower than ICI cluster (A) ICI clusters: 1-blue-A, 2-yellow-B, 3-red-C. ****p<0.0001, ***p <0.001, **p <0.01, and *p <0.05.
Figure 4
Figure 4
We classified 104 different samples through unsupervised clustering. According to the obtained correlation results among types (A–F), the number of gene types was set to 3. The correlation among types was comparable; a low correlation was associated with stable classification results (G–I).
Figure 5
Figure 5
Differential analysis of genotyping of immune infiltration. (A) After unsupervised cluster analysis of DEGs and samples, we divided the samples into three independent gene clusters, the overall survival (OS) was analyzed by Kaplan–Meier analysis, and the log-rank test showed that P <0.001. (B) The differences in expression among 24 kinds of immune infiltrating characteristics in the 3 gene clusters were visualized in a box plot and statistically analyzed by Kruskal–Wallis test. (C) The clinical information was divided into two types. The abscissa was the samples, and the ordinate was the genes. (D, E) According to gene type A and gene type B, which were positively correlated with the ICI model in DEGs, the ordinate was the name of GO, the abscissa was the number of enriched genes, and the color represented the significance of the correlation (red indicated a positive correlation and blue indicated a negative correlation). ***p <0.001, **p <0.01, *p <0.05 and ns p>0.05,no significance.
Figure 6
Figure 6
The expression differences of 4 immune checkpoint-related genes in gene subtypes were consistent with ICI subtypes: CTLA4 (A), Lag3 (B), PD-1 (C), and PD-L2 (D): Gene clusters: 1-blue-A, 2-yellow-B, 3-red-C. **** p<0.0001 ***P <0.001, **P <0.01, and *P <0.05.
Figure 7
Figure 7
Established and verified the ICI score. (A) The relationship among gene clusters, ICI high or low groups and survival outcomes is visualized in a Sankey diagram. (B) Based on the ICI score, we analyzed the expression difference among the immune checkpoint genes and immune-activating genes. It should be noted that PDCD1LG2 is another name for PD-L2. (C) Effect of ICI score on patient survival. (D) GSEA indicated significantly enriched signaling pathways corresponding to high and low ICI score groups. (E) Survival analysis was performed by TMB score in our selected MFS samples. (F) MFS samples were stratified by TMB score and the ICI score established in this study. ***p<0.001,**p<0.01,*p<0.05 and ns p>0.05, no significance.

Similar articles

Cited by

References

    1. Sambri A, Spinnato P, Bazzocchi A, Tuzzato GM, Donati D, Bianchi G, et al. . Does pre-operative MRI predict the risk of local recurrence in primary myxofibrosarcoma of the extremities? Asia Pac J Clin Oncol (2019) 15:e181–6. doi: 10.1111/ajco.13161 - DOI - PubMed
    1. Rothenberger C, Jakob L, Betke M, French L, Bartsch H, Knosel T, et al. . Myxofibrosarcoma. Hautarzt (2020) 71:30–1. doi: 10.1007/s00105-020-04647-7 - DOI - PubMed
    1. Anderson WJ, Doyle LA. Updates from the 2020 world health organization classification of soft tissue and bone tumours. Histopathology (2021) 78:644–57. doi: 10.1111/his.14265 - DOI - PubMed
    1. Palmerini E, Righi A, Staals EL. Rare primary malignant bone sarcomas. Cancers (Basel) (2020) 124. doi: 10.3390/cancers12113092 - DOI - PMC - PubMed
    1. Murphey MD. World health organization classification of bone and soft tissue tumors: modifications and implications for radiologists. Semin Musculoskelet Radiol (2007) 11:201–14. doi: 10.1055/s-2008-1038310 - DOI - PubMed

Publication types

Substances

LinkOut - more resources