. 2022 Jul 27:2022:4931611.
doi: 10.1155/2022/4931611. eCollection 2022.

Silencing TUFM Inhibits Development of Monocrotaline-Induced Pulmonary Hypertension by Regulating Mitochondrial Autophagy via AMPK/mTOR Signal Pathway

Affiliations

Silencing TUFM Inhibits Development of Monocrotaline-Induced Pulmonary Hypertension by Regulating Mitochondrial Autophagy via AMPK/mTOR Signal Pathway

Ruyuan Wei et al. Oxid Med Cell Longev. .

Abstract

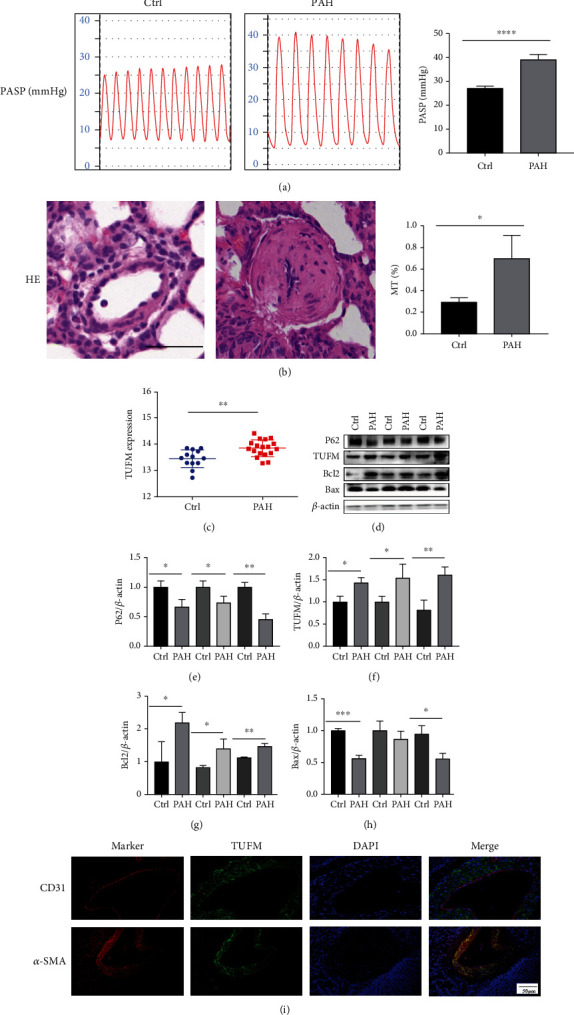
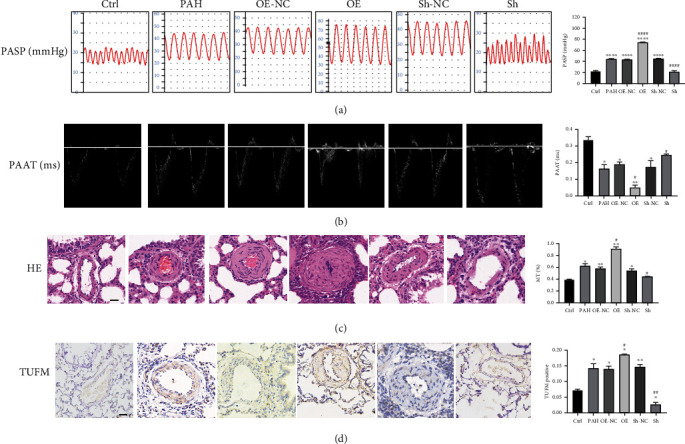
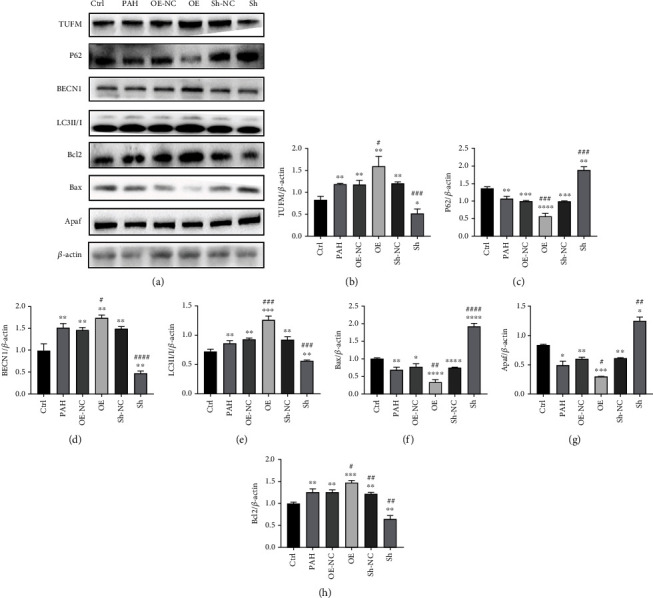
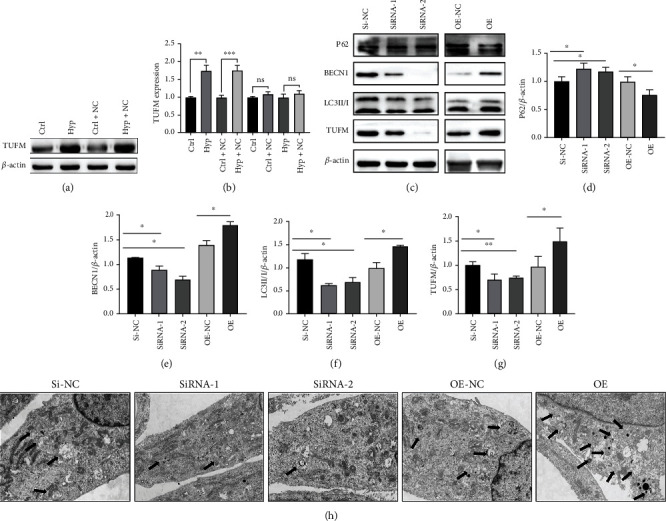
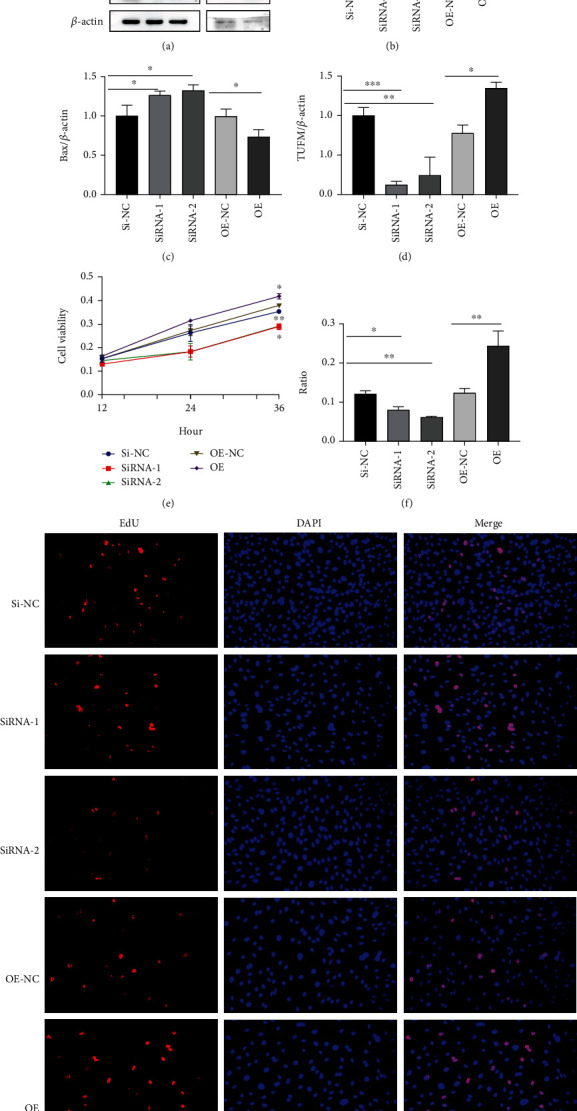
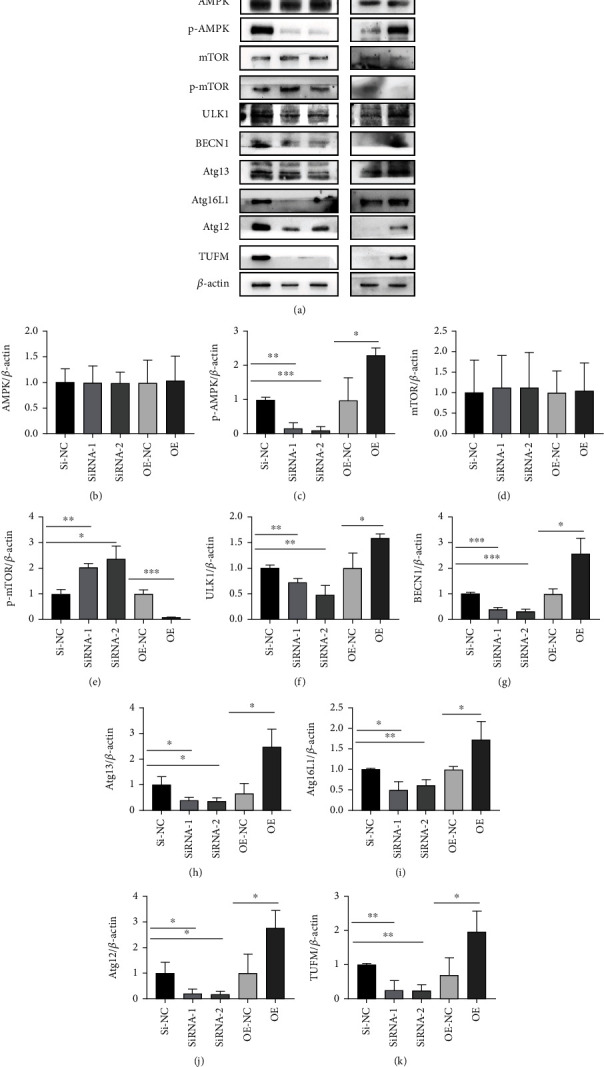
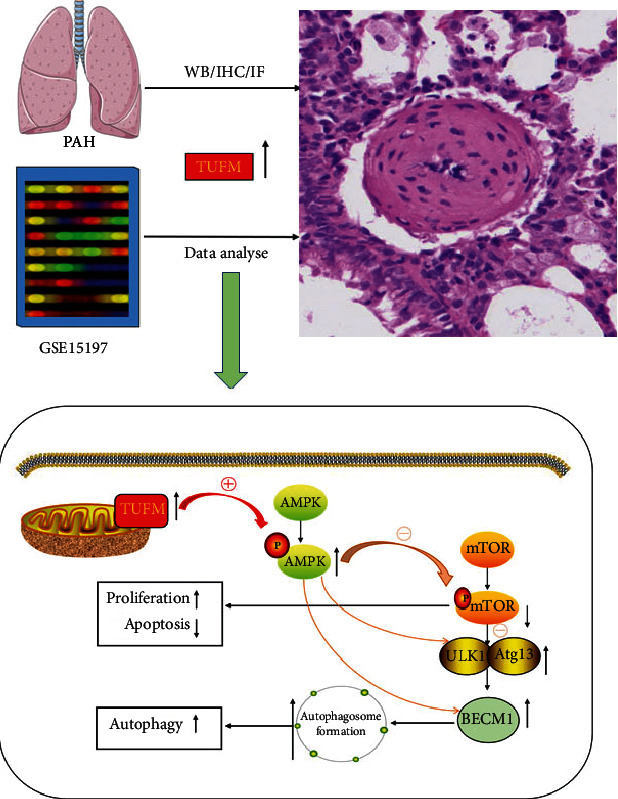
Pulmonary arterial hypertension (PAH) is an extremely malignant cardiovascular disease which mainly involves the uncontrollable proliferation of the pulmonary arterial smooth muscular cells (PASMCs). Recent studies have confirmed that mitochondria play an important role in the pathogenesis of pulmonary hypertension through sensing cell hypoxia, energy metabolism conversion, and apoptosis. As a mitochondrial membrane protein, TUFM has been regarded to be related to mitochondrial autophagy (mitophagy), apoptosis, and oxidative stress. Considering these factors are closely associated with the pathogenesis of PAH, we hypothesize that TUFM might play a role in the development of PAH. Our preliminary examination has showed TUFM mainly expressed in the PASMCs, and the subsequent test indicated an increased TUFM expression in the SMCs of pulmonary arteriole in monocrotaline- (MCT-) induced PAH rat model compared with the normal rat. The TUFM knockdown (Sh-TUFM) or overexpressed (OE-TUFM) rats were used to establish PAH by treating with MCT. A notable lower pulmonary arterial systolic pressure together with slightly morphological changes of pulmonary arteriole was observed in the Sh-TUFM group compared with the single MCT-induced PAH group. Increased levels of P62 and Bax and reduced LC3II/I, BECN1, and Bcl2 were detected in the Sh-TUFM group, while the expressions of these proteins in the OE-TUFM group were contrast to the results of the Sh-TUFM group. To elucidate the possible mechanism underlying biological effect of TUFM in PAH, PASMCs were treated with silence or overexpression of TUFM and then exposed to hypoxia condition. An obviously high levels of P62 and Bax along with a decreased LC3 II/I, BECN1, ULK1, Atg12, Atg13, and Bcl2 levels were noticed in cells with silence of TUFM. Moreover, the phosphorylated AMPK and mTOR which was well known in mitophagy modulating vary by the alternation of TUFM. These observations suggested that TUFM silence inhibits the development of MCT-induced PAH via AMPK/mTOR pathway.


Conflict of interest statement

The authors declare that they have no conflicts of interest.

Figures

Figure 1
Figure 1
Monocrotaline-induced pulmonary hypertension and the expression of TUFM in the pulmonary hypertension and normal control rats. (a) 28 days after monocrotaline induction of the model, the pulmonary arterial systolic pressure measured using the system. (b) Hematoxylin and eosin (HE) staining for the pulmonary arterioles of normal control and monocrotaline-induced PAH model. Scale bar: 50 μm. (c) Differential expression of TUFM from GSE15197 database analysis. (d) The initial test for TUFM, mitophagy marker P62, and apoptosis indicator Bax and Bcl2 expression in the normal control and monocrotaline-induced PAH rat. (e–h) Densitometry data represent the intensity of the quantitative expression of P62, TUFM, Bcl2, and Bax proteins. (i) Immunofluorescence chemistry examination indicated the location profile of TUFM in pulmonary arteries. Scale bar: 50 μm. Ctrl: normal control; PAH: pulmonary arterial hypertension. Data is presented as mean ± SD. n = 6 each group. P < 0.05 vs. Ctrl group, ∗∗P < 0.01, and ∗∗∗P < 0.001.
Figure 2
Figure 2
Characterization of different treated rats. (a) Images and ratio comparison of pulmonary arterial systolic pressure (mmHg). (b) Pulmonary artery accelerated time (ms). (c) Hematoxylin and eosin stain of paraffin slice. (d) Immunohistochemistry for TUFM in each group. Scale bar: 50 μm; Ctrl: normal control; PAH: pulmonary arterial hypertension; OE-NC: overexpression negative control; OE: overexpression of TUFM; Sh-NC: Sh-TUFM negative control; Sh: Sh-TUFM group; PASP: pulmonary arterial systolic pressure; PAAT: pulmonary arterial accelerated time; HE: hematoxylin and eosin stain. Data are presented as mean ± SD. n = 6 each group. P < 0.05 vs. Ctrl group, ∗∗P < 0.01, and ∗∗∗P < 0.001; #P < 0.05 vs. PAH group and ####P < 0.0001.
Figure 3
Figure 3
Expressions of TUFM and the autophagy indicators in different treated groups. (a) Western blot of TUFM, LC3II/I, Bax, Bcl2, BECN1, P62, and Apaf expression in each group as indicated. (b–h) Densitometry data represent the intensity of each group. Ctrl: normal control; PAH: pulmonary arterial hypertension; OE-NC: overexpression negative control; OE: overexpression of TUFM; Sh-NC: Sh-TUFM negative control; Sh: Sh-TUFM group. Data is presented as mean ± SD. n = 6 each group. P < 0.05 vs. Ctrl group, ∗∗P < 0.01, ∗∗∗P < 0.001, and ∗∗∗∗P < 0.0001; #P < 0.05 vs. PAH group, ##P < 0.01, ###P < 0.001, and ####P < 0.0001.
Figure 4
Figure 4
Hypoxia induced the overexpression of TUFM, and the silence of TUFM decreased the mitophagy of smooth muscle cells under hypoxia condition. (a) TUFM expression in smooth muscle cells under normoxia and hypoxia conditions. (b) Schematic representation of the quantitative expression of TUFM protein. (c) TUFM, LC3 II/I, BECN1, and P62 expression in hypoxia of each group. (d–g) Densitometry data represent the intensity of each group. (h) Autophagy of pulmonary artery smooth muscle cells collected by transmission electron microscopy in each group. Scale bar: 2 μm. Ctrl: control; Hyp: hypoxia; Ctrl-NC: control+empty vehicle; Hyp-NC: hypoxia+empty vehicle; OE-NC: negative control of TUFM overexpression; OE: overexpression of TUFM; Si-NC: small inference RNA of TUFM negative control; SiRNA: small inference RNA of TUFM. Data is presented as mean ± SD, P < 0.05, ∗∗P < 0.01, and ∗∗∗P < 0.001.
Figure 5
Figure 5
Absence of TUFM improved the apoptosis and reduced the proliferation of PASMCs. (a) TUFM, Bax, and Bcl2 expression under hypoxia condition. (b–d) Densitometry data represent the intensity of each group. (e) Cell viability tested by CCK-8 under hypoxia condition. (f) Quantification of proliferation level in smooth muscle cell by EdU assay kit. (g) Cell proliferation activity of each group under hypoxia. Scale bar: 50 μm. Data is presented as mean ± SD. P < 0.05, ∗∗P < 0.01, and ∗∗∗P < 0.001.
Figure 6
Figure 6
Alleviated mitophagy by TUFM silence is associated with AMPK/mTOR pathway. (a) Representative western blot bands for TUFM, AMPK, p-AMPK, mTOR, p-mTOR, BECN1, Atg13, Atg16L1, ULK1, and Atg12. (b–k) Densitometry data represent the intensity of each group. The data is presented as the mean ± SD. P < 0.05, ∗∗P < 0.01, and ∗∗∗P < 0.001.
Figure 7
Figure 7
Schematic figure of the current study. Increased TUFM expression in hypoxia-stimulated pulmonary arterial hypertension cells causes an increasing mtDNA translation, leading to dysfunction of the mitochondrial respiratory chain. Mitochondrial dysfunction induces cellular stress and then activates AMPK. On the one hand, activated AMPK decreases the phosphorylation level of mTOR, inhibits the activity of mTOR, and then disassociates from ULK1. Thus, phosphorylation of specific sites of ULK1 and Atg13 is released. Meanwhile, the ULK1 complex is activated through autophosphorylation at thr180 and phosphorylates Atg13, FIP200, atg101, and other Atg proteins. The activated ULK1 complex then translocates to the isolation membrane of the endoplasmic reticulum, where autophagy is initiated. On the other hand, activated AMPK will directly stimulate ULK1 and BECN1, initiating autophagy.

References

    1. Bernal-Ramírez J., Silva-Platas C., Jerjes-Sánchez C., et al. Resveratrol prevents right ventricle dysfunction, calcium mishandling, and energetic failure via Sirt3 stimulation in pulmonary arterial hypertension. Oxidative Medicine and Cellular Longevity . 2021;2021:15. doi: 10.1155/2021/9912434.9912434 - DOI - PMC - PubMed
    1. Marshall J. D., Bazan I., Zhang Y., Fares W. H., Lee P. J. Mitochondrial dysfunction and pulmonary hypertension: cause, effect, or both. American Journal of Physiology-Lung Cellular and Molecular Physiology . 2018;314(5):L782–Ll96. - PMC - PubMed
    1. Hassoun P. M. Pulmonary arterial hypertension. The New England Journal of Medicine . 2021;385(25):2361–2376. - PubMed
    1. Hoffmann R. F., Jonker M. R., Brandenburg S. M., et al. Mitochondrial dysfunction increases pro-inflammatory cytokine production and impairs repair and corticosteroid responsiveness in lung epithelium. Scientific Reports . 2019;9(1, article 15047) - PMC - PubMed
    1. Wanderoy S., Hees J. T., Klesse R., Edlich F., Harbauer A. B. Kill one or kill the many: interplay between mitophagy and apoptosis. Biological Chemistry . 2020;402(1):73–88. - PubMed

MeSH terms