

Casein-Coated Molybdenum Disulfide Nanosheets Augment the Bioactivity of Alginate Microspheres for Orthopedic Applications
- PMID: 35936459
- PMCID: PMC9352227
- DOI: 10.1021/acsomega.2c00995
Casein-Coated Molybdenum Disulfide Nanosheets Augment the Bioactivity of Alginate Microspheres for Orthopedic Applications
Abstract
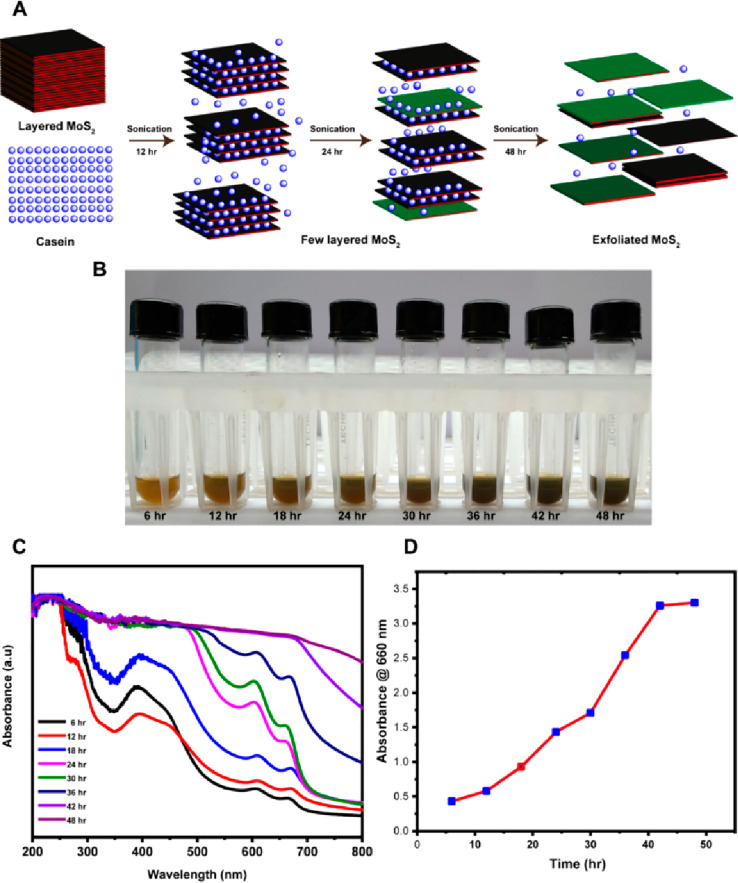
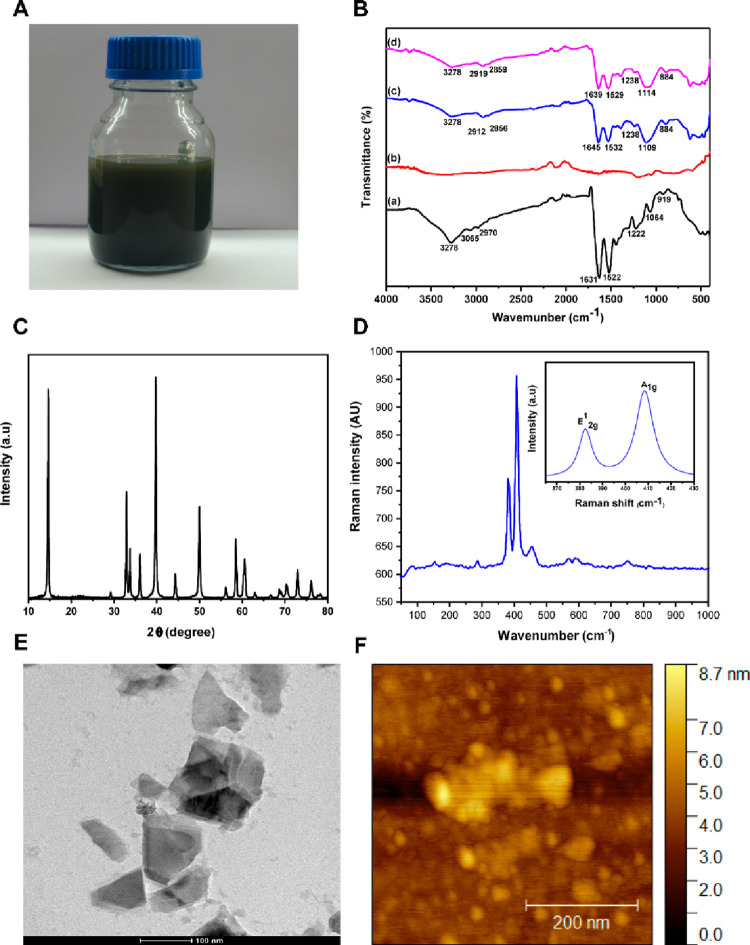
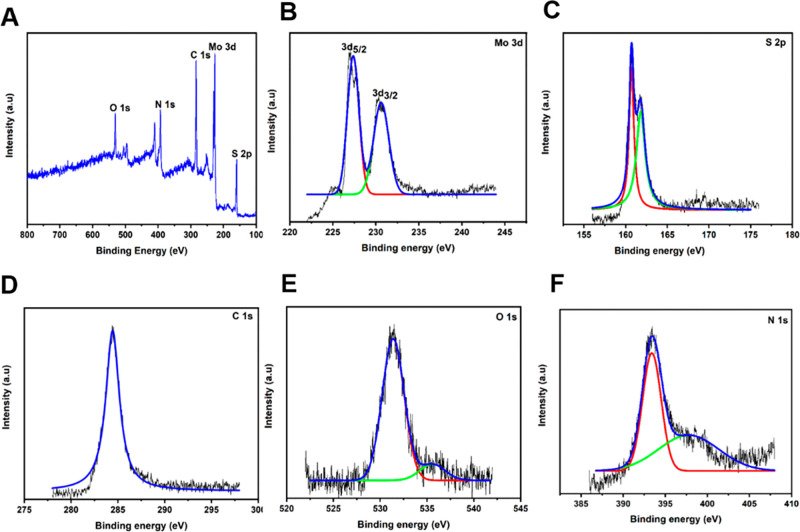
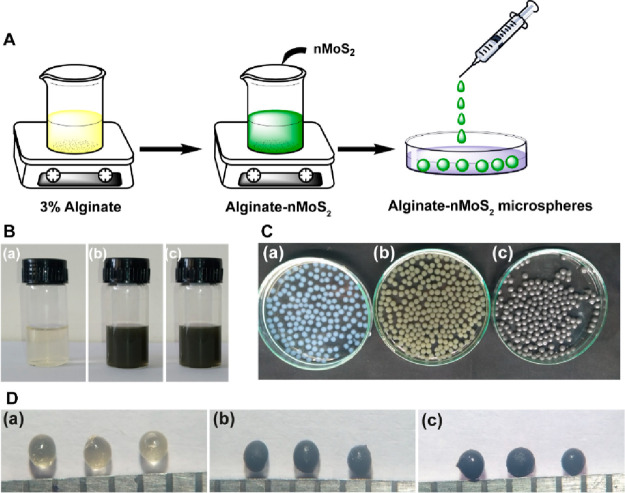
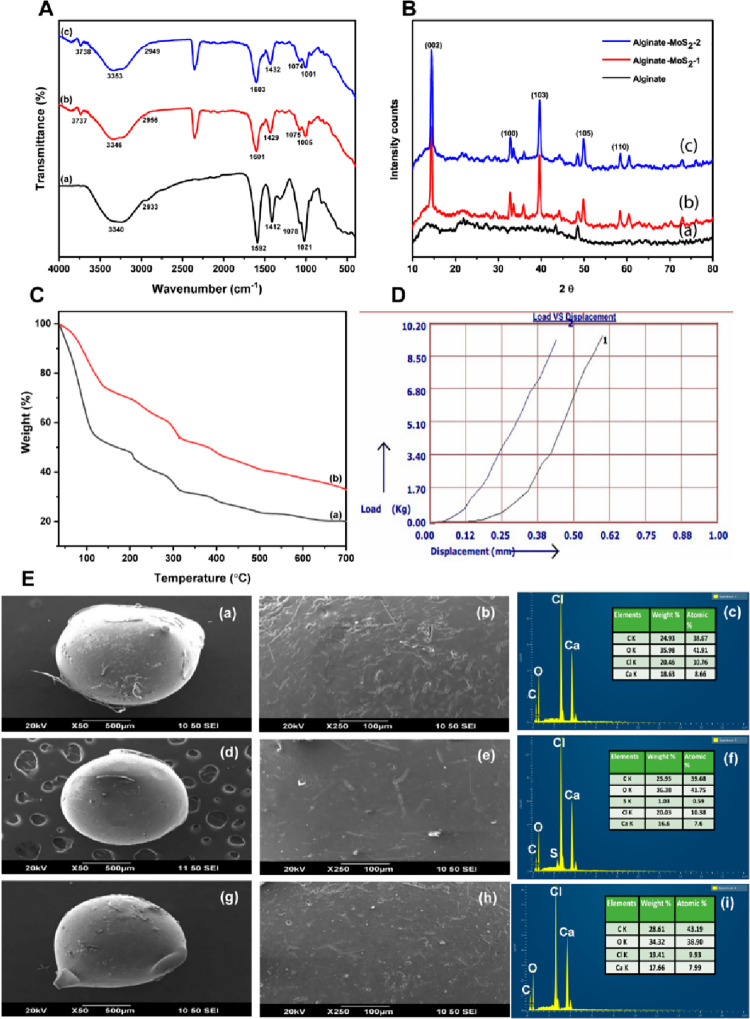
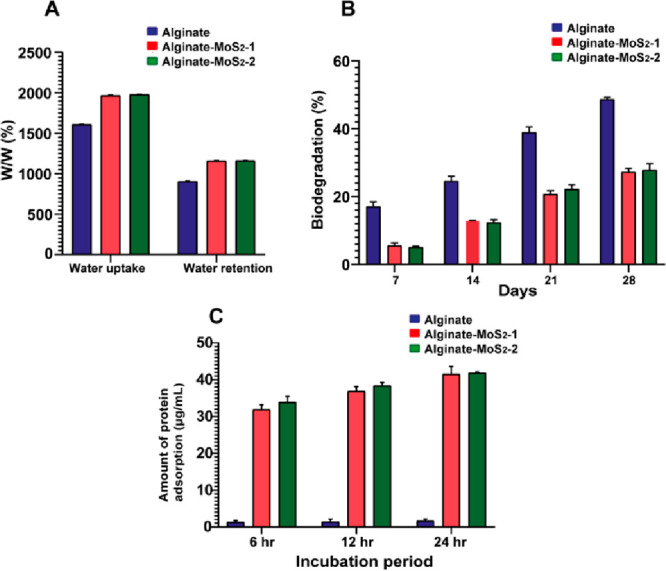
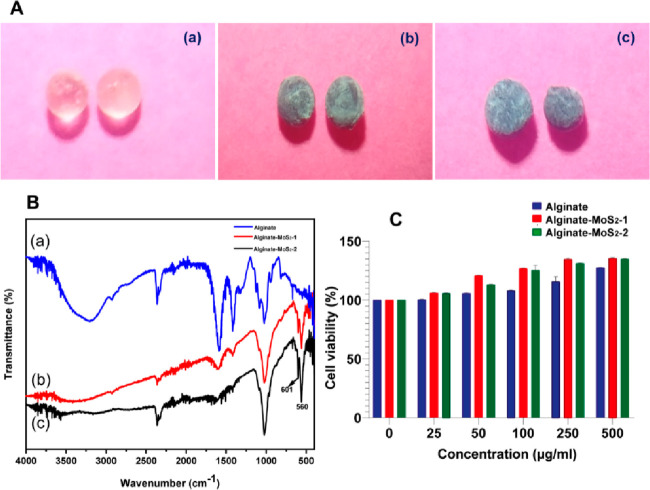
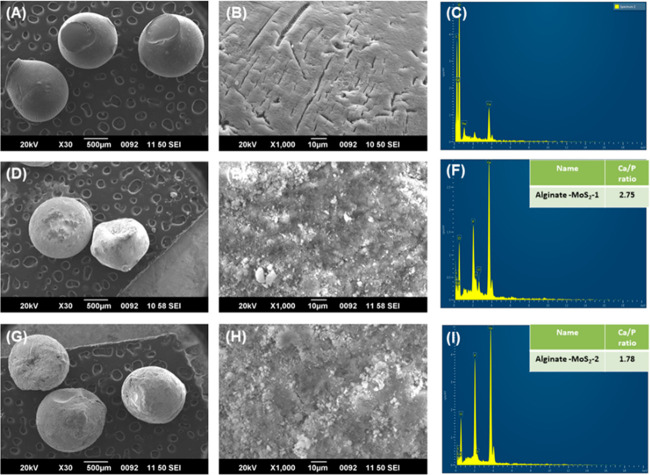
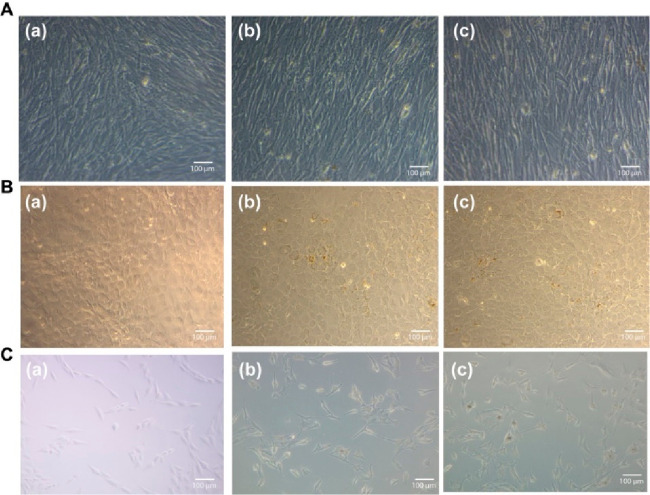
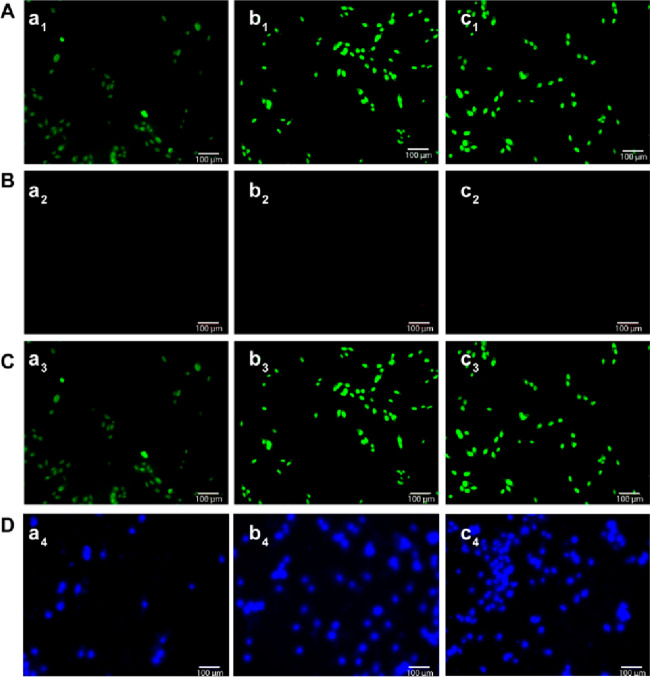
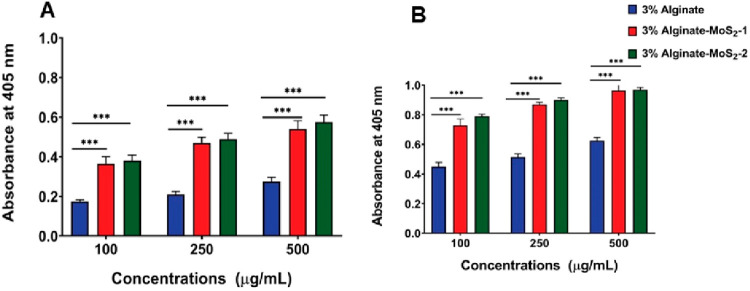
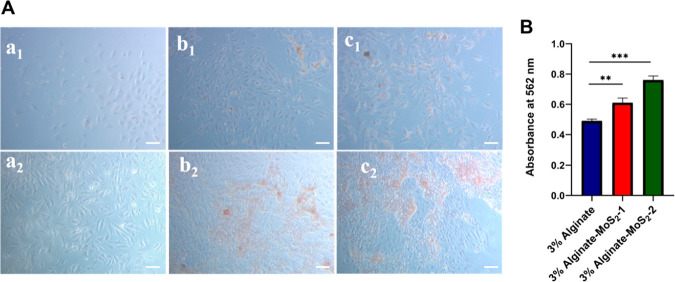
Defects and disorders of the bone due to disease, trauma, or abnormalities substantially affect a person's life quality. Research in bone tissue engineering is motivated to address these clinical needs. The present study demonstrates casein-mediated liquid exfoliation of molybdenum disulfide (MoS2) and its coupling with alginate to create microspheres to engineer bone graft substitutes. Casein-exfoliated nano-MoS2 was chemically characterized using different analytical techniques. The UV-visible spectrum of nano-MoS2-2 displayed strong absorption peaks at 610 and 668 nm. In addition, the XPS spectra confirmed the presence of the molybdenum (Mo, 3d), sulfur (S, 2p), carbon (C, 1s), oxygen (O, 1s), and nitrogen (N, 1s) elements. The exfoliated MoS2 nanosheets were biocompatible with the MG-63, MC3T3-E1, and C2C12 cells at 250 μg/mL concentration. Further, microspheres were created using alginate, and they were characterized physiochemically and biologically. Stereomicroscopic images showed that the microspheres were spherical with an average diameter of 1 ± 0.2 mm. The dispersion of MoS2 in the alginate matrix was uniform. The alginate-MoS2 microspheres promoted apatite formation in the SBF (simulated body fluid) solution. Moreover, the alginate-MoS2 was biocompatible with MG-63 cells and promoted cell proliferation. Higher alkaline phosphatase activity and mineralization were observed on the alginate-MoS2 with the MG-63 cells. Hence, the developed alginate-MoS2 microsphere could be a potential candidate for a bone graft substitute.
© 2022 The Authors. Published by American Chemical Society.
Conflict of interest statement
The authors declare no competing financial interest.
Figures
Similar articles
-
Enhanced Bioactivity of Chitosan-Alginate-Riboflavin Liquid-Exfoliated Molybdenum Disulfide Nanosheets for Bone Tissue Engineering Applications.ACS Omega. 2024 Nov 11;9(47):46904-46915. doi: 10.1021/acsomega.4c06049. eCollection 2024 Nov 26. ACS Omega. 2024. PMID: 39619530 Free PMC article.
-
Casein-assisted exfoliation of tungsten disulfide nanosheets for biomedical applications.Colloids Surf B Biointerfaces. 2023 Dec;232:113595. doi: 10.1016/j.colsurfb.2023.113595. Epub 2023 Oct 17. Colloids Surf B Biointerfaces. 2023. PMID: 37913705
-
Albumin-induced exfoliation of molybdenum disulfide nanosheets incorporated polycaprolactone/zein composite nanofibers for bone tissue regeneration.Mater Sci Eng C Mater Biol Appl. 2020 Nov;116:111162. doi: 10.1016/j.msec.2020.111162. Epub 2020 Jun 15. Mater Sci Eng C Mater Biol Appl. 2020. PMID: 32806283
-
Colloidal 2D nanosheets of MoS2 and other transition metal dichalcogenides through liquid-phase exfoliation.Adv Colloid Interface Sci. 2017 Jul;245:40-61. doi: 10.1016/j.cis.2017.04.014. Epub 2017 Apr 25. Adv Colloid Interface Sci. 2017. PMID: 28477866 Review.
-
Molybdenum disulfide nanosheets: From exfoliation preparation to biosensing and cancer therapy applications.Colloids Surf B Biointerfaces. 2020 Oct;194:111162. doi: 10.1016/j.colsurfb.2020.111162. Epub 2020 May 31. Colloids Surf B Biointerfaces. 2020. PMID: 32512311 Review.
Cited by
-
Fabrication and characterizations of simvastatin-containing mesoporous bioactive glass and molybdenum disulfide scaffold for bone tissue engineering.APL Bioeng. 2023 Dec 4;7(4):046115. doi: 10.1063/5.0172002. eCollection 2023 Dec. APL Bioeng. 2023. PMID: 38058994 Free PMC article.
-
Thermo-controlled microfluidic generation of monodisperse alginate microspheres based on external gelation.RSC Adv. 2024 Oct 10;14(44):32021-32028. doi: 10.1039/d4ra07049f. eCollection 2024 Oct 9. RSC Adv. 2024. PMID: 39391621 Free PMC article.
-
Microspheres with 2D rGO/Alginate Matrix for Unusual Prolonged Release of Cefotaxime.Nanomaterials (Basel). 2023 May 1;13(9):1527. doi: 10.3390/nano13091527. Nanomaterials (Basel). 2023. PMID: 37177072 Free PMC article.
-
Enhanced Bioactivity of Chitosan-Alginate-Riboflavin Liquid-Exfoliated Molybdenum Disulfide Nanosheets for Bone Tissue Engineering Applications.ACS Omega. 2024 Nov 11;9(47):46904-46915. doi: 10.1021/acsomega.4c06049. eCollection 2024 Nov 26. ACS Omega. 2024. PMID: 39619530 Free PMC article.
References
-
- Tonello S.; Bianchetti A.; Braga S.; Almici C.; Marini M.; Piovani G.; Guindani M.; Dey K.; Sartore L.; Re F. Impedance-based monitoring of mesenchymal stromal cell three-dimensional proliferation using aerosol jet printed sensors: A tissue engineering application. Materials 2020, 13 (10), 2231.10.3390/ma13102231. - DOI - PMC - PubMed
-
- Koons G. L.; Diba M.; Mikos A. G. Materials design for bone-tissue engineering. Nat. Rev. Mater. 2020, 5 (8), 584–603. 10.1038/s41578-020-0204-2. - DOI
LinkOut - more resources
Full Text Sources
