. 2022 Jul 22:16:930384.
doi: 10.3389/fncel.2022.930384. eCollection 2022.

Contributions of Astrocyte and Neuronal Volume to CA1 Neuron Excitability Changes in Elevated Extracellular Potassium

Affiliations

Contributions of Astrocyte and Neuronal Volume to CA1 Neuron Excitability Changes in Elevated Extracellular Potassium

Erin Walch et al. Front Cell Neurosci. .

Abstract

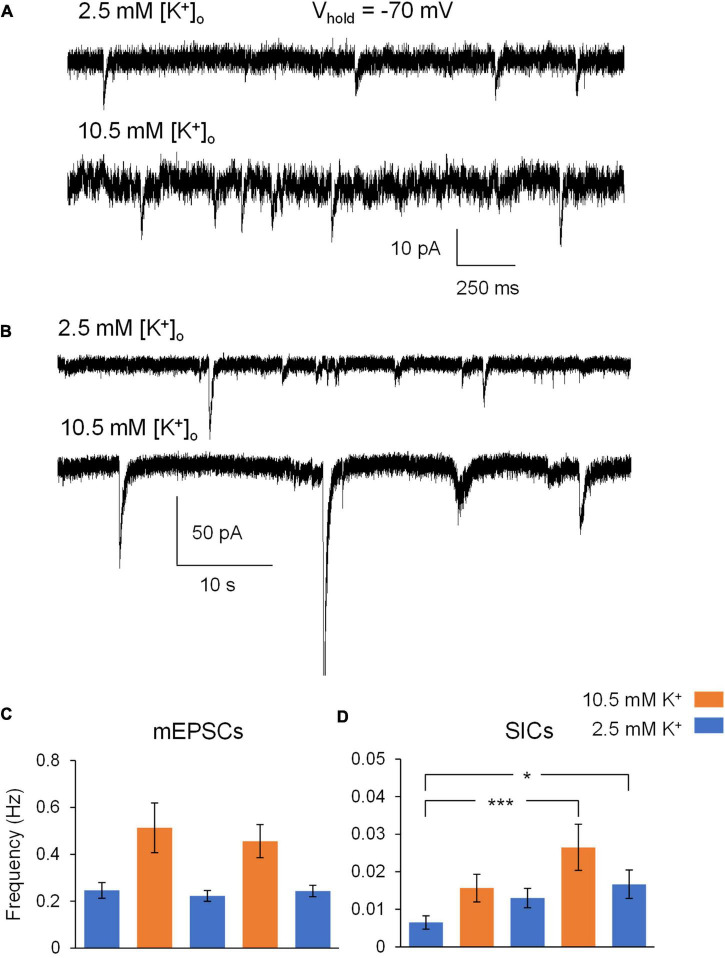
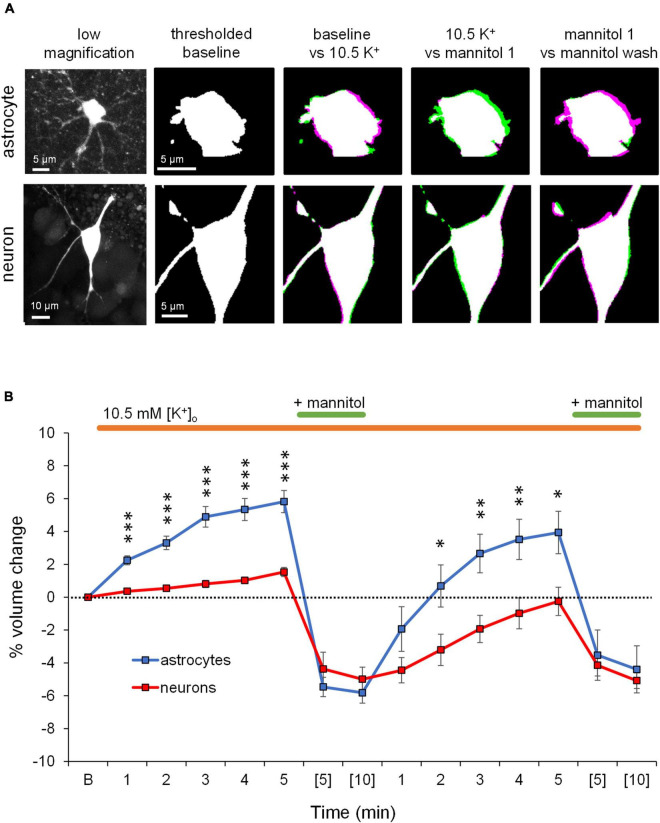
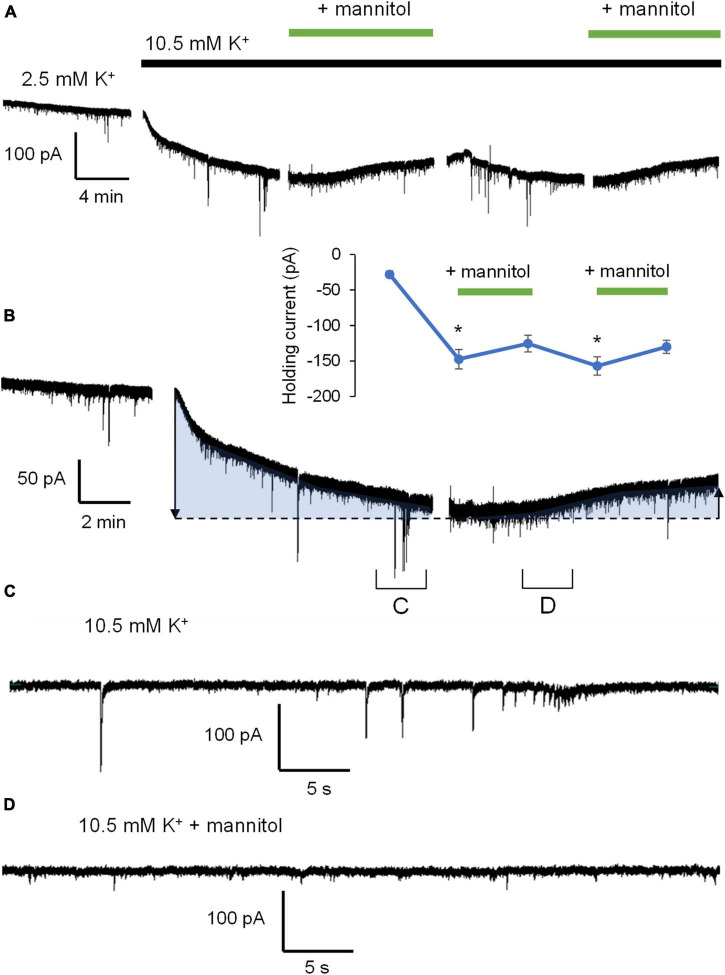
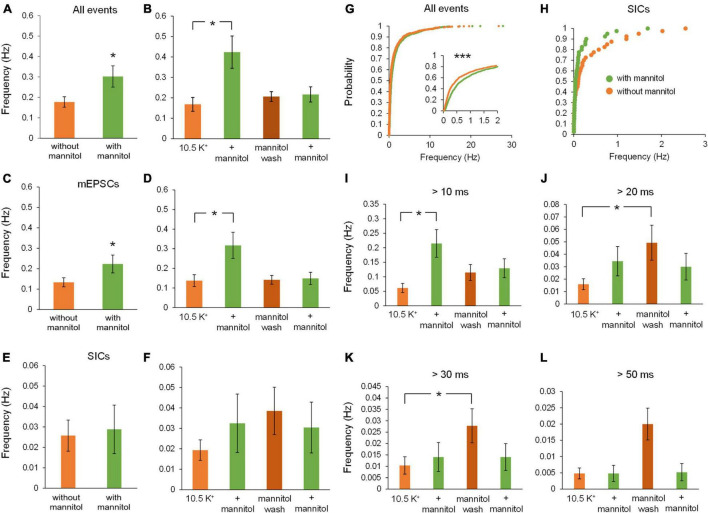
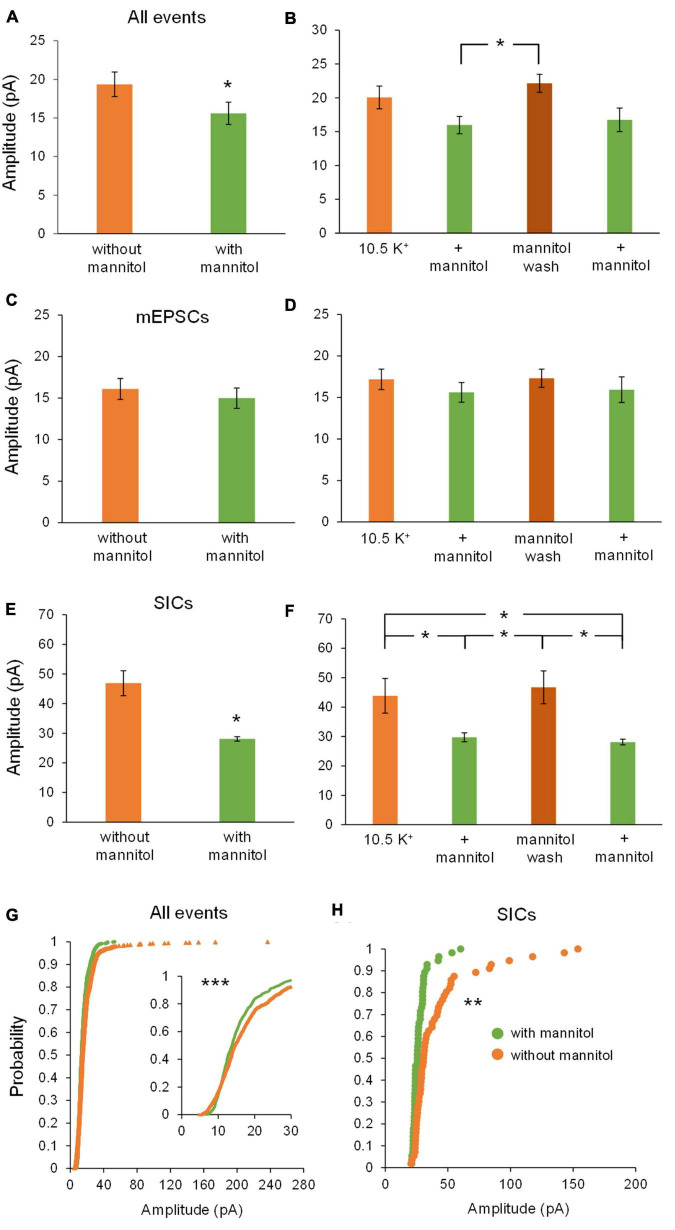
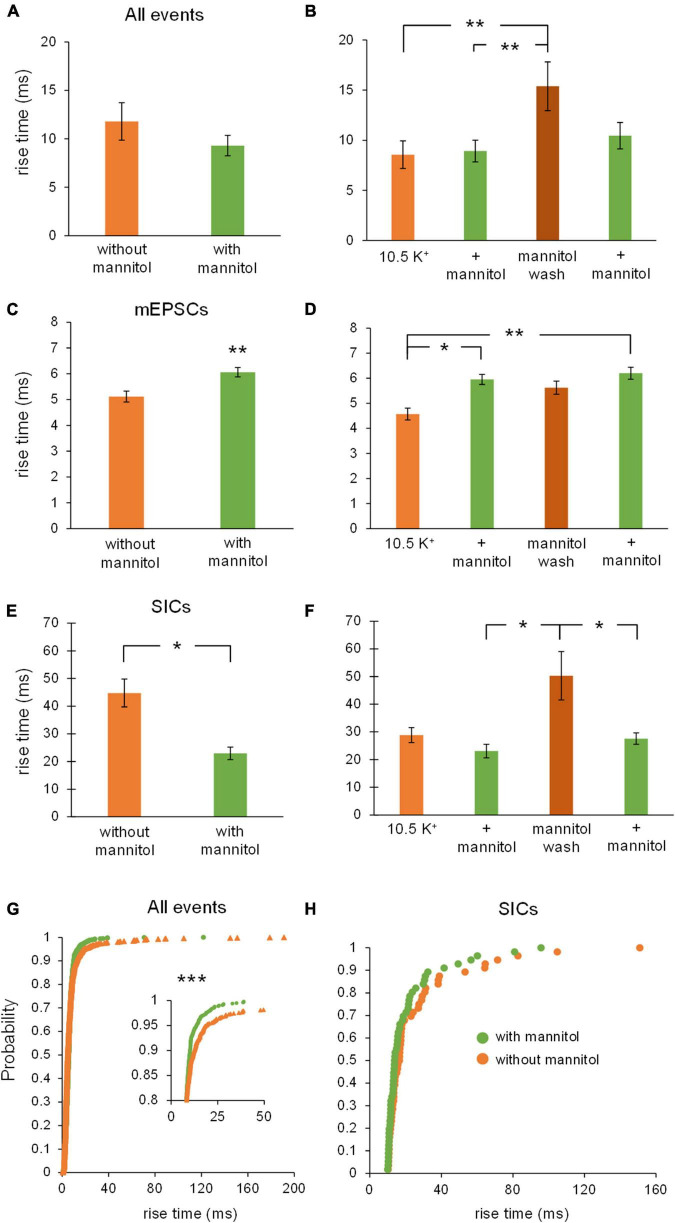
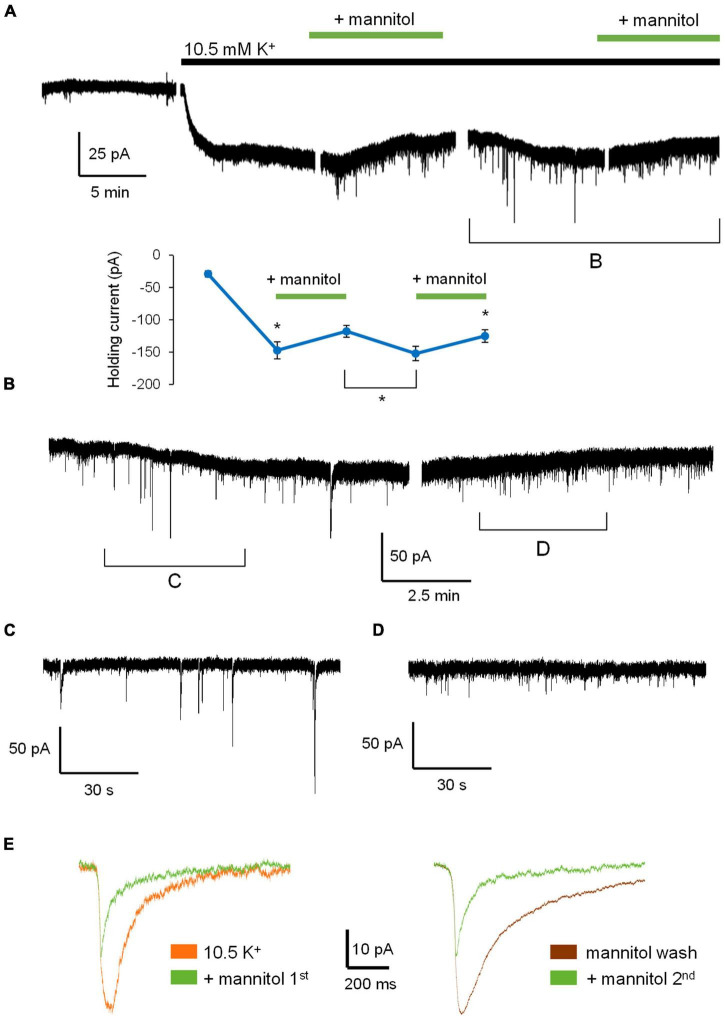
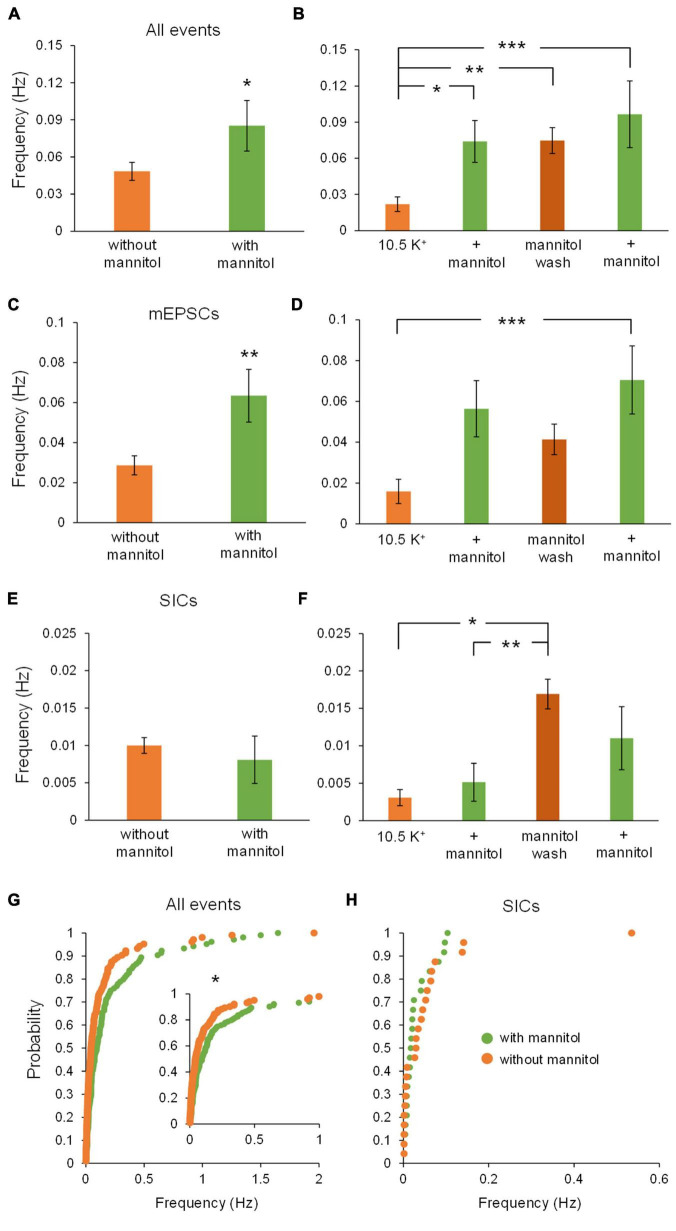
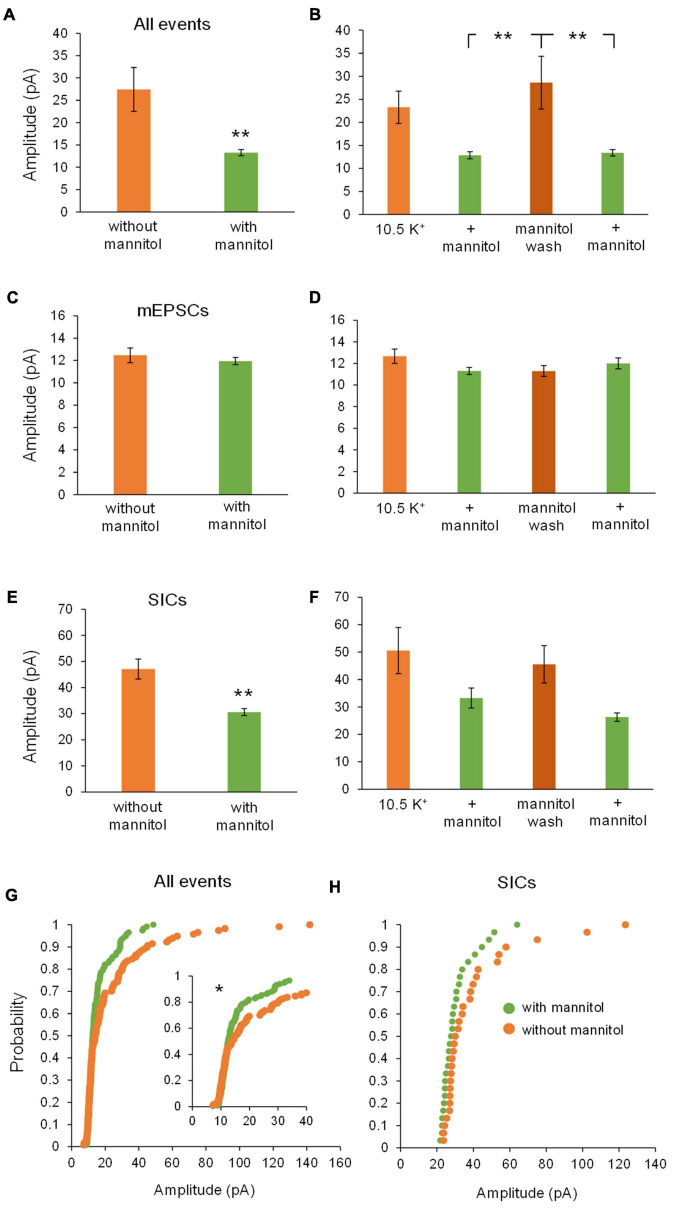
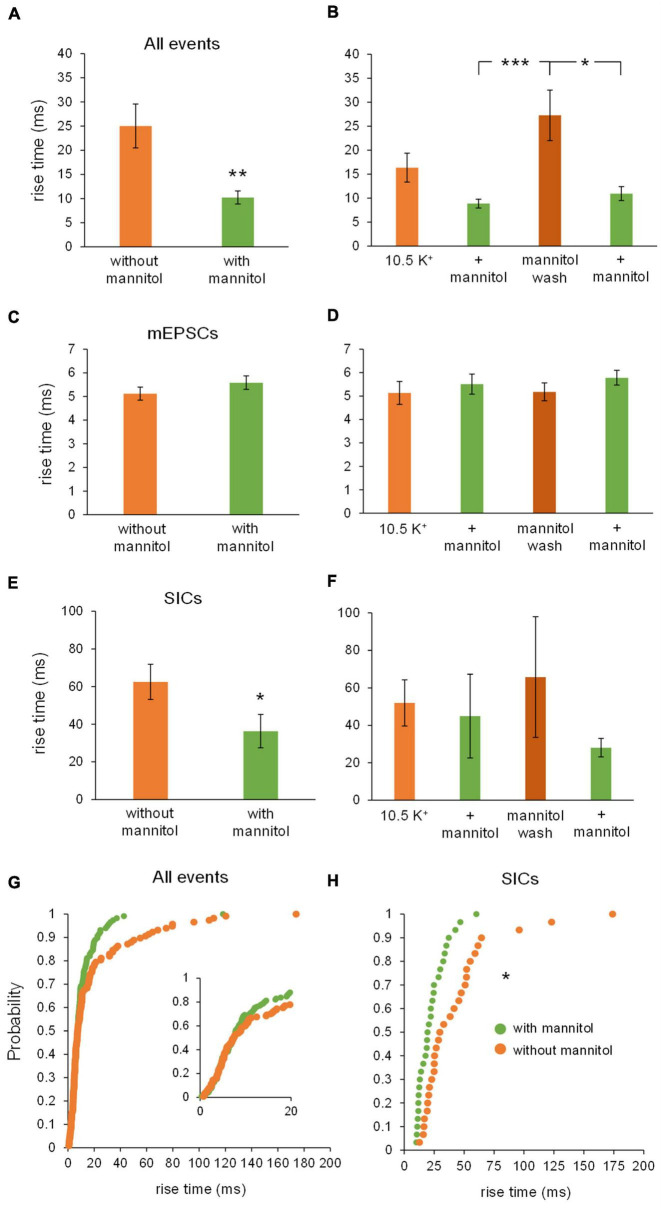
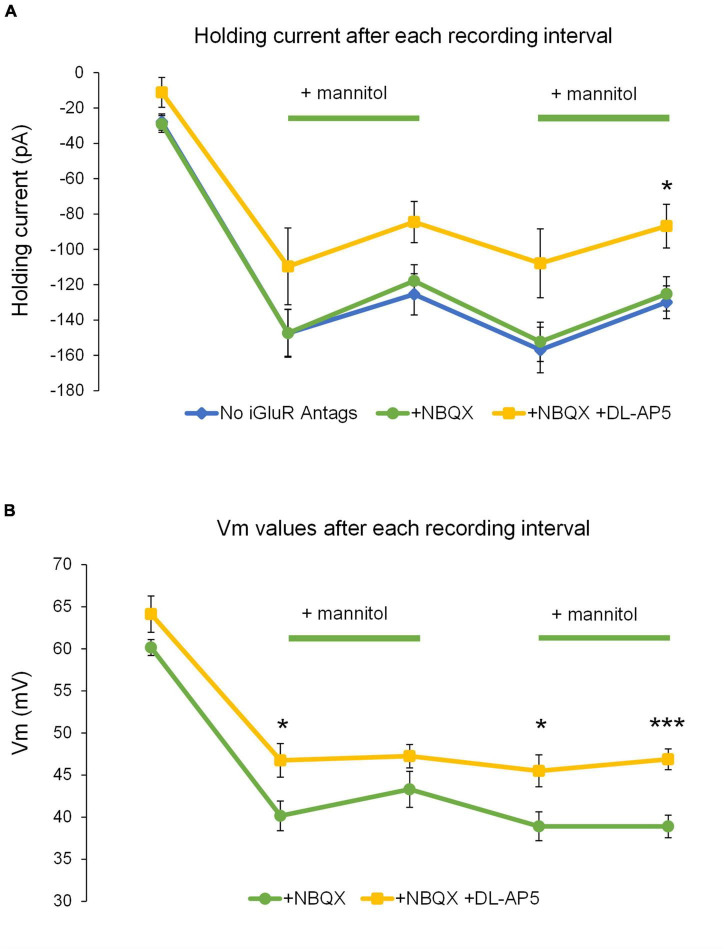
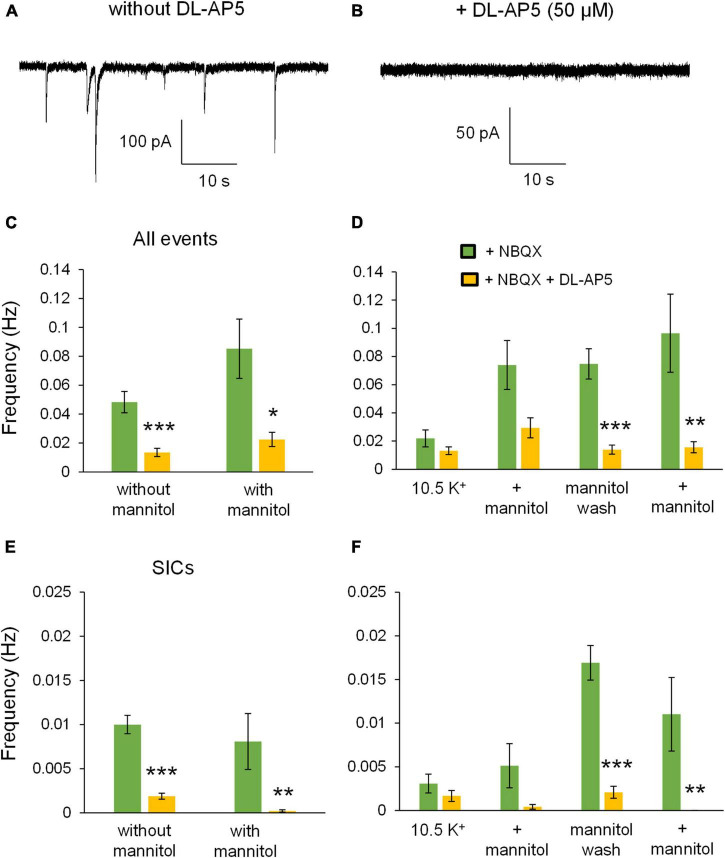
Rapid increases in cell volume reduce the size of the extracellular space (ECS) and are associated with elevated brain tissue excitability. We recently demonstrated that astrocytes, but not neurons, rapidly swell in elevated extracellular potassium ([K+] o ) up to 26 mM. However, effects of acute astrocyte volume fluctuations on neuronal excitability in [K+] o have been difficult to evaluate due to direct effects on neuronal membrane potential and generation of action potentials. Here we set out to isolate volume-specific effects occurring in [K+] o on CA1 pyramidal neurons in acute hippocampal slices by manipulating cell volume while recording neuronal glutamate currents in 10.5 mM [K+] o + tetrodotoxin (TTX) to prevent neuronal firing. Elevating [K+] o to 10.5 mM induced astrocyte swelling and produced significant increases in neuronal excitability in the form of mixed α-amino-3-hydroxy-5-methyl-4-isoxazolepropionic acid (AMPA)/N-methyl-D-aspartate (NMDA) receptor mEPSCs and NMDA receptor-dependent slow inward currents (SICs). Application of hyperosmolar artificial cerebrospinal fluid (ACSF) by addition of mannitol in the continued presence of 10.5 mM K+ forced shrinking of astrocytes and to a lesser extent neurons, which resisted swelling in [K+] o . Cell shrinking and dilation of the ECS significantly dampened neuronal excitability in 10.5 mM K+. Subsequent removal of mannitol amplified effects on neuronal excitability and nearly doubled the volume increase in astrocytes, presumably due to continued glial uptake of K+ while mannitol was present. Slower, larger amplitude events mainly driven by NMDA receptors were abolished by mannitol-induced expansion of the ECS. Collectively, our findings suggest that cell volume regulation of the ECS in elevated [K+] o is driven predominantly by astrocytes, and that cell volume effects on neuronal excitability can be effectively isolated in elevated [K+] o conditions.

Keywords: NMDA; cell swelling; epilepsy; extracellular space; extrasynaptic; glutamate; secretagogue; slow inward currents.


Conflict of interest statement

The authors declare that the research was conducted in the absence of any commercial or financial relationships that could be construed as a potential conflict of interest.

Figures

FIGURE 1
FIGURE 1
Exposure of hippocampal slices to [K+]o ACSF leads to increases in neuronal excitability. (A) Cropped sections of a gap-free recording of mixed AMPA/NMDA mEPSCs from a representative CA1 pyramidal neuron during whole-cell patch clamp electrophysiology (voltage clamped at –70 mV) during exposure to Mg2+-free ACSF (top) and Mg2+-free [K+]o ACSF (bottom) in 1 μM TTX. (B) Cropped sections of a gap-free recording of slow-inward currents from a representative CA1 pyramidal neuron during whole-cell patch clamp electrophysiology (voltage clamped at –70 mV) during exposure to Mg2+-free ACSF (top) and Mg2+-free [K+]o ACSF (bottom) in 1 μM TTX. (C) Exposure to [K+]o ACSF led to an increase in average mEPSC frequency during both the 1st and 2nd (5 min) applications, in comparison to the three (10 min; 0–5 min and 5–10 min) recording periods in control ACSF (n = 11). (D) Initial exposure to [K+]o ACSF led to an increase in average SIC frequency in comparison to the baseline SIC frequency in control ACSF. Increased SIC frequency persisted throughout the remainder of the experiment, despite two subsequent (10 min) periods in control ACSF. n = 9 neuronal recordings; 1 recording per slice. *p < 0.05 and ***p < 0.001.
FIGURE 2
FIGURE 2
Application of mannitol in the presence of [K+]o decreases the volume of both astrocytes and neurons. (A) Representative confocal images of a stratum radiatum astrocyte (top) and CA1 pyramidal neuron (bottom) used in volume imaging experiments (far left). The second column shows the baseline volume of the astrocyte and neuron somata in binarized thresholded images (white). The next three columns show overlaid images of the astrocyte and neuron cell soma during each of the specified conditions. Magenta regions indicate increases in cell volume, while green regions indicate reductions in cell volume. Application of [K+] ACSF triggered noticeable astrocyte volume increase compared to baseline, while neuronal volume remained relatively constant. In the continued presence of [K+]o, introduction of mannitol triggered astrocyte and neuron volume decrease compared to [K+]o alone. During the washout of mannitol, astrocytes dramatically increased in volume, while neuronal volume mostly recovered to baseline. (B) Baseline soma volume was determined as the average soma area calculated from three z-stacks taken at minutes 8, 9, and 10 in control ACSF. Graph depicts average percent volume change from baseline (“B”) of astrocytes (blue, n = 11) and neurons (red, n = 13) during continuous exposure to [K+]o ACSF (orange bar) and two 10-min exposures to mannitol (green bar). One z-stack of the cell soma was collected every minute during exposure to [K+]o. During combined exposure to [K+]o and mannitol, a z-stack was collected at minutes (5) and (10). Note significant shrinkage of astrocyte somas by nearly 10% (p < 0.001) compared to approximately 3% (p < 0.01) by neurons during the 1st application of dual exposure to [K+]o and mannitol. Washout of mannitol resulted in a rebound of astrocyte volume to approximately 3% above baseline (p < 0.01), while neuron volume increased minimally. Asterisks denote significant differences between astrocyte and neuron volume at each timepoint. *p < 0.05, **p < 0.01, and ***p < 0.001.
FIGURE 3
FIGURE 3
Application of hyperosmolar [K+]o ACSF triggers changes in both tonic and phasic excitatory currents. (A) Representative recording of a neuron voltage-clamped at –70 mV for the duration of the experiment in Mg2+-free ACSF + 1 μM TTX. Gaps in recordings coincide with periodic measurement membrane potential and holding current in order to reassess patch-clamp quality between alternating 10-min ACSF treatments: Control ACSF, [K+]o, [K+]o + mannitol, mannitol washout, and [K+]o + mannitol (10 min ea.). (B) Partial section of ACSF baseline, 10-min application of [K+]o, and 10 min application of [K+]o with mannitol added to show greater detail of changes in activity. Shaded sections correspond to changes in holding current indicating depolarization or hyperpolarization during each application. The inset shows the value of holding current measured at the end of each application period. (C) An ∼1 min section of the recording in (B) showing individual events during exposure to [K+]o. (D) An ∼1 min section of the recording in (B) showing individual events during exposure to [K+]o with mannitol. Note the prominence of large SIC events in [K+]o and smaller mEPSC events in hyperosmolar [K+]o. *p < 0.05.
FIGURE 4
FIGURE 4
Addition of mannitol increases overall event frequency but frequency of slower events is increased after mannitol removal. The frequency of events was obtained for the combined 20-min applications of each solution, as well as for individual 10-min recording sequences. (A) Average event frequency during exposure to [K+]o alone was much lower than during addition of mannitol (n = 9). (B) Frequency of all events was drastically increased when mannitol was first introduced, but not with the second mannitol application (n = 8). (C) Average frequency of mEPSCs was higher in mannitol compared to [K+]o alone (n = 9), similar to what was observed for all event types. (D) Average event frequency sharply increased with the initial addition of mannitol, then returned to near [K+]o levels (n = 8), again similar to what was observed for all events pooled together. (E) Frequency of SICs was not affected overall by addition of mannitol (n = 9). (F) Although there was a slight increase in SIC frequency when mannitol was first applied, this change was not statistically significant (n = 8). (G) Similar to (A), cumulative probability distribution of instantaneous frequency (calculated from inter-event intervals) revealed a greater frequency of mixed events in mannitol compared to [K+]o. (n = 1908 events). (H) For SICs, a rightward shift in cumulative probability distribution of instantaneous frequency was not significant, likely due to the lower prevalence of these events overall (n = 48 events). (I) Events with rise time >10 ms occur with the greatest frequency during the first mannitol application (n = 9), likely due to “bleeding in” of synaptic events into this pool. (J) Frequency of events >20 ms did not increase during mannitol application but instead increased during the mannitol wash period compared to the first [K+]o application (n = 9). (K) Events with rise time >30 ms follow a similar trend as 20 ms events but with an even more pronounced increase during the mannitol wash period (n = 9). (L) Events with rise time >50 ms followed the same trends as 20 and 30 ms events, but were too infrequent overall to draw significant conclusions (n = 9). *p < 0.05 and ***p < 0.001.
FIGURE 5
FIGURE 5
Amplitude of all events and SICs, but not mEPSCs, decrease with addition of mannitol. (A) Events occurring across all 20 min in [K+]o had higher amplitudes on average compared to events occurring in [K+]o + mannitol (n = 9). (B) Amplitudes increased sharply during the mannitol wash period following the first mannitol application (n = 8). (C) Mannitol had no effect on mEPSC amplitude when combining [K+]o only and + mannitol periods (n = 9) or (D) when comparing among individual 10 min recording intervals (n = 8). (E) Amplitude of SICs was significantly diminished in mannitol compared to [K+]o alone (n = 8). (F) Amplitude of SICs was significantly reduced during the first application of mannitol, but then increased back to [K+]o levels during the mannitol wash period. The second application of mannitol once again significantly reduced SIC amplitude (n = 7). (G) In the cumulative probability distribution, the leftward shift for events in mannitol reflects a reduced amplitude overall compared to events in [K+]o (n = 1962 events). (H) Likewise, cumulative probability analysis for SICs revealed lower amplitudes in the + mannitol condition compared to [K+]o alone (n = 60 events). *p < 0.05, **p < 0.01, and ***p < 0.001.
FIGURE 6
FIGURE 6
Rise times of mEPSCs and SICs are differentially affected by mannitol. (A) Overall, event rise times were slightly but not significantly faster in the presence of mannitol compared to [K+]o alone (n = 9). (B) For individual 10-min applications, events occurring during the mannitol wash period were much slower than events during the preceding mannitol application period or the initial period in [K+]o (n = 8). (C) Mixed AMPA/NMDA receptor mEPSCs were significantly slower in [K+]o + mannitol compared to those occurring in [K+]o alone (n = 9). (D) mEPSCs occurring during both mannitol applications were slower than events occurring during the initial [K+]o application (n = 8). (E) Unlike mEPSCs, SICs had faster rise times during periods of mannitol exposure compared to periods in [K+]o (n = 8). (F) The slowest SICs occurred during the mannitol wash period when cells were swelling the most, with faster events occurring during both mannitol applications (n = 7). (G) Cumulative probability showed a leftward shift for event rise times in mannitol, suggesting that increasing the osmolarity of [K+]o ACSF results in faster rise times overall (n = 1962 events). (H) Cumulative probability analysis revealed no effect on SIC rise times (n = 60 events). *p < 0.05, **p < 0.01, and ***p < 0.001.
FIGURE 7
FIGURE 7
Application of hyperosmolar [K+]o triggers changes in neuron membrane excitability despite block of AMPARs. (A) Representative recording of a neuron voltage-clamped at –70 mV in Mg2+-free ACSF + 1 μM TTX and 10 μM NBQX. Gaps in recordings coincide with periodic measurement membrane potential and holding current in order to assess patch-clamp quality between alternating 10-min ACSF treatments: control ACSF, [K+]o, [K+]o + mannitol, mannitol wash, and [K+]o + mannitol. (B) Section of recording showing 10-min mannitol wash and 10-min second application of [K+]o + mannitol. Inset shows the value of the holding current measured at the end of each application period (n = 13). (C) An ∼ 4-min section of the recording in (B), showing events during the mannitol wash period in [K+]o. (D) An ∼ 4-min section of the recording in (B), showing events during the second [K+]o + mannitol application. Note the large SICs during the mannitol wash period compared to the smaller mEPSCs present during the second [K+]o + mannitol co-application. (E) A comparison of averaged SIC traces from the first application of [K+]o with the first [K+]o + mannitol co-application (left) and between the mannitol wash and the second [K+]o + mannitol co-application (right). *p < 0.05.
FIGURE 8
FIGURE 8
Increased frequency of all events and NMDA receptor mEPSCs during mannitol application, while SIC frequency increases upon mannitol removal. Average frequency of events was calculated for the combined 20-min applications of each solution, as well as for individual 10-min bins. (A) Average frequency of all event types was higher in the presence of [K+]o + mannitol than in [K+]o alone (n = 13). (B) Average event frequency increased during both 10 min applications of mannitol as well as the mannitol wash period (n = 13). (C) Average frequency of mEPSCs was higher during co-application of [K+]o + mannitol than during application of [K+]o alone (n = 13). (D) Average frequency of mEPSCs increased during the second co-application of [K+]o + mannitol relative to the initial application of [K+]o alone, with non-significant fluctuations in frequency during the first [K+]o + mannitol co-application and mannitol wash periods (n = 13). (E) There was no significant difference between the frequency of SICs during [K+]o + mannitol co-application vs. [K+]o alone (n = 13). (F) Frequency of SICs significantly increased during the mannitol wash period relative to both the initial [K+]o application and the first [K+]o + mannitol co-application (n = 13). (G) Cumulative probability distribution of instantaneous frequency (calculated from inter-event intervals) showed a greater frequency of events in [K+]o + mannitol compared to [K+]o alone (n = 208 events). (H) Cumulative probability distribution of instantaneous frequency showed no difference in SIC frequency across experimental conditions (n = 48 events). *p < 0.05, **p < 0.01, and ***p < 0.001.
FIGURE 9
FIGURE 9
Amplitude of all NMDA receptor events and SIC decreases with the addition of mannitol. (A) Average amplitude of all NMDAR-mediated events occurring during co-application of [K+]o + mannitol was lower compared to [K+]o alone (n = 13). (B) Average amplitude of all events was significantly lower in the presence of mannitol than during the mannitol wash period (n = 13). (C) There was no significant change in amplitude of mEPSCs with and without mannitol across all time periods (n = 13) or (D) between separate 10-min time bins (n = 11). (E) Average amplitude of SICs occurring during co-application of [K+]o + mannitol was lower than in [K+]o alone (n = 11). (F) Amplitude of SICs was not significantly different in any specific 10 min recording stretch (n = 4). The number of statistically usable cells was reduced due to the paucity of SICs in the + mannitol condition, when the extracellular volume expands. (G) Cumulative probability analysis reflected the reduced amplitude of all events during co-application of [K+]o + mannitol when compared to application of [K+]o alone (n = 234 events). (H) Cumulative probability analysis failed to return any significant differences between SICs in the presence of [K+]o + mannitol vs. [K+]o alone (n = 60 events). *p < 0.05 and **p < 0.01.
FIGURE 10
FIGURE 10
Rise times of all NMDA receptor currents and SICs, but not mEPSCs, become faster in mannitol. (A) Rise times for all NMDAR events were significantly faster during co-application of [K+]o + mannitol compared to [K+]o alone (n = 13). (B) Rise times for all NMDAR events were considerably slower during the mannitol wash period compared to either 10 min period in + mannitol (n = 13). (C) There were no significant differences in the rise times for NMDAR mEPSCs during [K+]o application with and without mannitol (n = 13). (D) There was no significant difference in rise times of NMDAR mEPSCs when analyzed in separate 10-min time bins (n = 11). (E) Rise times for SICs were significantly faster during co-application of [K+]o + mannitol than during [K+]o application alone (n = 11). (F) Rise times for SICs were not significantly different when compared across individual 10 min recording periods (n = 4). The number of statistically usable cells was reduced due to the scarcity of SICs occurring in the + mannitol condition. (G) Cumulative probability analysis failed to return any significant difference in rise times of all NMDAR events in [K+]o vs. [K+]o + mannitol (n = 234 events). (H) Cumulative probability revealed a significant leftward shift toward faster rise times for SICs in mannitol, suggesting that dilating the extracellular space sped up the rate of glutamate diffusion in the ECS (n = 60 events). *p < 0.05, **p < 0.01, and ***p < 0.001.
FIGURE 11
FIGURE 11
Addition of DL-AP5 attenuates volume-related effects on neuronal excitability. (A) Generally, the amount of holding current to maintain voltage-clamp at –70 mV was reduced in [K+]o + mannitol compared to [K+]o alone in all experiments. Holding currents for mixed AMPA + NMDA receptor experiments (blue, n = 9) and those isolating NMDA receptor currents (+NBQX) (green, n = 13) appeared remarkably similar and had no points during which they were significantly different. Holding currents recorded during the NMDA receptor inhibition experiments (+NBQX/+DL-AP5) were less negative overall and were significantly less negative following the second [K+]o + mannitol co-application period (yellow, n = 8). (B) Comparison of resting membrane potentials for the NMDA receptor isolation and NMDA receptor inhibition experiments. Shifts in resting membrane potential indicated that cells became depolarized relative to baseline during application of [K+]o, while co-application of [K+]o + mannitol triggered slight hyperpolarizing shifts. Resting membrane potentials recorded during the NMDAR inhibition experiments (yellow, n = 8) indicated significantly less depolarization compared to the NMDAR isolation experiments following the initial application of [K+]o alone, the mannitol wash period, and the second co-application of [K+]o + mannitol (green, n = 13). *p < 0.05 and ***p < 0.001.
FIGURE 12
FIGURE 12
DL-AP5 substantially attenuates NMDA receptor currents during application of [K+]o. Approximately 1-min section of recording taken from the mannitol wash period for an experiment conducted in NBQX without DL-AP5 (A) compared to the mannitol wash period with 50 μM DL-AP5 (B). Note the number of large SIC-like events in the absence, but not the presence, of DL-AP5. (C) Frequency of all NMDA receptor events was significantly lower in DL-AP5 (yellow, n = 8) compared to + NBQX alone (green, n = 13) during [K+]o application both with and without mannitol. (D) When separating events into individual 10-min recording periods, NMDA receptor events were significantly reduced during the mannitol wash period and second [K+]o + mannitol application period. (E) DL-AP5 also significantly inhibited the occurrence of SICs either with or without mannitol. (F) When grouping frequencies of SICs into 10-min time bins, DL-AP5 significantly inhibited SICs during the mannitol wash period and second [K+]o + mannitol co-application period. SICs were blocked completely during the second [K+]o + mannitol co-application period. *p < 0.05, **p < 0.01, and ***p < 0.001.

References

    1. Abdullaev I. F., Rudkouskaya A., Schools G. P., Kimelberg H. K., Mongin A. A. (2006). Pharmacological comparison of swelling-activated excitatory amino acid release and Cl- currents in cultured rat astrocytes. J. Physiol. 572 677–689. 10.1113/jphysiol.2005.103820 - DOI - PMC - PubMed
    1. Agnati L. F., Zoli M., Strömberg I., Fuxe K. (1995). Intercellular communication in the brain: wiring versus volume transmission. Neuroscience 69 711–726. - PubMed
    1. Angulo M. C., Kozlov A. S., Charpak S., Audinat E. (2004). Glutamate released from glial cells synchronizes neuronal activity in the hippocampus. J. Neurosci. 24 6920–6927. - PMC - PubMed
    1. Azouz R., Alroy G., Yaari Y. (1997). Modulation of endogenous firing patterns by osmolarity in rat hippocampal neurones. J. Physiol. 502(Pt 1), 175–187. 10.1111/j.1469-7793.1997.175bl.x - DOI - PMC - PubMed
    1. Bach-y-Rita P. (1993). Neurotransmission in the brain by diffusion through the extracellular fluid: a review. Neuroreport 4 343–350. - PubMed