. 2022 Jul 20;3(7):100971.
doi: 10.1016/j.xcrp.2022.100971. Epub 2022 Jul 11.

Insights into the structural stability of major groove RNA triplexes by WAXS-guided MD simulations

Affiliations

Insights into the structural stability of major groove RNA triplexes by WAXS-guided MD simulations

Yen-Lin Chen et al. Cell Rep Phys Sci. .

Abstract

RNA triple helices are commonly observed tertiary motifs that are associated with critical biological functions, including signal transduction. Because the recognition of their biological importance is relatively recent, their full range of structural properties has not yet been elucidated. The integration of solution wide-angle X-ray scattering (WAXS) with molecular dynamics (MD) simulations, described here, provides a new way to capture the structures of major-groove RNA triplexes that evade crystallographic characterization. This method yields excellent agreement between measured and computed WAXS profiles and allows for an atomically detailed visualization of these motifs. Using correlation maps, the relationship between well-defined features in the scattering profiles and real space characteristics of RNA molecules is defined, including the subtle conformational variations in the double-stranded RNA upon the incorporation of a third strand by base triples. This readily applicable approach has the potential to provide insight into interactions that stabilize RNA tertiary structure that enables function.


Conflict of interest statement

DECLARATION OF INTERESTS The authors declare no competing interests.

Figures

Figure 1.
Figure 1.. RNA systems under study and their WAXS profiles
(A) Schematics showing the RNA duplex and triplex motifs designed for this work. The Short-Tetraloop Duplex (ST-DPX) has a UUCG tetraloop and a 17-Watson-Crick base-paired stem with one TFO12 binding domain. A custom designed 12 nucleotide long TFO is added to yield multiple base triples, stabilized by Hoogsteen base pairing (dots) resulting in an RNA triplex: ST-TPX. We doubled the TFO12 binding domain to create a triplex-forming partner for the Long-Tetraloop Duplex (LT-DPX). When bound, the duplex-TFO24 pair comprises the longer RNA triplex: LT-TPX. See main text for a more detailed description. (B and C) Solution X-ray scattering profiles of the different motifs and salts studied: ST-TPX/LT-TPX in 5 mM MgCl2 (blue), ST-TPX/LT-TPX in 200 mM NaCl (green), and ST-DPX/LT-DPX in 200 mM NaCl (purple).
Figure 2.
Figure 2.. The flowchart of WAXS data-driven MD approach and the method of computing WAXS profiles from simulations
(A) Two feedback loops are considered, and the path through the search is determined by the agreement (or lack of agreement) with WAXS profiles. If agreement is not achieved in the RT pool, the Sample and Select (SaS) approach is incorporated to enhance the sampling. The second feedback loop is triggered when the customized metric in Equation 1 of all the sampled conformations exceeds the threshold. After multiple iterations, the data-driven strategy generates a conformation pool satisfying the experimental WAXS data, assessed by the value of our customized metric. (B) Illustration of the RNA + water + ion system and water + ion system used in the WAXS data-driven MD simulations. The molecular envelope constructed from a 3D probability density isosurface 12 Å from the helix surface to encompass the solvent/ion shell is depicted by mesh. The scattering intensity of water + ion system was computed by applying the same envelope construct.
Figure 3.
Figure 3.. Illustration of the WAXS data-driven approach against a known triplex (PDB: 6SVS)
The crystal structure serves to compute the WAXS profile that is used to drive an ideal triplex model. (A) WAXS profiles of the crystal structure (green), initial model (black) and best fit models after WAXS-driven MD simulations with (blue) and without (purple) protonation of CGC triplet. (B–D) The comparison of structures overlaid to the 6SVS structure. The RMSD (Å) and the χ2 metric for each condition are shown.
Figure 4.
Figure 4.. Illustration of WAXS data-driven approach of ST-TPX in buffered solution of 200 mM NaCl
(A) The experimental data that are the target of the WAXS-driven MD simulations are shown as green circles. The red curve is the ensemble average of the unbiased simulation results when the initial model is taken as the starting structure. The cyan curve is the ensemble average of the unbiased simulation when the initial structure is the best fit model. Neither of them represents a single structure, rather both represent ensemble averages. The progression of scattering profiles during the data-driven simulation is shown in gray, denoted as transition in the figure and the result of the data-driven simulation is shown in black. The WAXS evolution of the remaining constructs is shown in Figure S5 (B) The time variation of χ2, as well as the overall RMSD change are shown, using the initial frame as reference. The distance from the initial state is given in Ångstroms. The asymptotic amplitude and turning point of the two variables respectively used as a qualitative measure of the convergence of the fits to a 3D model. Note that this convergence is not a rigorous statistical measure. (C) The time evolution of the RMSD at the level of individual residues is shown, using the initial structure as the reference. The color bar provides the distance from initial conformation. Note the relatively higher structural deviations displayed near residues 19–22 and 41–52 residues, which correspond to the tetraloop and TFO of ST-TPX, respectively.
Figure 5.
Figure 5.. Correlation analysis of measured WAXS profiles with structures sampled by MD simulations of ST-TPX in 200 mM NaCl
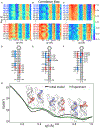
(A–C) These partial correlation maps, extracted from the full correlation map (Figure S7), display the distance between pairs of phosphate atoms associated with the indicated residues, computed from MD structures (Equation 4), against the normalized deviation of the computed WAXS profile from the experimental measurement (Equation 3). These maps identify structural regions that potentially contribute to deviations in specific q regions. Regions with the highest deviations in a given q range, e.g., the residue pairs with high correlations (∣ρ∣ > 0.5 and five largest values), are highlighted within black rectangles. We focus here on structural regions that create significant deviations in profiles near q ≈ 0.35Å−1 (A), q ≈ 0.65Å−1 (B), and q ≈ 0.85Å−1 (C). (D–F) The regions identified in (A–C) are mapped onto the secondary structure and real space models of the RNAs. Residue pairs that contribute to changing the scattering profile near q ≈ 0.35Å−1 (D), q ≈ 0.65Å−1 (E), and q ≈ 0.85Å−1 (F), respectively, are highlighted in color. (G) connects distinct structural variation with changes in the scattering profiles. A comparable analysis applied to LT-TPX is provided in Figure S9.
Figure 6.
Figure 6.. Structural analysis of ST-DPX/TPX under different conditions
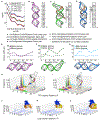
(A) The experimental scattering profiles (circles), computed WAXS profiles from standard MD simulations of model structure (red) and WAXS-driven simulations (black) are pictured for three constructs. (B–D) From the conformational ensembles generated by WAXS-driven MD, we show the most representative structure of (B) ST-DPX in NaCl, (C) in NaCl, and (D) ST-TPX in MgCl2, and alongside each snapshot, we report the corresponding secondary structures using Leontis-Westhof notation, and dashed line annotation denotes weak hydrogen bonding interactions for other non-canonical base pair formations. For equilibrium properties we consider the whole ensemble. The ensemble was generated from conformations that fall below the threshold χ2 < 2 value. (E–G) Average groove width (GW) of the duplex part of structures reveals a dependence on salt: (E) ST-DPX in NaCl, (F) ST-TPX in NaCl, and (G) ST-TPX in MgCl2, respectively. (H and I) The contact analysis measuring the relative positions of the TFO and duplex of ST-TPX reveals detailed structural information about TFO binding in (H) NaCl and (I) MgCl2. (J–L) The contact analysis between tetraloop and duplex of (J) ST-DPX in NaCl and ST-TPX in (K) NaCl, and (L) MgCl2 reveals an unexpected salt dependence of the loop within triplex structures.
Figure 7.
Figure 7.. Structural analysis of LT-DPX/TPX
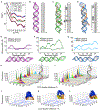
(A) The experimental scattering profiles (circle), computed WAXS profiles from standard MD simulations of model structure (red) and WAXS-driven simulations (black) are pictured for these longer constructs. (B–D) As in Figure 6, we show the most representative structure of (B) LT-DPX in NaCl and LT-TPX in (C) NaCl and (D) MgCl2, and, alongside each snapshot, we report the corresponding secondary structures using the same nomenclature as Figure 6. For equilibrium properties we consider the whole ensemble. The ensemble was generated from conformations that fall below the threshold χ2 < 2 value. (E–G) Average groove width (GW) of the duplex part of structures in different salt conditions reveals a more distinct pattern than observed in the shorter complex for: (E) LT-DPX in NaCl, (F) LT-TPX in NaCl, and (G) LT-TPX in MgCl2, respectively. (H and I) The contact analysis between TFO and duplex of LT-TPX in (H) NaCl and (I) MgCl2, and (J–L) between tetra-loop and duplex of (J) LT-DPX in NaCl and LT-TPX in (K) NaCl and (L) MgCl2 show smaller variations relative to the shorter construct in NaCl.
Figure 8.
Figure 8.. Counterion density profiles from simulations
(A–F) (A) ST-DPX in NaCl, ST-TPX in (B) NaCl and (C) MgCl2, (D) LT-DPX in NaCl, LT-TPX in (E) NaCl and (F) MgCl2, respectively. Increasing ion density is indicated with color: white (low) to red to green (high).

Similar articles

Cited by

References

    1. Crooke ST, Witztum JL, Bennett CF, and Baker BF (2018). Rna-targeted therapeutics. Cell Metabol. 27, 714–739. 10.1016/j.cmet.2018.03.004. - DOI - PubMed
    1. Pardi N, Hogan MJ, Porter FW, and Weissman D (2018). mRNA vaccines — a new era in vaccinology. Nat. Rev. Drug Discov 17, 261–279. 10.1038/nrd.2017.243. - DOI - PMC - PubMed
    1. Butcher SE, and Pyle AM (2011). The molecular interactions that stabilize RNA tertiary structure: RNA motifs, patterns, and networks.Accounts Chem. Res 44, 1302–1311. 10.1021/ar200098t. - DOI - PubMed
    1. Abu Almakarem AS, Petrov AI, Stombaugh J, Zirbel CL, and Leontis NB (2011). Comprehensive survey and geometric classification of base triples in RNA structures. Nucleic Acids Res. 40, 1407–1423. 10.1093/nar/gkr810. - DOI - PMC - PubMed
    1. Conrad NK (2013). The emerging role of triple helices in RNA biology. Wiley Interdisciplinary Reviews: RNA 5, 15–29. 10.1002/wrna.1194. - DOI - PMC - PubMed

LinkOut - more resources