. 2022 Jul 22:12:927706.
doi: 10.3389/fonc.2022.927706. eCollection 2022.

A novel cuproptosis-related prognostic lncRNA signature and lncRNA MIR31HG/miR-193a-3p/TNFRSF21 regulatory axis in lung adenocarcinoma

Affiliations

A novel cuproptosis-related prognostic lncRNA signature and lncRNA MIR31HG/miR-193a-3p/TNFRSF21 regulatory axis in lung adenocarcinoma

Xiaocong Mo et al. Front Oncol. .

Abstract

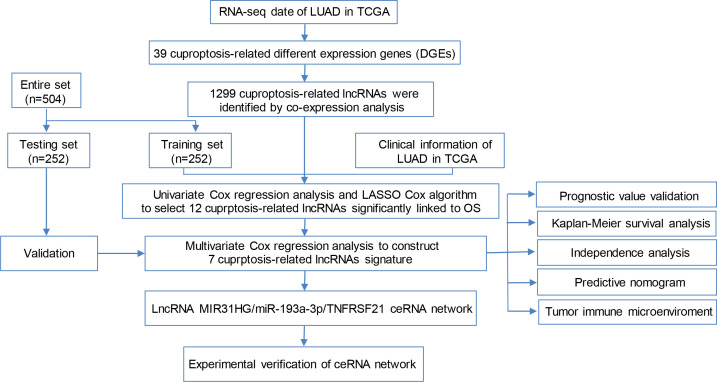
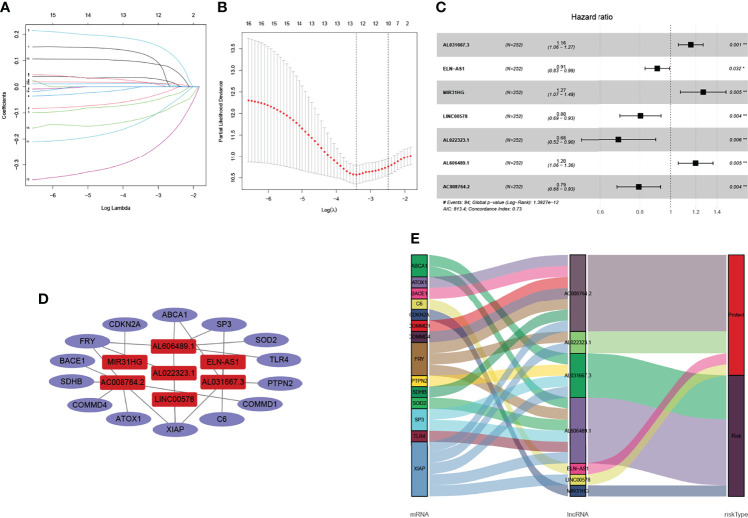
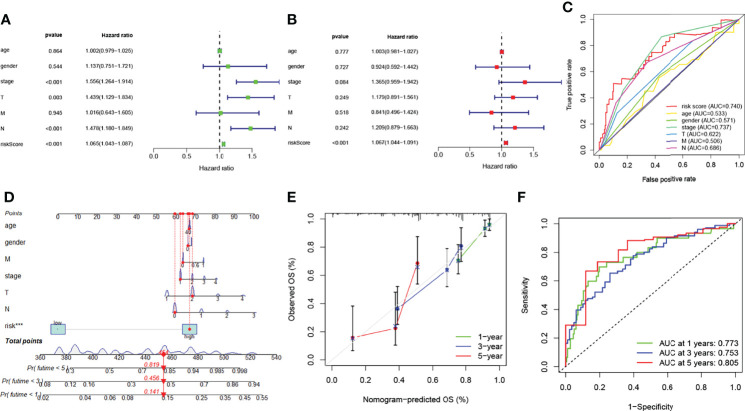
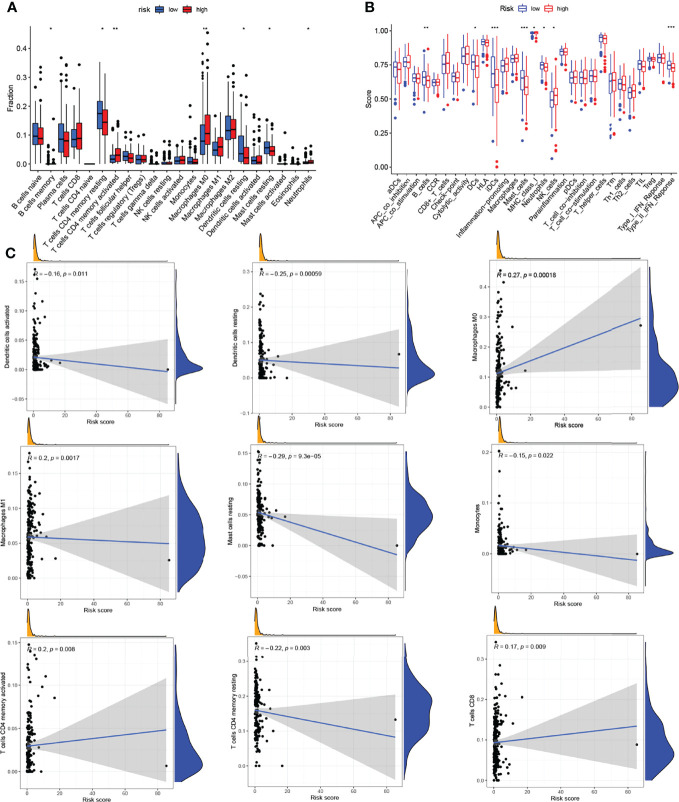
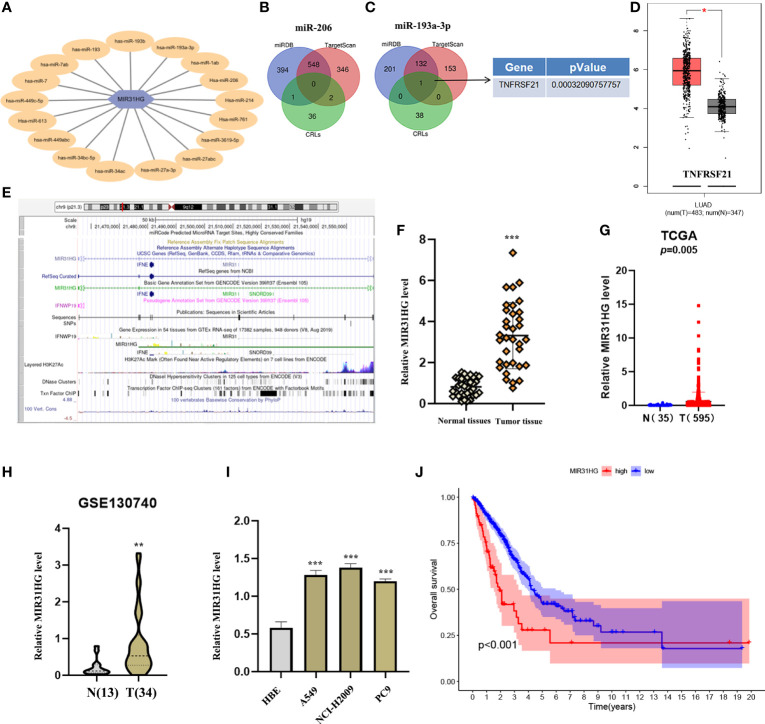
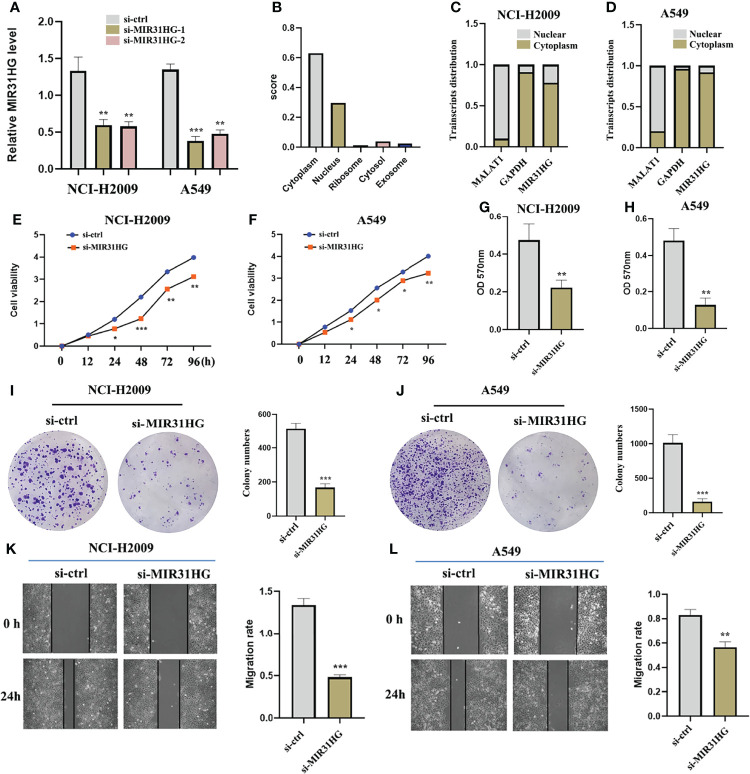
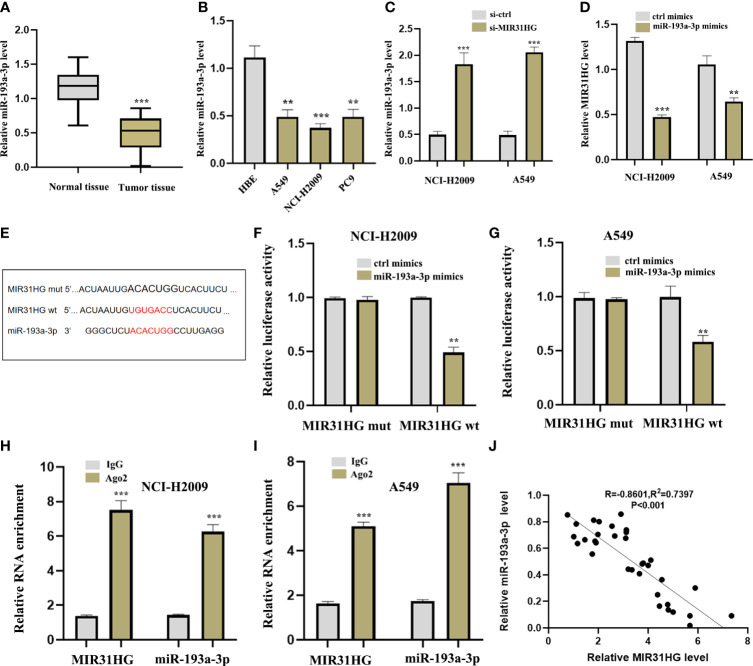
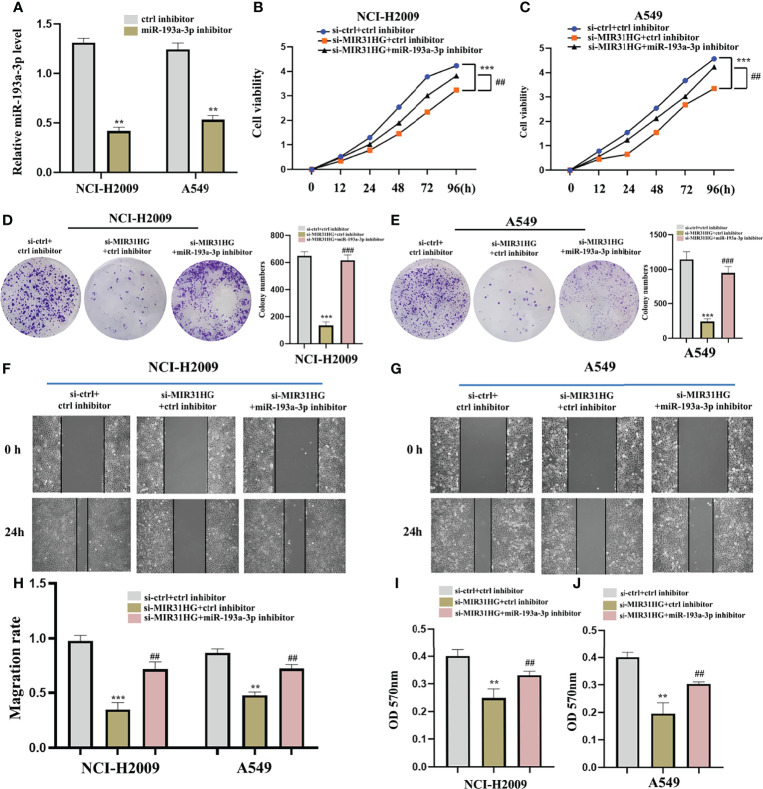
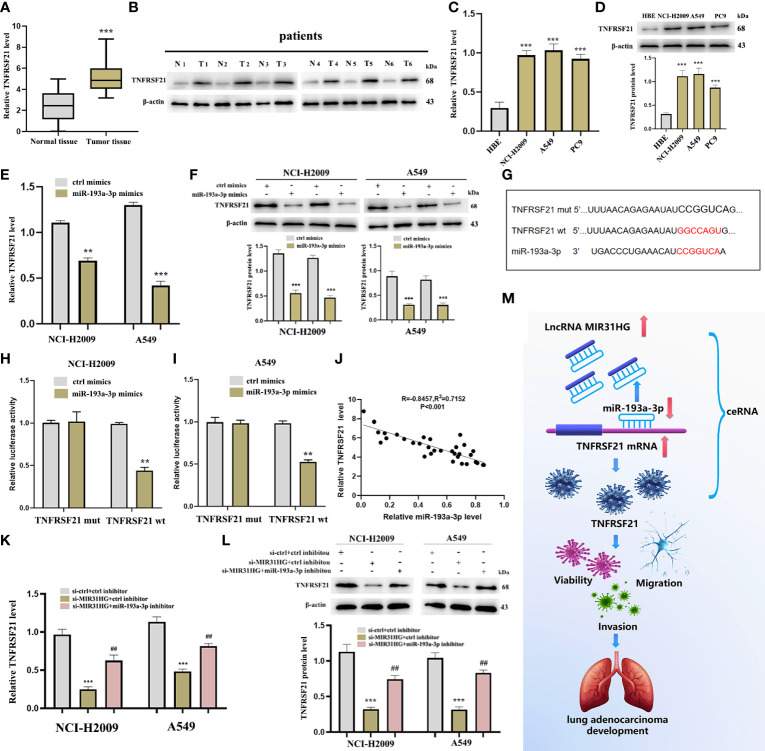
Lung adenocarcinoma (LUAD) remains the most common subtype of lung malignancy. Cuproptosis is a newly identified cell death which could regulate tumor cell proliferation and progression. Long non-coding RNAs (lncRNAs) are key molecules and potential biomarkers for diagnosing and treating various diseases. However, the effects of cuproptosis-related lncRNAs on LUAD are still unclear. In our study, 7 cuproptosis-related lncRNAs were selected to establish a prognostic model using univariate Cox regression analysis, LASSO algorithm, and multivariate analysis. Furthermore, we evaluated AC008764.2, AL022323.1, ELN-AS1, and LINC00578, which were identified as protective lncRNAs, while AL031667.3, AL606489.1, and MIR31HG were identified as risk lncRNAs. The risk score calculated by the prognostic model proved to be an effective independent factor compared with other clinical features by Cox regression analyses [univariate analysis: hazard ratio (HR) = 1.065, 95% confidence interval (CI) = 1.043-1.087, P < 0.001; multivariate analysis: HR = 1.067, 95% CI = 1.044-1.091, P < 0.001]. In addition, both analyses (ROC and nomogram) were used to corroborate the accuracy and reliability of this signature. The correlation between cuproptosis-related lncRNAs and immune microenvironment was elucidated, where 7 immune cells and 8 immune-correlated pathways were found to be differentially expressed between two risk groups. Furthermore, our results also identified and verified the ceRNA of cuproptosis-related lncRNA MIR31HG/miR-193a-3p/TNFRSF21 regulatory axis using bioinformatics tools. MIR31HG was highly expressed in LUAD specimens and some LUAD cell lines. Inhibition of MIR31HG clearly reduced the proliferation, migration, and invasion of the LUAD cells. MIR31HG showed oncogenic features via sponging miR-193a-3p and tended to positively regulate TNFRSF21 expression. In a word, lncRNA MIR31HG acts as an oncogene in LUAD by targeting miR-193a-3p to modulate TNFRSF21, which may be beneficial to the gene therapy of LUAD.

Keywords: MIR31HG; TNFRSF21; cuproptosis; lung adenocarcinoma; miR-193a-3p.


Conflict of interest statement

The authors declare that the research was conducted in the absence of any commercial or financial relationships that could be construed as a potential conflict of interest.

Figures

Figure 1
Figure 1
Flow chart of the study.
Figure 2
Figure 2
Identification of the expression and functional enrichment of cuproptosis-related genes in lung adenocarcinoma (LUAD). (A) Heat map reflecting the distribution of the 39 cuproptosis-related genes in LUAD and normal tissues. Red: upregulation; green: downregulation. (B) PPI network showing the interaction among 39 cuproptosis-related genes. (C) GO enrichment of cuproptosis-related genes. (D) Enriched KEGG pathways of cuproptosis-related genes. PPI, protein–protein interaction network; GO, Gene Ontology; KEGG, Kyoto Encyclopedia of Genes and Genomes. *p < 0.05; **p < 0.01; ***p < 0.001.
Figure 3
Figure 3
Identification of cuproptosis-related lncRNAs and co-expression network construction. (A, B) LASSO Cox algorithm was employed to establish a prognosis model. The color depth of the nodes depicted the corrected P-value of ontologies. The size of the nodes depicted the number of genes that are engaged in the ontologies. (C) A total of 7 lncRNAs were selected through subsequent multivariate analysis to construct the risk model. (D) Co-expression structure between cuproptosis-related lncRNAs and genes. (E) Sankey diagram was used to visualize the co-expression network.
Figure 4
Figure 4
Construction of the predictive risk model in lung adenocarcinoma (LUAD) patients. (A, B) The risk score was calculated by 7 cuproptosis-related lncRNAs in the two cohorts (training and validation), and two risk groups were formed in LUAD patients. Green, low risk; red, high risk. (C, D) Survival status of LUAD patients. Green: survival; red: death. (E, F) The heat map indicates the expression degrees of 7 cuproptosis-related lncRNAs. (G, H) The Kaplan–Meier analysis revealed the overall survival in the two risk groups.
Figure 5
Figure 5
Prognosis value of model lncRNAs in lung adenocarcinoma (LUAD). (A) Univariate analysis of various clinical features and risk score. (B) Multivariate analysis of various clinical features and risk score. (C) ROC curves of the risk model (risk score: AUC = 0.740). (D) A nomogram was performed to predict the 1-, 3-, and 5-year survival. (E) Calibration curve of the nomogram model. (F) The results of ROC curves in predicting the LUAD survival rates. ROC, receiver operator characteristic; AUC, area under the curve.
Figure 6
Figure 6
Analysis of the immune activity in different groups. (A) Comparison of various types of immune cells. (B) Comparison of various immune-correlated pathways. (C) Relationship between the infiltration of immune cells and the risk model. * p < 0.05; ** p < 0.01; *** p < 0.001.
Figure 7
Figure 7
Construction of a regulatory axis of lncRNA–miRNA–mRNA. (A) lncRNA MIR31HG bound to 17 miRNAs. (B, C) Venn diagram identifying the downstream targets in miR-206 and miR-193a-3p, respectively, from miRDB and TargetScan databases. (D) The expression of TNFRSF21 was investigated by GEPIA database. (E) Lots of H3K27Ac marks existed in the promoter region of MIR31HG from the UCSC web server. (F, G) MIR31HG expression in lung adenocarcinoma (LUAD) specimens relative to normal tissues as detected by qRT-PCR and The Cancer Genome Atlas cohort. (H) MIR31HG expression in LUAD specimens relative to normal tissues as detected by GSE130740 cohort. (I) MIR31HG expression in different LUAD cell lines (A549, NCI-H2009, and PC9) compared with bronchial epithelioid cell (HBE) was estimated by qRT-PCR. (J) The overall survival time of patients with LUAD was measured by Kaplan–Meier analysis. * p < 0.05; ** p < 0.01; *** p < 0.001.
Figure 8
Figure 8
The effect of lncRNA MIR31HG on lung adenocarcinoma LUAD cell viability, migration, and invasion. (A) The efficiency of MIR31HG knockdown (si-MIR31HG-1 and si-MIR31HG-2) was assessed by qRT-PCR. (B) The subcellular localization of MIR31HG was predicted by “LncLocator”. (C, D) The relative lncRNA MIR31HG expression level both in the cytoplasm and the nucleus of the NCI-H2009 and A549 cell lines were simultaneously measured by qRT-PCR. (E, F) The proliferation of NCI-H2009 and A549 cells was detected by CCK-8 assays. (G, H) The invasion of NCI-H2009 and A549 cells was investigated by transwell assays. (I, J) The clone capacity of NCI-H2009 and A549 cells was identified by colony formation assay. (K, L) The migration of NCI-H2009 and A549 cells was determined by wound healing assays. * p < 0.05; ** p < 0.01; *** p < 0.001.
Figure 9
Figure 9
lncRNA MIR31HG acted as ceRNA for miR-193a-3p. (A) miR-193a-3p expression in lung adenocarcinoma (LUAD) specimens compared with normal tissues as detected by qRT-PCR. *** p < 0.001 vs. normal tissue. (B) miR-193a-3p expression in different LUAD cell lines (A549, NCI-H2009, and PC9) relative to bronchial epithelioid cell (HBE) was estimated by qRT-PCR. (C) miR-193a-3p expression following si-MIR31HG transfection was assessed by qRT-PCR. (D) MIR31HG expression following miR-193a-3p overexpression was measured by qRT-PCR. (E) Schematic diagram of the predicted interacting sites. (F, G) The relationship between MIR31HG and miR-193a-3p in NCI-H2009 and A549 cells was performed by dual-luciferase reporter assay. (H, I) The immunoprecipitation of MIR31HG and miR-193a-3p in NCI-H2009 and A549 cells was determined by RNA immunoprecipitation experiment. (J) The relationship between MIR31HG and miR-193a-3p was investigated by Pearson’s analysis. ** p < 0.01; *** p < 0.001.
Figure 10
Figure 10
miR-193a-3p reversed the lncRNA MIR31HG knockdown effects on lung adenocarcinoma cells. (A) The expression of miR-193a-3p was investigated by qRT-PCR. (B, C) The proliferation of NCI-H2009 and A549 cells were detected by CCK-8 assays. (D, E) The clone capacity of NCI-H2009 and A549 cells was identified by colony formation assay. (F-H) The migration of NCI-H2009 and A549 cells was determined by wound healing assays. (I, J) The invasion of NCI-H2009 and A549 cells was investigated by transwell assays. ** p < 0.01; *** p < 0.001 vs. ctrl inhibitor, ## p < 0.01; ### p < 0.01 vs. si-MIR31HG+miR-193a-3p inhibitor.
Figure 11
Figure 11
TNFRSF21 was a downstream target of miR-193a-3 and lncRNA MIR31HG sponged miR-193a-3p to upregulate TNFRSF21. (A) TNFRSF21 expression in lung adenocarcinoma (LUAD) specimens compared with normal tissues as detected by qRT-PCR. *** p < 0.001 vs. normal tissue. (B) TNFRSF21 expression in 6 LUAD patients relative to normal tissues as detected by western blot. (C, D) TNFRSF21 expression in different LUAD cell lines (A549, NCI-H2009, and PC9) relative to bronchial epithelioid cell (HBE) was estimated by qRT-PCR or western blot. *** p < 0.001 vs. HBE. (E, F) TNFRSF21 expression following miR-193a-3p overexpression was assessed by qRT-PCR or western blot. ** p < 0.01; *** p < 0.001 vs. ctrl mimics. (G) Schematic diagram of the predicted interacting sites. (H, I) The relationship between TNFRSF21 and miR-193a-3p in NCI-H2009 and A549 cells was performed by dual-luciferase reporter assay. ** p < 0.01 vs. ctrl mimics. (J) Relationship between TNFRSF21 and miR-193a-3p investigated by Pearson’s analysis. (K, L) TNFRSF21 expression following si-MIR31HG or si-MIR31HG + miR-193a-3p inhibitor was assessed by qRT-PCR or western blot. *** p < 0.001 vs. ctrl inhibitor; ## p < 0.01 vs. si-MIR31HG + miR-193a-3p inhibitor. (M) Schematic diagram of the mechanism of lncRNA MIR31HG/miR-193a-3/TNFRSF21 regulatory axis.

Similar articles

Cited by

References

    1. Kuhn E, Morbini P, Cancellieri A, Damiani S, Cavazza A, Comin CE. Adenocarcinoma classification: Patterns and prognosis. Pathologica (2018) 110(1):5–11. - PubMed
    1. Zhang Y, Fu F, Chen H. Management of ground-glass opacities in the lung cancer spectrum. Ann Thorac Surg (2020) 110(6):1796–804. doi: 10.1016/j.athoracsur.2020.04.094 - DOI - PubMed
    1. Dong S, Men W, Yang S, Xu S. Identification of lung adenocarcinoma biomarkers based on bioinformatic analysis and human samples. Oncol Rep (2020) 43(5):1437–50. doi: 10.3892/or.2020.7526 - DOI - PMC - PubMed
    1. Li Z, Ma G, Pan Y. Five circRNAs serve as potential diagnostic and prognostic biomarkers in lung adenocarcinoma. Clin Lab (2021) 67(8). doi: 10.7754/Clin.Lab.2020.200523 - DOI - PubMed
    1. Li Y, Gu J, Xu F, Zhu Q, Chen Y, Ge D, et al. . Molecular characterization, biological function, tumor microenvironment association and clinical significance of M6a regulators in lung adenocarcinoma. Brief Bioinform (2021) 22(4):bbaa225. doi: 10.1093/bib/bbaa225 - DOI - PubMed

LinkOut - more resources