

Linking Brain Age Gap to Mental and Physical Health in the Berlin Aging Study II
- PMID: 35936763
- PMCID: PMC9355695
- DOI: 10.3389/fnagi.2022.791222
Linking Brain Age Gap to Mental and Physical Health in the Berlin Aging Study II
Abstract
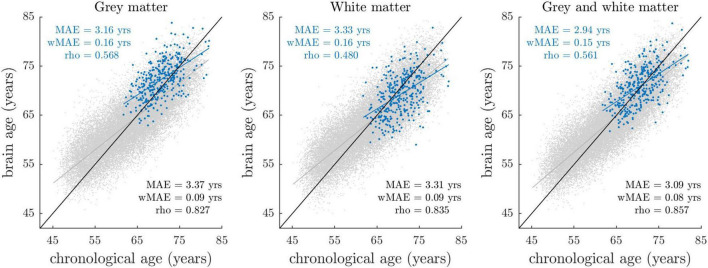
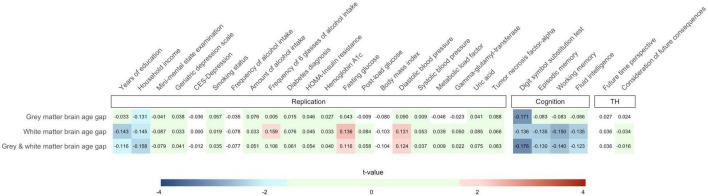
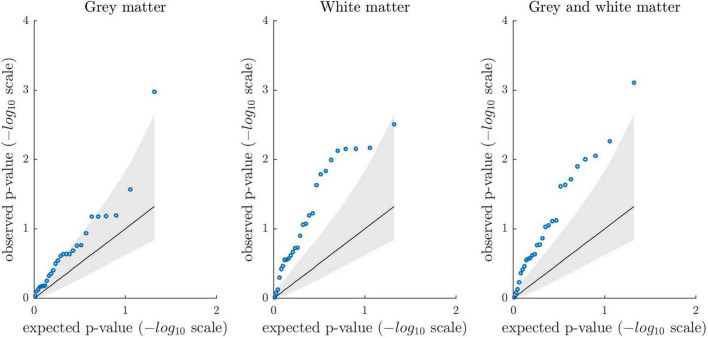
From a biological perspective, humans differ in the speed they age, and this may manifest in both mental and physical health disparities. The discrepancy between an individual's biological and chronological age of the brain ("brain age gap") can be assessed by applying machine learning techniques to Magnetic Resonance Imaging (MRI) data. Here, we examined the links between brain age gap and a broad range of cognitive, affective, socioeconomic, lifestyle, and physical health variables in up to 335 adults of the Berlin Aging Study II. Brain age gap was assessed using a validated prediction model that we previously trained on MRI scans of 32,634 UK Biobank individuals. Our statistical analyses revealed overall stronger evidence for a link between higher brain age gap and less favorable health characteristics than expected under the null hypothesis of no effect, with 80% of the tested associations showing hypothesis-consistent effect directions and 23% reaching nominal significance. The most compelling support was observed for a cluster covering both cognitive performance variables (episodic memory, working memory, fluid intelligence, digit symbol substitution test) and socioeconomic variables (years of education and household income). Furthermore, we observed higher brain age gap to be associated with heavy episodic drinking, higher blood pressure, and higher blood glucose. In sum, our results point toward multifaceted links between brain age gap and human health. Understanding differences in biological brain aging may therefore have broad implications for future informed interventions to preserve mental and physical health in old age.
Keywords: Berlin Aging Study II (BASE-II); aging; brain age gap; cognition; mental health.
Copyright © 2022 Jawinski, Markett, Drewelies, Düzel, Demuth, Steinhagen-Thiessen, Wagner, Gerstorf, Lindenberger, Gaser and Kühn.
Conflict of interest statement
The authors declare that the research was conducted in the absence of any commercial or financial relationships that could be construed as a potential conflict of interest.
Figures
Similar articles
-
Multimodal brain age estimates relate to Alzheimer disease biomarkers and cognition in early stages: a cross-sectional observational study.Elife. 2023 Jan 6;12:e81869. doi: 10.7554/eLife.81869. Elife. 2023. PMID: 36607335 Free PMC article.
-
Brain structure and connectivity mediate the association between lifestyle and cognition: The Maastricht Study.Brain Commun. 2024 May 16;6(3):fcae171. doi: 10.1093/braincomms/fcae171. eCollection 2024. Brain Commun. 2024. PMID: 38846531 Free PMC article.
-
Enrichment Effects on Adult Cognitive Development: Can the Functional Capacity of Older Adults Be Preserved and Enhanced?Psychol Sci Public Interest. 2008 Oct;9(1):1-65. doi: 10.1111/j.1539-6053.2009.01034.x. Epub 2008 Oct 1. Psychol Sci Public Interest. 2008. PMID: 26162004
-
Accelerated brain aging predicts impaired cognitive performance and greater disability in geriatric but not midlife adult depression.Transl Psychiatry. 2020 Sep 18;10(1):317. doi: 10.1038/s41398-020-01004-z. Transl Psychiatry. 2020. PMID: 32948749 Free PMC article.
-
Dietary glycation compounds - implications for human health.Crit Rev Toxicol. 2024 Sep;54(8):485-617. doi: 10.1080/10408444.2024.2362985. Epub 2024 Aug 16. Crit Rev Toxicol. 2024. PMID: 39150724
Cited by
-
There Are Multiple Clocks That Time Us: Cross-Sectional and Longitudinal Associations Among 14 Alternative Indicators of Age and Aging.J Gerontol A Biol Sci Med Sci. 2025 May 5;80(6):glae244. doi: 10.1093/gerona/glae244. J Gerontol A Biol Sci Med Sci. 2025. PMID: 39383103 Free PMC article.
-
Your Brain Doesn't Look a Day Past 70! Cross-Sectional Associations with Brain-Predicted Age in the Cognitively-Intact Oldest-Old.bioRxiv [Preprint]. 2025 May 30:2025.05.26.655855. doi: 10.1101/2025.05.26.655855. bioRxiv. 2025. PMID: 40501754 Free PMC article. Preprint.
-
Age Prediction Using Resting-State Functional MRI.Neuroinformatics. 2024 Apr;22(2):119-134. doi: 10.1007/s12021-024-09653-x. Epub 2024 Feb 11. Neuroinformatics. 2024. PMID: 38341830
-
Toward MR protocol-agnostic, unbiased brain age predicted from clinical-grade MRIs.Sci Rep. 2023 Nov 10;13(1):19570. doi: 10.1038/s41598-023-47021-y. Sci Rep. 2023. PMID: 37950024 Free PMC article.
-
Network Occlusion Sensitivity Analysis Identifies Regional Contributions to Brain Age Prediction.Hum Brain Mapp. 2025 Jun 1;46(8):e70239. doi: 10.1002/hbm.70239. Hum Brain Mapp. 2025. PMID: 40470724 Free PMC article.
References
Grants and funding
LinkOut - more resources
Full Text Sources
Miscellaneous