

Graph Properties of Mass-Difference Networks for Profiling and Discrimination in Untargeted Metabolomics
- PMID: 35936789
- PMCID: PMC9353772
- DOI: 10.3389/fmolb.2022.917911
Graph Properties of Mass-Difference Networks for Profiling and Discrimination in Untargeted Metabolomics
Abstract
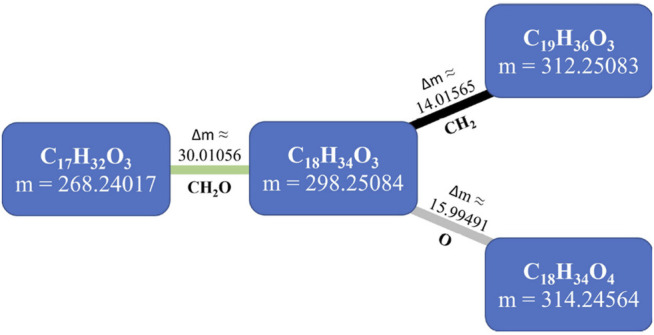
Untargeted metabolomics seeks to identify and quantify most metabolites in a biological system. In general, metabolomics results are represented by numerical matrices containing data that represent the intensities of the detected variables. These matrices are subsequently analyzed by methods that seek to extract significant biological information from the data. In mass spectrometry-based metabolomics, if mass is detected with sufficient accuracy, below 1 ppm, it is possible to derive mass-difference networks, which have spectral features as nodes and chemical changes as edges. These networks have previously been used as means to assist formula annotation and to rank the importance of chemical transformations. In this work, we propose a novel role for such networks in untargeted metabolomics data analysis: we demonstrate that their properties as graphs can also be used as signatures for metabolic profiling and class discrimination. For several benchmark examples, we computed six graph properties and we found that the degree profile was consistently the property that allowed for the best performance of several clustering and classification methods, reaching levels that are competitive with the performance using intensity data matrices and traditional pretreatment procedures. Furthermore, we propose two new metrics for the ranking of chemical transformations derived from network properties, which can be applied to sample comparison or clustering. These metrics illustrate how the graph properties of mass-difference networks can highlight the aspects of the information contained in data that are complementary to the information extracted from intensity-based data analysis.
Keywords: Fourier transform mass spectrometry; graph properties; mass-difference networks; metabolomics data analysis; untargeted metabolomics.
Copyright © 2022 Traquete, Luz, Cordeiro, Sousa Silva and Ferreira.
Conflict of interest statement
The authors declare that the research was conducted in the absence of any commercial or financial relationships that could be construed as a potential conflict of interest.
Figures

 ) – O(–NH), (
 ) – NH3(–O), (
 ) – H2, (
 ) – CH2, (
 ) – O, (
 ) – H2O, (
 ) – NCH, (
 ) – CO, (
 ) – CHOH, (
 ) – S, (
 ) – CH2O, (
 ) – CONH, (
 ) – CO2, (
 ) – SO3, (
 ) – PO3H, (
 ) – CHCOOH, and (
 ) – CCH3COOH. Node background colors represent the node degree. Network representations were made with Cytoscape 3.8.1 (Shannon et al., 2003).
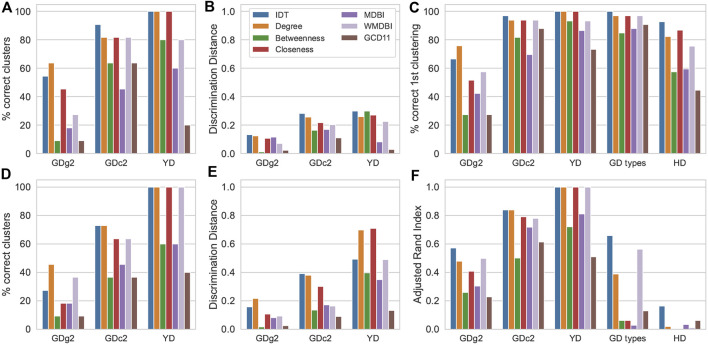


Similar articles
-
Networks and Graphs Discovery in Metabolomics Data Analysis and Interpretation.Front Mol Biosci. 2022 Mar 8;9:841373. doi: 10.3389/fmolb.2022.841373. eCollection 2022. Front Mol Biosci. 2022. PMID: 35350714 Free PMC article. Review.
-
A graph density-based strategy for features fusion from different peak extract software to achieve more metabolites in metabolic profiling from high-resolution mass spectrometry.Anal Chim Acta. 2020 Dec 1;1139:8-14. doi: 10.1016/j.aca.2020.09.029. Epub 2020 Sep 16. Anal Chim Acta. 2020. PMID: 33190713
-
Improved genome annotation through untargeted detection of pathway-specific metabolites.BMC Genomics. 2011 Jun 15;12 Suppl 1(Suppl 1):S6. doi: 10.1186/1471-2164-12-S1-S6. BMC Genomics. 2011. PMID: 21810208 Free PMC article.
-
Exploratory analysis of metabolic changes using mass spectrometry data and graph embeddings.Sci Rep. 2024 Nov 28;14(1):29570. doi: 10.1038/s41598-024-80955-5. Sci Rep. 2024. PMID: 39609505 Free PMC article.
-
Computational methods to identify metabolic sub-networks based on metabolomic profiles.Brief Bioinform. 2017 Jan;18(1):43-56. doi: 10.1093/bib/bbv115. Epub 2016 Jan 27. Brief Bioinform. 2017. PMID: 26822099 Review.
Cited by
-
A Strategy for Uncovering the Serum Metabolome by Direct-Infusion High-Resolution Mass Spectrometry.Metabolites. 2023 Mar 22;13(3):460. doi: 10.3390/metabo13030460. Metabolites. 2023. PMID: 36984900 Free PMC article.
References
LinkOut - more resources
Full Text Sources