Review
. 2022 Jul 22:13:899670.
doi: 10.3389/fphys.2022.899670. eCollection 2022.

Lactate Thresholds and the Simulation of Human Energy Metabolism: Contributions by the Cologne Sports Medicine Group in the 1970s and 1980s

Affiliations
Review

Lactate Thresholds and the Simulation of Human Energy Metabolism: Contributions by the Cologne Sports Medicine Group in the 1970s and 1980s

Henning Wackerhage et al. Front Physiol. .

Abstract

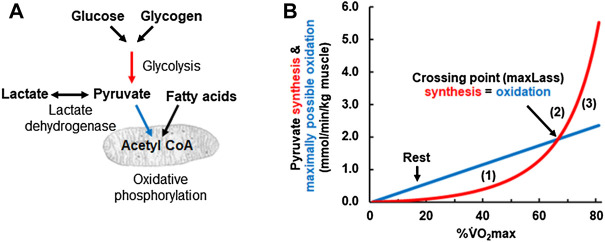
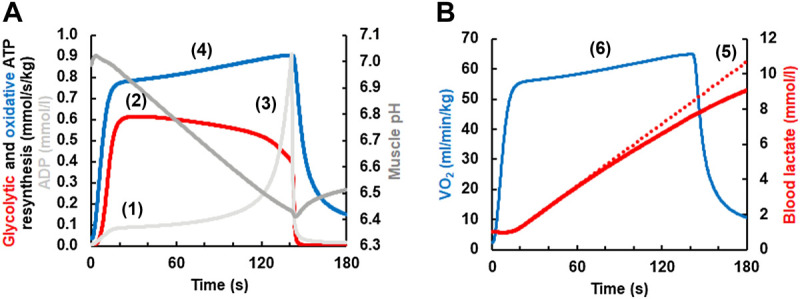
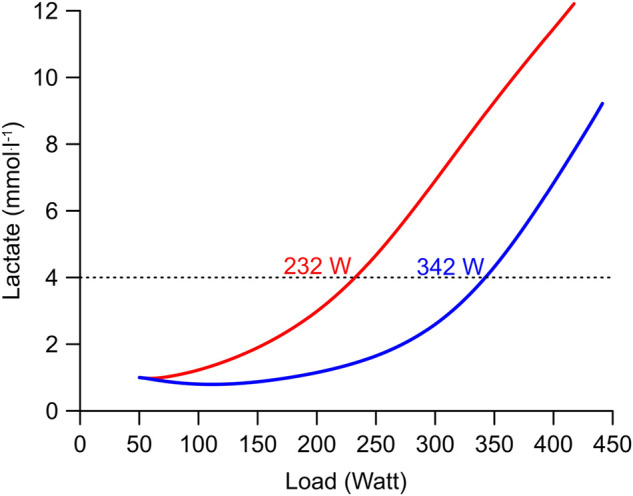
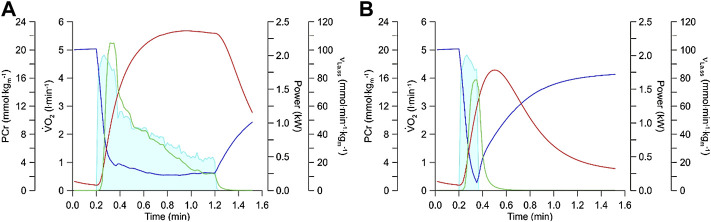
Today, researchers, practitioners, and physicians measure the concentration of lactate during a graded exercise test to determine thresholds related to the maximal lactate steady state (maxLass) as a sensitive measure of endurance capacity. In the 1970s and 1980s, a group of Cologne-based researchers around Wildor Hollmann, Alois Mader, and Hermann Heck developed the methodology for systematic lactate testing and introduced a 4 mmol.L-1 lactate threshold. Later, they also developed the concept of the maxLass, and Mader designed a sophisticated mathematical model of human energy metabolism during exercise. Mader`s model simulates metabolic responses to exercise based on individual variables such as maximum oxygen uptake ( V ˙ O2max) and the maximal rate of lactate formation (νLa.max). Mader's model predicts that the νLa.max reduces the power at the anaerobic threshold and endurance performance but that a high νLa.max is required for events with high power outputs in elite athletes. Mader's model also assumed before the millennium that the rate of fat oxidation is explained by the difference between glycolytic pyruvate synthesis and the actual rate of pyruvate oxidation which is consistent with current opinion. Mader's model also simulated the V ˙ O2max slow component in the mid-1980s. Unfortunately, several landmark studies by the Cologne group were only published in German, and as a result, contributions by the Cologne group are under-appreciated in the English-speaking world. This narrative review aims to introduce key contributions of the Cologne group to human metabolism research especially for readers who do not speak German.

Keywords: Cologne group; V̇O2max; lactate treshold testing; maximal rate of glycolysis; pyruvate deficit; simulating energy metabolism; slow component; νLa max.


Conflict of interest statement

Author SW is employed by INSCYD GmbH. The remaining authors declare that the research was conducted in the absence of any commercial or financial relationships that could be construed as a potential conflict of interest.

Figures

FIGURE 1
FIGURE 1
Effect of a ≈6-week endurance training by one individual at the intensity of the 4 mmol.L−1 lactate threshold (Mader et al. termed it “aerobic-anaerobic transition”) on heart volume measured by X-ray, V˙ O2max, and the workload at the at 4 mmol.L−1 lactate threshold. The study also highlights that the exercise protocol (e.g., the duration of each step) affects the lactate curve and that lactate testing should be specific for each sport (e.g., testing rowers on a treadmill has little predictive power). Printed with kind permission from Mader et al. (1976).
FIGURE 2
FIGURE 2
Relationship between the concentration of ADP and the simulated, relative rates of oxidative (blue) and glycolytic ATP resynthesis (red) for a pH of 7 (upper red curve) and for a pH of 6.4 (lower red curve). Note that ADP needs to rise to higher concentrations for glycolytic ATP resynthesis to kick in than for oxidative ATP resynthesis. This is an important feature for the regulation of human energy metabolism and explains why oxidative ATP resynthesis is dominant at rest and during low intensity exercise. Moreover, as an acid pH inhibits phosphofructokinase, the rate of glycolytic ATP resynthesis at a given ADP concentration is lower if the pH is in reduced. In the model, the maximal rate of glycolytic ATP resynthesis is reached at a pH of 7.4 which is not shown in the figure.
FIGURE 3
FIGURE 3
(A) Schematic drawing of the pathways simulated in Panel 3 (B). Red arrow refers to glycolytic ATP resynthesis or pyruvate synthesis, the glycolytic flux rate νLa. The blue arrows refer to the oxidative ATP resynthesis or the maximally possible rate of pyruvate oxidation, the oxidative flux (V̇O2). (B) Calculated glycolytic pyruvate (and lactate) synthesis [red arrow in (A) and red line in (B)] and maximally possible rate of pyruvate (and lactate) oxidation at different exercise intensities expressed as a percentage of the V˙ O2max. (1) is the zone where glycolytic pyruvate synthesis is below the maximally possible rate of pyruvate oxidation by oxidative phosphorylation. In this area, the pyruvate deficit allows either fat oxidation to fuel the substrate demand of oxidative metabolism or the uptake of pyruvate via previously accumulated lactate. Point (2) is the crossing point where glycolytic pyruvate and lactate synthesis match the maximally possible rate of pyruvate oxidation at a given workload. This point indicates the maxLass. In contrast, (3) is the zone glycolytic flux and the resulting pyruvate synthesis exceeds the maximally possible rate of pyruvate oxidation. As a consequence, pyruvate and lactate accumulate.
FIGURE 4
FIGURE 4
(A) Simulation of the V̇O2 slow component simulated with a current version of the Mader human exercise metabolism model. At the onset of exercise, the concentrations of ADP and AMP (not shown) increase (1). This stimulates phosphofructokinase and thereby increases the rate of glycolytic ATP resynthesis and lactate formation, reaching a maximum in-between 20–40 s (2). As the concentration of muscle lactate increases (B), muscle pH becomes increasingly acid from ≈20 s onwards (3). As an acid pH inhibits phosphofructokinase (Panel 4A) and thereby glycolytic ATP resynthesis, the rate of glycolytic ATP resynthesis declines after its maximum in-between ≈ 20–40 s even though the concentrations of ADP and AMP (not shown) rise greatly just before fatigue. Because glycolytic ATP resynthesis declines, oxidative ATP resynthesis must rise to meet the constant ATP hydrolysis during constant load exercise (4) (the contribution of ATP resynthesis from phosphocreatine is incorporated in the model but not shown). If the efficiency would worsen, then the slow component would increase further. Panel 4B On a whole body level, the reduction in the rate of glycolytic ATP resynthesis and lactate formation is seen (5) as a less than linear increase of the lactate concentration (the dotted line plots an increase of lactate at the rate that is reached in-between 20–40 s). The slow component of oxidative ATP resynthesis in (A) is seen as a corresponding slow component of the V̇O2 in (B) (6).
FIGURE 5
FIGURE 5
Simulation of a graded exercise test of two subjects with extreme differences of their νLa.max but equal V˙ O2max (65 ml min−1 kg−1). The lactate curves are simulated using the revised version of Mader’s human exercise metabolism model (Mader, 1984; Mader, 2003). The first subject (blue curve) has a low maximal glycolytic rate (νLa.max) of 0.3 mmol.L−1 s−1. The second subject (red curve) has a νLa.max of 1.0 mmol.L−1 s−1.
FIGURE 6
FIGURE 6
(A) Simulation of energy metabolism during a 1,000 m time trial of a track cyclist. This calculation is based on the recorded power output from an Olympic track cyclist using the equations from the Mader model, the computer simulation calculates the behavior of glycolytic flux (green line; expressed per kg muscle), PCr levels (blue line), and oxygen uptake (red line) in dependency of the power output (light blue shade). Physiological variables used in the simulation were V˙ O2max: 65 ml min−1 kg−1; νLa.max: 0.9 mmol.L−1 s−1; bodyweight: 95 kg; and active muscle mass: 40%. (B) Simulation of energy metabolism for the power output during the 1,000 m time trial as conducted by the athlete in Panel 6A but possessing a lower maximal glycolytic rate. The input parameters were V˙ O2max: 65 ml min−1 kg−1; νLa.max: 0.4 mmol.L−1 s−1; bodyweight: 95 kg; and active muscle mass: 40%.

References

    1. Baker J. S., Mccormick M. C., Robergs R. A. (2010). Interaction Among Skeletal Muscle Metabolic Energy Systems during Intense Exercise. J. Nutr. Metab. 2010, 905612. 10.1155/2010/905612 - DOI - PMC - PubMed
    1. Bouchard C. (2022). The Study of Human Variability Became a Passion. Eur. J. Clin. Nutr. 76, 631–636. 10.1038/s41430-021-00871-z - DOI - PubMed
    1. Cieslar J. H., Dobson G. P. (2000). Free [ADP] and Aerobic Muscle Work Follow at Least Second Order Kinetics in Rat Gastrocnemius In Vivo . J. Biol. Chem. 275, 6129–6134. 10.1074/jbc.275.9.6129 - DOI - PubMed
    1. Colosio A. L., Caen K., Bourgois J. G., Boone J., Pogliaghi S. (2020). Bioenergetics of the VO2 Slow Component between Exercise Intensity Domains. Pflugers Arch. - Eur. J. Physiol. 472, 1447–1456. 10.1007/s00424-020-02437-7 - DOI - PMC - PubMed
    1. Costill D. L., Daniels J., Evans W., Fink W., Krahenbuhl G., Saltin B. (1976). Skeletal Muscle Enzymes and Fiber Composition in Male and Female Track Athletes. J. Appl. Physiology 40, 149–154. 10.1152/jappl.1976.40.2.149 - DOI - PubMed