

Anatomical and Functional Connectivity at the Dendrodendritic Reciprocal Mitral Cell-Granule Cell Synapse: Impact on Recurrent and Lateral Inhibition
- PMID: 35937203
- PMCID: PMC9355734
- DOI: 10.3389/fncir.2022.933201
Anatomical and Functional Connectivity at the Dendrodendritic Reciprocal Mitral Cell-Granule Cell Synapse: Impact on Recurrent and Lateral Inhibition
Abstract
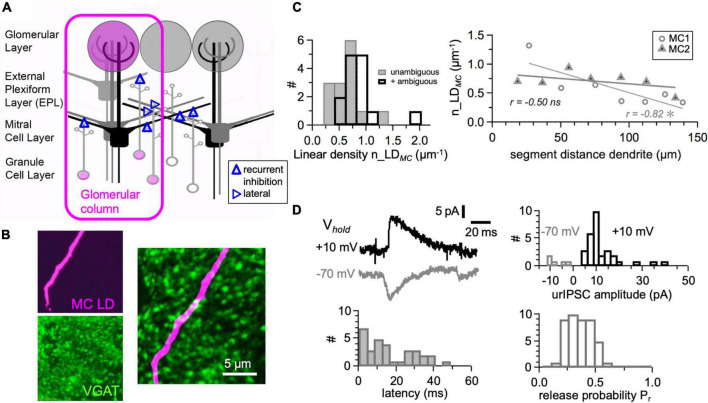
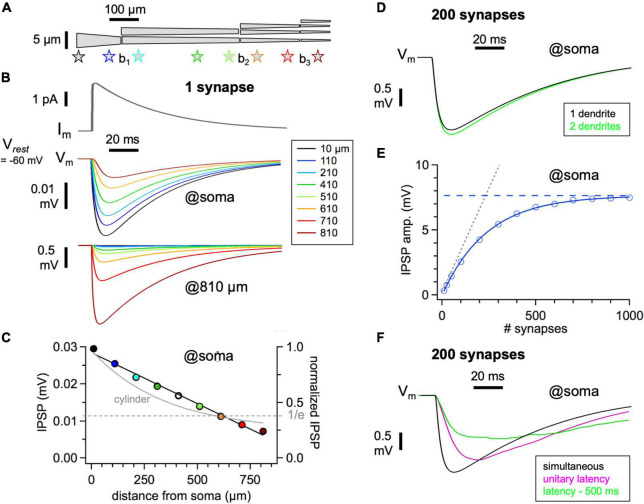
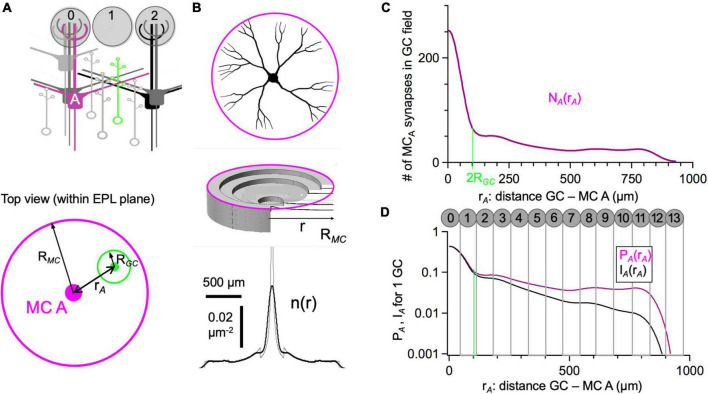
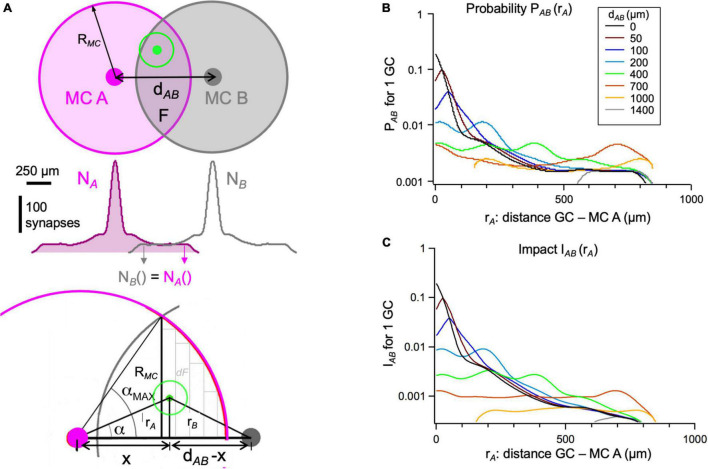
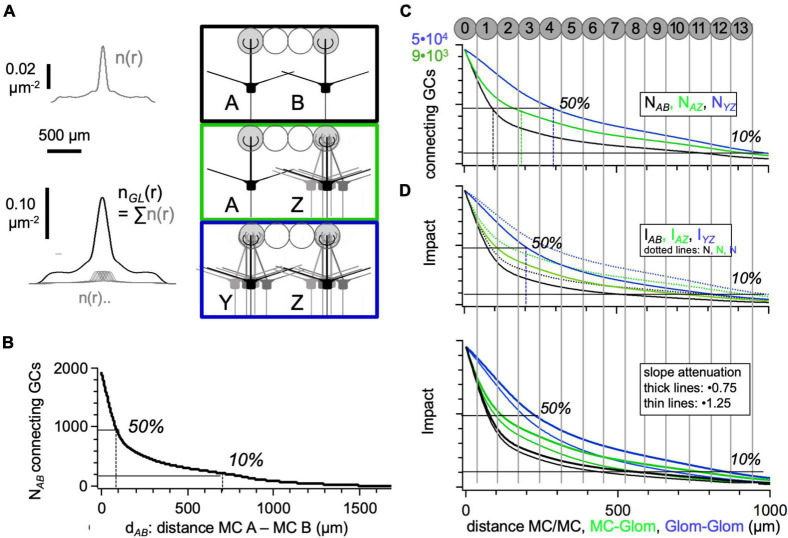
In the vertebrate olfactory bulb, reciprocal dendrodendritic interactions between its principal neurons, the mitral and tufted cells, and inhibitory interneurons in the external plexiform layer mediate both recurrent and lateral inhibition, with the most numerous of these interneurons being granule cells. Here, we used recently established anatomical parameters and functional data on unitary synaptic transmission to simulate the strength of recurrent inhibition of mitral cells specifically from the reciprocal spines of rat olfactory bulb granule cells in a quantitative manner. Our functional data allowed us to derive a unitary synaptic conductance on the order of 0.2 nS. The simulations predicted that somatic voltage deflections by even proximal individual granule cell inputs are below the detection threshold and that attenuation with distance is roughly linear, with a passive length constant of 650 μm. However, since recurrent inhibition in the wake of a mitral cell action potential will originate from hundreds of reciprocal spines, the summated recurrent IPSP will be much larger, even though there will be substantial mutual shunting across the many inputs. Next, we updated and refined a preexisting model of connectivity within the entire rat olfactory bulb, first between pairs of mitral and granule cells, to estimate the likelihood and impact of recurrent inhibition depending on the distance between cells. Moreover, to characterize the substrate of lateral inhibition, we estimated the connectivity via granule cells between any two mitral cells or all the mitral cells that belong to a functional glomerular ensemble (i.e., which receive their input from the same glomerulus), again as a function of the distance between mitral cells and/or entire glomerular mitral cell ensembles. Our results predict the extent of the three regimes of anatomical connectivity between glomerular ensembles: high connectivity within a glomerular ensemble and across the first four rings of adjacent glomeruli, substantial connectivity to up to eleven glomeruli away, and negligible connectivity beyond. Finally, in a first attempt to estimate the functional strength of granule-cell mediated lateral inhibition, we combined this anatomical estimate with our above simulation results on attenuation with distance, resulting in slightly narrowed regimes of a functional impact compared to the anatomical connectivity.
Keywords: glomerular column; granule cell; lateral inhibition; mitral cell; network model; olfactory bulb; reciprocal synapse; recurrent inhibition.
Copyright © 2022 Aghvami, Kubota and Egger.
Conflict of interest statement
The authors declare that the research was conducted in the absence of any commercial or financial relationships that could be construed as a potential conflict of interest.
Figures
Similar articles
-
Direct Recording of Dendrodendritic Excitation in the Olfactory Bulb: Divergent Properties of Local and External Glutamatergic Inputs Govern Synaptic Integration in Granule Cells.J Neurosci. 2017 Dec 6;37(49):11774-11788. doi: 10.1523/JNEUROSCI.2033-17.2017. Epub 2017 Oct 24. J Neurosci. 2017. PMID: 29066560 Free PMC article.
-
Plasticity of dendrodendritic microcircuits following mitral cell loss in the olfactory bulb of the murine mutant Purkinje cell degeneration.J Comp Neurol. 1987 Feb 8;256(2):284-98. doi: 10.1002/cne.902560208. J Comp Neurol. 1987. PMID: 3558882
-
CCKergic Tufted Cells Differentially Drive Two Anatomically Segregated Inhibitory Circuits in the Mouse Olfactory Bulb.J Neurosci. 2020 Aug 5;40(32):6189-6206. doi: 10.1523/JNEUROSCI.0769-20.2020. Epub 2020 Jun 30. J Neurosci. 2020. PMID: 32605937 Free PMC article.
-
Computing with dendrodendritic synapses in the olfactory bulb.Ann N Y Acad Sci. 2009 Jul;1170:264-9. doi: 10.1111/j.1749-6632.2009.03899.x. Ann N Y Acad Sci. 2009. PMID: 19686145 Review.
-
Dynamic connectivity in the mitral cell-granule cell microcircuit.Semin Cell Dev Biol. 2006 Aug;17(4):424-32. doi: 10.1016/j.semcdb.2006.04.006. Epub 2006 May 5. Semin Cell Dev Biol. 2006. PMID: 16889994 Review.
Cited by
-
Neurogenesis dynamics in the olfactory bulb: deciphering circuitry organization, function, and adaptive plasticity.Neural Regen Res. 2025 Jun 1;20(6):1565-1581. doi: 10.4103/NRR.NRR-D-24-00312. Epub 2024 Jun 26. Neural Regen Res. 2025. PMID: 38934393 Free PMC article.
-
Fast-spiking interneuron detonation drives high-fidelity inhibition in the olfactory bulb.bioRxiv [Preprint]. 2024 May 8:2024.05.07.592874. doi: 10.1101/2024.05.07.592874. bioRxiv. 2024. Update in: PLoS Biol. 2024 Aug 26;22(8):e3002660. doi: 10.1371/journal.pbio.3002660. PMID: 38766161 Free PMC article. Updated. Preprint.
-
Fast-spiking interneuron detonation drives high-fidelity inhibition in the olfactory bulb.PLoS Biol. 2024 Aug 26;22(8):e3002660. doi: 10.1371/journal.pbio.3002660. eCollection 2024 Aug. PLoS Biol. 2024. PMID: 39186804 Free PMC article.
-
Shared and divergent principles of synaptic transmission between cortical excitatory neurons in rodent and human brain.Front Synaptic Neurosci. 2023 Sep 5;15:1274383. doi: 10.3389/fnsyn.2023.1274383. eCollection 2023. Front Synaptic Neurosci. 2023. PMID: 37731775 Free PMC article. Review.
-
The spiking output of the mouse olfactory bulb encodes large-scale temporal features of natural odor environments.bioRxiv [Preprint]. 2024 Jul 1:2024.03.01.582978. doi: 10.1101/2024.03.01.582978. bioRxiv. 2024. PMID: 38496526 Free PMC article. Preprint.
References
-
- Allison A. C. (1953). The morphology of the olfactory system in the vertebrates. Biol. Rev. Camb. Philos. Soc. 28 195–244.
Publication types
MeSH terms
LinkOut - more resources
Full Text Sources
Miscellaneous