

Cellular Profiles of Prodynorphin and Preproenkephalin mRNA-Expressing Neurons in the Anterior Olfactory Tubercle of Mice
- PMID: 35937204
- PMCID: PMC9352893
- DOI: 10.3389/fncir.2022.908964
Cellular Profiles of Prodynorphin and Preproenkephalin mRNA-Expressing Neurons in the Anterior Olfactory Tubercle of Mice
Abstract
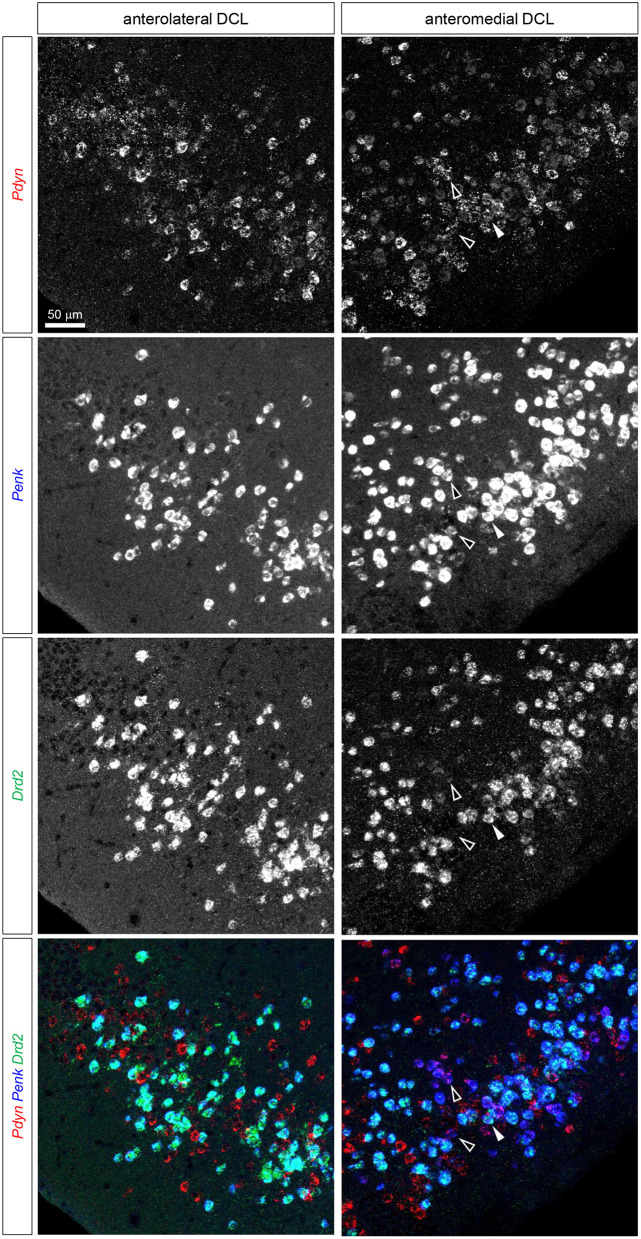
The olfactory tubercle (OT) is a striatal region that receives olfactory inputs. mRNAs of prodynorphin (Pdyn) and preproenkephalin (Penk), precursors of dynorphins and enkephalins, respectively, are strongly expressed in the striatum. Both produce opioid peptides with various physiological effects such as pain relief and euphoria. Recent studies have revealed that OT has anatomical and cytoarchitectonic domains that play different roles in odor-induced motivated behavior. Neuronal subtypes of the OT can be distinguished by their expression of the dopamine receptors D1 (Drd1) and D2 (Drd2). Here, we addressed whether and which type of opioid peptide precursors the D1- and D2-expressing neurons in the OT express. We used multiple fluorescence in situ hybridization for mRNAs of the opioid precursors and dopamine receptors to characterize mouse OT neurons. Pdyn was mainly expressed by Drd1-expressing cells in the dense cell layer (DCL) of the OT, whereas Penk was expressed primarily by Drd2-expressing cells in the DCL. We also confirmed the presence of a larger population of Pdyn-Penk-Drd1 co-expressing cells in the DCL of the anteromedial OT compared with the anterolateral OT. These observations will help understand whether and how dynorphins and enkephalins in the OT are involved in diverse odor-induced motivated behaviors.
Keywords: DARPP-32; dopamine receptor D1; dopamine receptor D2; medium spiny neurons; olfactory tubercle; opioids; preproenkephalin; prodynorphin.
Copyright © 2022 Maegawa, Murata, Kuroda, Fujieda and Fukazawa.
Conflict of interest statement
KM received research funding from the LOTTE Foundation. The remaining authors declare that the research was conducted in the absence of any commercial or financial relationships that could be construed as a potential conflict of interest.
Figures


Similar articles
-
Endogenous opioids in the olfactory tubercle and their roles in olfaction and quality of life.Front Neural Circuits. 2024 May 30;18:1408189. doi: 10.3389/fncir.2024.1408189. eCollection 2024. Front Neural Circuits. 2024. PMID: 38872907 Free PMC article. Review.
-
Mapping of Learned Odor-Induced Motivated Behaviors in the Mouse Olfactory Tubercle.J Neurosci. 2015 Jul 22;35(29):10581-99. doi: 10.1523/JNEUROSCI.0073-15.2015. J Neurosci. 2015. PMID: 26203152 Free PMC article.
-
Dopamine receptor mRNA expression patterns by opioid peptide cells in the nucleus accumbens of the rat: a double in situ hybridization study.J Comp Neurol. 1995 Oct 9;361(1):57-76. doi: 10.1002/cne.903610106. J Comp Neurol. 1995. PMID: 8550882
-
Phenotypical characterization of the neurons expressing the D1 and D2 dopamine receptors in the monkey striatum.J Comp Neurol. 2000 Feb 28;418(1):22-32. J Comp Neurol. 2000. PMID: 10701753
-
Neuropeptide gene expression and neural activity: assessing a working hypothesis in nucleus caudalis and dorsal horn neurons expressing preproenkephalin and preprodynorphin.Cell Mol Neurobiol. 1990 Mar;10(1):73-98. doi: 10.1007/BF00733637. Cell Mol Neurobiol. 1990. PMID: 1970758 Free PMC article. Review.
Cited by
-
Function of orexin-1 receptor signaling in the olfactory tubercle in odor-guided attraction and aversion.Commun Biol. 2024 Dec 26;7(1):1702. doi: 10.1038/s42003-024-07438-1. Commun Biol. 2024. PMID: 39725686 Free PMC article.
-
Endogenous opioids in the olfactory tubercle and their roles in olfaction and quality of life.Front Neural Circuits. 2024 May 30;18:1408189. doi: 10.3389/fncir.2024.1408189. eCollection 2024. Front Neural Circuits. 2024. PMID: 38872907 Free PMC article. Review.
-
Prediction Model for Sensory Perception Abnormality in Autism Spectrum Disorder.Int J Mol Sci. 2023 Jan 25;24(3):2367. doi: 10.3390/ijms24032367. Int J Mol Sci. 2023. PMID: 36768688 Free PMC article.
References
Publication types
MeSH terms
Substances
LinkOut - more resources
Full Text Sources
Miscellaneous