

Association Between Cancer Prevalence and Different Socioeconomic Strata in the US: The National Health and Nutrition Examination Survey, 1999-2018
- PMID: 35937239
- PMCID: PMC9355719
- DOI: 10.3389/fpubh.2022.873805
Association Between Cancer Prevalence and Different Socioeconomic Strata in the US: The National Health and Nutrition Examination Survey, 1999-2018
Abstract
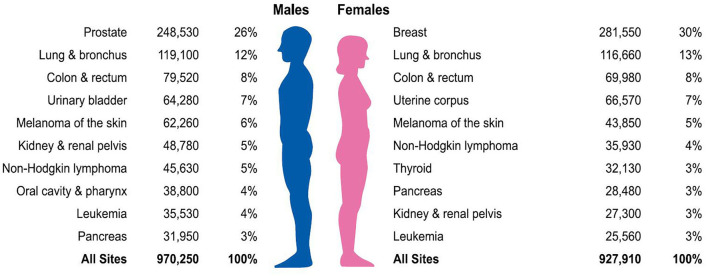
Background: Inequality in health outcomes in relation to Americans' socioeconomic status (SES) is rising. American Cancer Society depicts that the most common cancers are diagnosed in men and women in 2021. We aim to study socioeconomic inequalities in related cancers to investigate whether the cancer prevalence differs within the family income to poverty ratio (PIR).
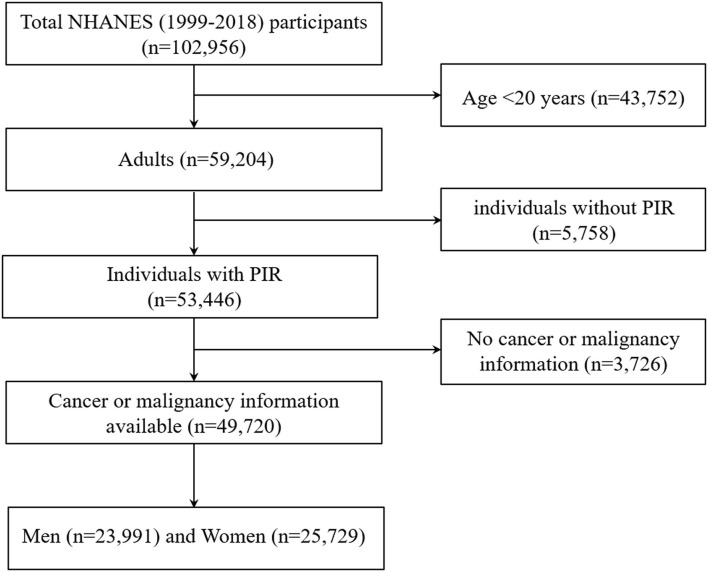
Methods: The study investigated data from adults aged 20-85 years participated in the 1999-2018 National Health and Nutrition Examination Survey (NHANES) who had complete data available on PIR and cancer or malignancy information (n = 49,720). Participants were stratified into 3 categories of PIR: high income (PIR ≥ 4), middle income (>1 and <4), or at or below the federal poverty level (≤1).
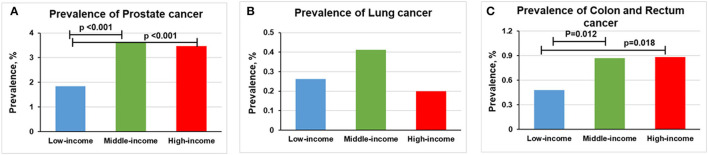
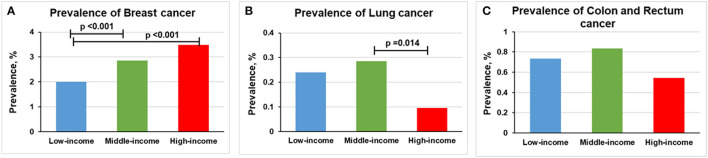
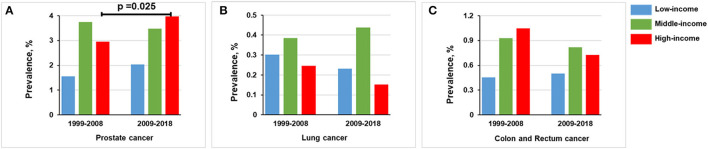
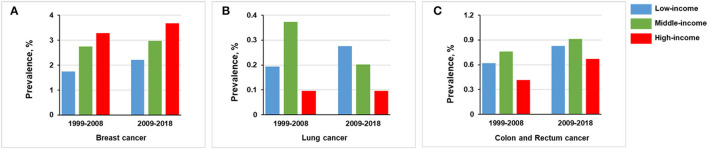
Results: The prevalence of prostate cancer was higher in the middle-income (3.61% [n = 464]) and high-income groups (3.36% [n = 227]) than in the low-income group (1.83% [n = 84], all p < 0.001). The prevalence of breast cancer was higher in middle-income (2.86% [n = 390]) and high-income participants (3.48% [n = 218]) than in low-income participants (2.00% [n = 117], all p < 0.001). Compared with the low-income group in men (0.48% [n = 22]), a higher prevalence of colon and rectum cancer occurs in the middle-income (0.87% [n = 112], p = 0.012) and high-income groups (0.89% [n = 58], p = 0.018). The prevalence of lung cancer in women was lower in high-income participants than middle-income participants (0.10% [n = 6] vs. 0.29% [n = 39], p = 0.014).
Conclusions: Increasing disparities in cancer prevalence were identified across all socioeconomic categories analyzed in this study. To ensure the sustainable development goals, it is a global health priority to understand inequalities in health and to target interventions accordingly.
Keywords: NHANES; PIR; cancer; prevalence; socioeconomic strata.
Copyright © 2022 Wang, Liu, Ma, Li, Sun, Cheng, Cheng, Liu and Zhang.
Conflict of interest statement
The authors declare that the research was conducted in the absence of any commercial or financial relationships that could be construed as a potential conflict of interest.
Figures
References
MeSH terms
LinkOut - more resources
Full Text Sources
Medical