

Exploring the Correlation between Changes in Gut Microbial Community Diversity and Depression in Human Populations
- PMID: 35937392
- PMCID: PMC9355758
- DOI: 10.1155/2022/6334868
Exploring the Correlation between Changes in Gut Microbial Community Diversity and Depression in Human Populations
Abstract
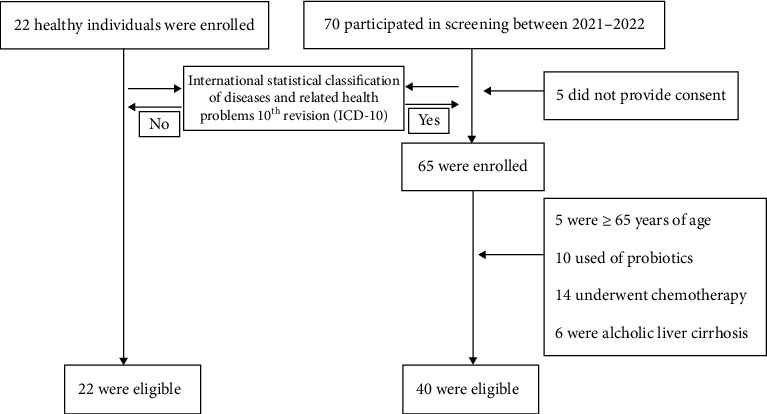
Depression, also known as depressive disorder, is a group of psychosomatic affective disorders characterized by persistent and significantly depressed mood, delayed thinking, and cognitive impairment. The aim of this study was to explore the correlation between changes in gut microbial community diversity and depression to provide data on new strategies for the prevention and treatment of depression. In this study, we separated participants into a group of depressed patients and a healthy comparison group. We analyzed the gut microbial community structure of depressed patients and healthy comparisons using second-generation sequencing of the bacterial 16S RNA gene. There were significant differences in the gut microflora structure between patients with depression and healthy individuals. The gut flora alpha diversity index was significantly reduced in patients with depression compared to that in the healthy population. At the species level, the relative abundance of Coprococcus catus and Bacteroides barnesiae was significantly lower in the depressed group than that in the control group. The development of depression may be associated with a decrease in beneficial gut bacteria.
Copyright © 2022 Xin Li et al.
Conflict of interest statement
The authors declare that there are no conflicts of interest regarding the publication of this paper.
Figures


Similar articles
-
[Analysis of the dynamic changes in gut microbiota in patients with extremely severe burns by 16S ribosomal RNA high-throughput sequencing technology].Zhonghua Shao Shang Za Zhi. 2020 Dec 20;36(12):1159-1166. doi: 10.3760/cma.j.cn501120-20200518-00271. Zhonghua Shao Shang Za Zhi. 2020. PMID: 33379852 Chinese.
-
Gut Microbiome and Serum Metabolome Alterations Associated with Isolated Dystonia.mSphere. 2021 Aug 25;6(4):e0028321. doi: 10.1128/mSphere.00283-21. Epub 2021 Aug 4. mSphere. 2021. PMID: 34346706 Free PMC article.
-
[Correlations Between Gut Microbiota Changes and Cognitive Function in Patients with Post-Stroke Cognitive Impairment in the Early Stage].Sichuan Da Xue Xue Bao Yi Xue Ban. 2022 Sep;53(5):857-865. doi: 10.12182/20220960105. Sichuan Da Xue Xue Bao Yi Xue Ban. 2022. PMID: 36224689 Free PMC article. Chinese.
-
Alterations of Gut Microbiota in Patients With Irritable Bowel Syndrome Based on 16S rRNA-Targeted Sequencing: A Systematic Review.Clin Transl Gastroenterol. 2019 Feb;10(2):e00012. doi: 10.14309/ctg.0000000000000012. Clin Transl Gastroenterol. 2019. PMID: 30829919 Free PMC article.
-
Exploring the Gut Microbiome in Myasthenia Gravis.Nutrients. 2022 Apr 14;14(8):1647. doi: 10.3390/nu14081647. Nutrients. 2022. PMID: 35458209 Free PMC article. Review.
Cited by
-
Gut microbiota variations in depression and anxiety: a systematic review.BMC Psychiatry. 2025 May 1;25(1):443. doi: 10.1186/s12888-025-06871-8. BMC Psychiatry. 2025. PMID: 40312666 Free PMC article.
-
The butyrate-producing and spore-forming bacterial genus Coprococcus as a potential biomarker for neurological disorders.Gut Microbiome (Camb). 2023 Aug 30;4:e16. doi: 10.1017/gmb.2023.14. eCollection 2023. Gut Microbiome (Camb). 2023. PMID: 39295905 Free PMC article. Review.
-
Exploration of the Gut Microbiome in Thai Patients with Major Depressive Disorder Shows a Specific Bacterial Profile with Depletion of the Ruminococcus Genus as a Putative Biomarker.Cells. 2023 Apr 25;12(9):1240. doi: 10.3390/cells12091240. Cells. 2023. PMID: 37174640 Free PMC article.
-
Role of Inflammatory Mechanisms in Major Depressive Disorder: From Etiology to Potential Pharmacological Targets.Cells. 2024 Feb 28;13(5):423. doi: 10.3390/cells13050423. Cells. 2024. PMID: 38474387 Free PMC article. Review.
-
Gut microbiota composition in depressive disorder: a systematic review, meta-analysis, and meta-regression.Transl Psychiatry. 2023 Dec 8;13(1):379. doi: 10.1038/s41398-023-02670-5. Transl Psychiatry. 2023. PMID: 38065935 Free PMC article.
References
MeSH terms
Substances
LinkOut - more resources
Full Text Sources
