. 2022 Jul;2(7):725-738.
doi: 10.1158/2767-9764.crc-22-0069. Epub 2022 Jul 27.

The Combination of Radiotherapy and Complement C3a Inhibition Potentiates Natural Killer cell Functions Against Pancreatic Cancer

Affiliations

The Combination of Radiotherapy and Complement C3a Inhibition Potentiates Natural Killer cell Functions Against Pancreatic Cancer

Quaovi H Sodji et al. Cancer Res Commun. 2022 Jul.

Abstract

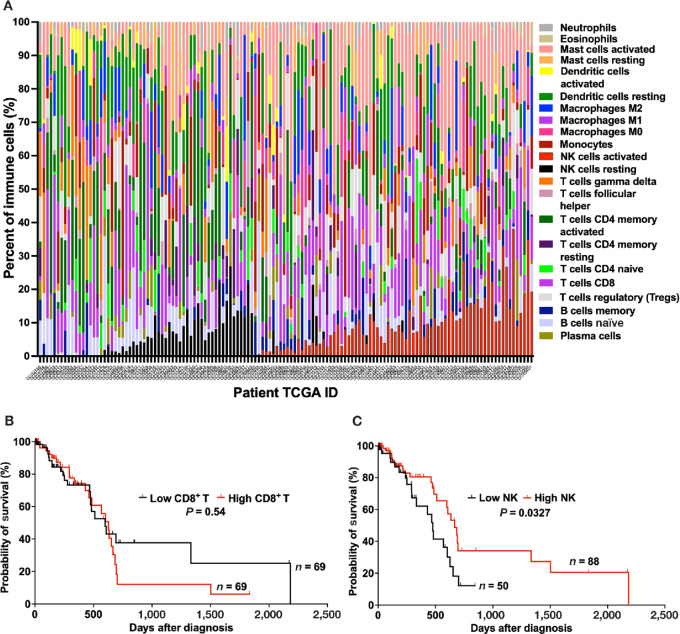
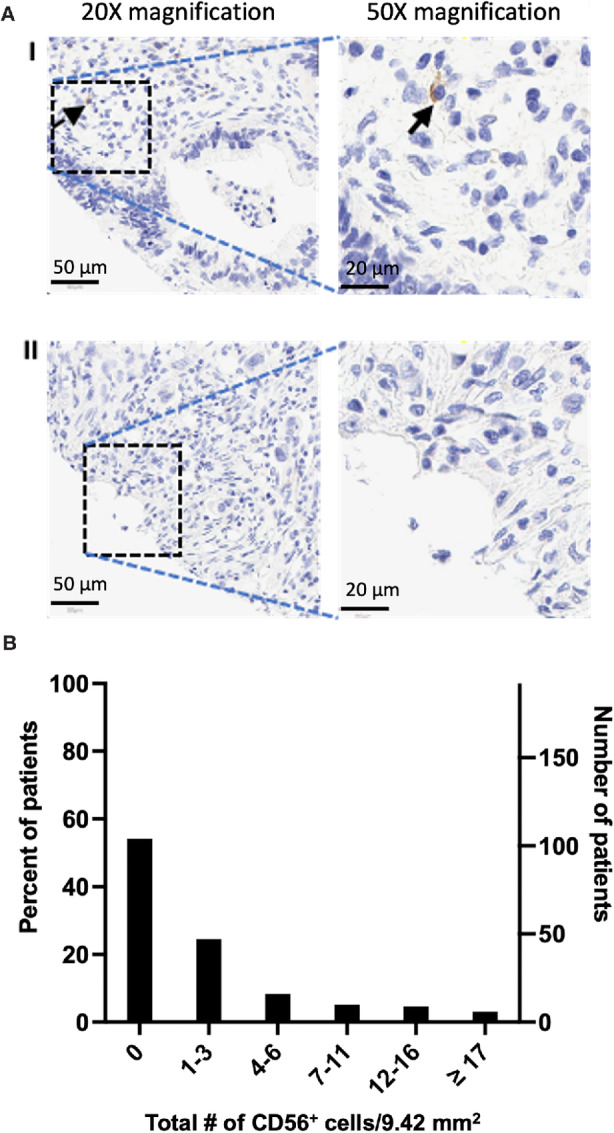
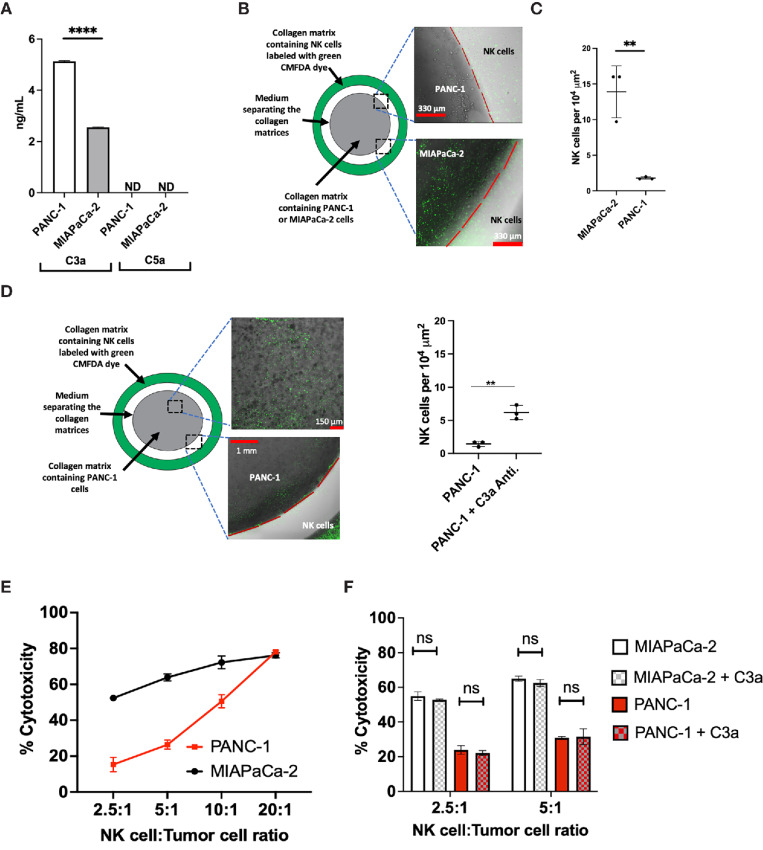
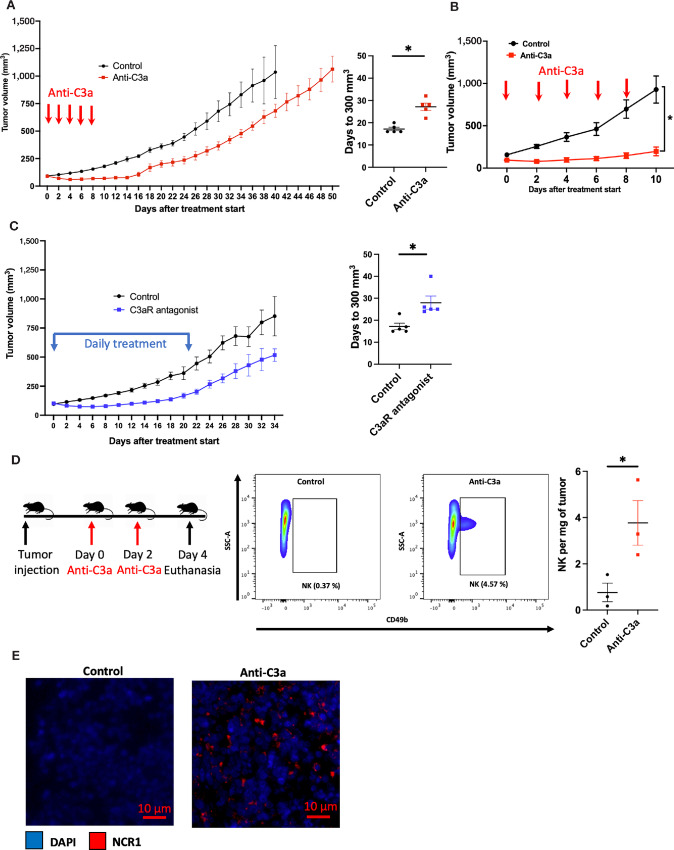
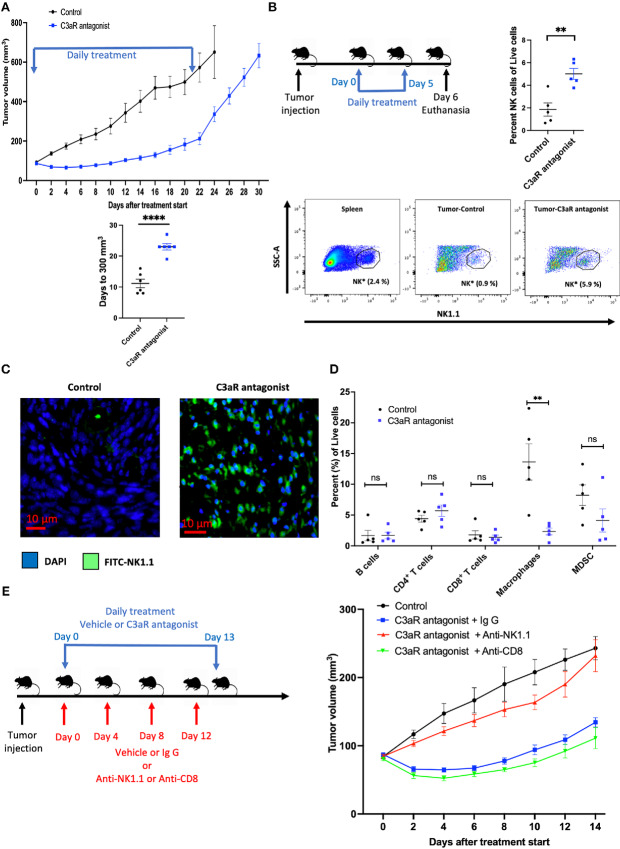
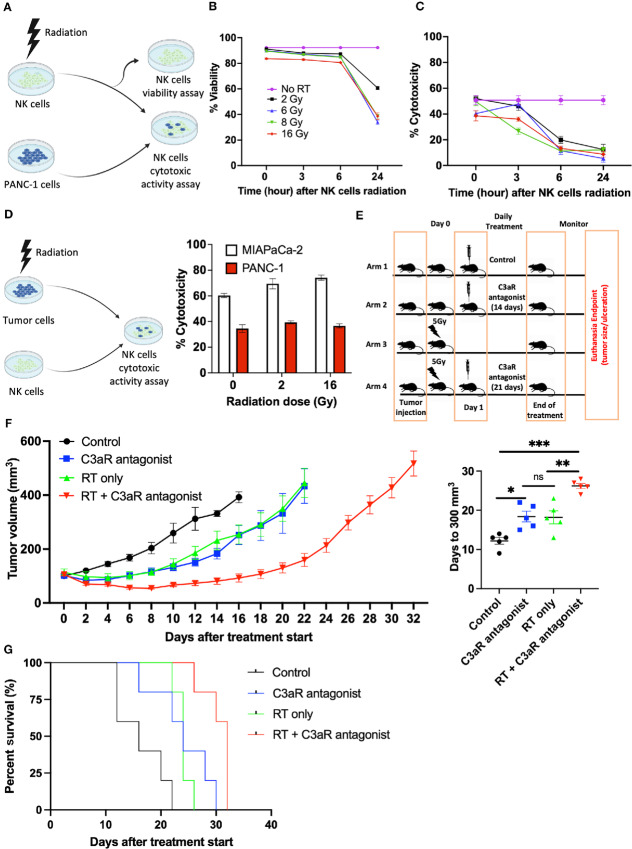
Pancreatic cancer is one of the deadliest cancers, against which current immunotherapy strategies are not effective. Herein, we analyzed the immune cell composition of the tumor microenvironment of pancreatic cancer samples in The Cancer Genome Atlas and found that the presence of intratumoral NK cells correlates with survival. Subsequent analysis also indicated that NK cell exclusion from the microenvironment is found in a high percentage of clinical pancreatic cancers and in preclinical models of pancreatic cancer. Mechanistically, NK cell exclusion is regulated in part by complement C3a and its receptor signaling. Inhibition of the C3a receptor enhances NK cell infiltration in syngeneic mouse models of pancreatic cancer resulting in tumor growth delay. However, tumor growth inhibition mediated by NK cells is not sufficient alone for complete tumor regression, but is potentiated when combined with radiation therapy. Our findings indicate that although C3a inhibition is a promising approach to enhance NK cell-based immunotherapy against pancreatic cancer, its combination with radiation therapy hold greater therapeutic benefit.


Conflict of interest statement

M.M. Olcina reports grants from Medical Research Council Unit Grant and Cancer Research UK Oxford Centre during the conduct of the study. Q.-T. Le reports non-financial support from Merck; personal fees from Nanobiotix, Roche, and Coherus outside the submitted work. A.J. Giaccia reports grants from NCI and ASCO during the conduct of the study. No disclosures were reported by the other authors.

Figures

FIGURE 1
FIGURE 1
Kaplan–Meier curves of overall survival based on CD8+ T cells and NK cells in the TME of 138 patients with pancreatic cancer: CIBERSORTx analysis of TCGA database. A, Proportion of various immune cells type in the TME of 138 patients with pancreatic cancer based on the CIBERSORTx analysis of TCGA. Each column represents a patient with pancreatic cancer and each color is indicative of an immune cell type. B, The density of CD8+ T cells in the TME of patients with pancreatic cancer in TCGA database does not correlate with survival. Median survival for patients with high (>8.52%, n = 69; red) versus low (<8.52%, n = 69; black) CD8+ T cells: 627 and 598 days, respectively (P = 0.54, log-rank test). C, Pancreatic cancer patients in TCGA database with high proportion of NK cells in the TME have better survival. Median survival for patients with high (>5%, n = 88; red) versus low (<5%, n = 50; black) NK cells: 666 and 476 days, respectively (P = 0.0327, log-rank test).
FIGURE 2
FIGURE 2
CD56+ cells are excluded from the TME of most patients with pancreatic cancer. A, Sample IHC staining of CD56+ cells (black arrow) on pancreatic cancer TMA. I, Representative image of pancreatic cancer with intratumoral CD56+ cells. 20× magnification, scale bar: 50 μm; 50× magnification, scale bar: 20 μm. II, Representative image of pancreatic cancer without CD56+ cells. 20× magnification, scale bar: 50 μm; 50× magnification, scale bar: 20 μm. B, Distribution of CD56+ cells in the TME of a cohort of 192 patients with pancreatic cancer in our institutional database. IHC staining for CD56+ cell on a TMA (three cores per patient) revealed that the TME in most patients (104 patients, 54.2%) is devoid of CD56+ cells. X-axis represents the total NK cells in three cores of TMA (9.42 mm2) per patient. Right Y-axis: Number of patients; Left Y-axis: percent of total patients. CD56+ cells were counted on each TMA core by an observer blinded to patients’ clinical outcome and data.
FIGURE 3
FIGURE 3
The complement C3a is secreted by human pancreatic cancer cell lines and higher concentration of C3a is associated with NK cell exclusion from the TME but C3a does not inhibit the cytotoxic activity of NK cells. A, C3a is secreted in the supernatant of PANC-1 and MIAPaCa-2 (****, P < 0.0001, n = 3, triplicate measurements from two independents experiments); however, C5a is not detected. C3a and C5a measured by ELISA. ND: Not detected. B, Experimental setup to evaluate NK cell (green CMFDA dye labeled) infiltration into a 3D collagen matrix containing human pancreatic cancer cells. The gap (white) between the collagen matrices containing tumor and NK cells is filled with media. C, NK cells infiltrate a 3D collagen matrix containing MIAPaCa-2, whereas NK cells do not infiltrate a 3D collagen matrix containing PANC-1 cells (**, P = 0.0001, n = 3, triplicate measurements from three independents experiments). D, Neutralization of C3a with human C3a antibody enhances NK cell infiltration into a 3D collagen matrix containing PANC-1 cells (**, P = 0.0045, n = 3, triplicate measurements from three independents experiments). E, Isolated NK cells from human donor possess cytotoxic activity against human pancreatic cancer cells. The cytotoxic activity of NK cells is measured using the LDH release assay at different NK:Tumor cells ratio (n = 3, three independents experiments). F, The complement C3a does not inhibit the cytotoxic activity of NK cells. At the NK:Tumor ratio of 2.5:1 and 5:1, addition of C3a (5 μg/mL) has no significant inhibitory effect on the cytotoxic activity of NK cells against both PANC-1 and MIAPaCa-2 cell lines. (n = 3, triplicate measurements from two independents experiments). ns: not significant. Statistical significance determined using t test.
FIGURE 4
FIGURE 4
Inhibition of the C3a/C3aR axis results in tumor growth delay due to an increase of NK cells in the TME of pancreatic cancer xenograft mouse models. Tumor cells were injected subcutaneously in nude mice (Athymic nude Foxn1nu) and tumors were allowed to reach approximately 100 mm3 and were randomized into each treatment arm. Tumor size was monitored until experimental endpoint (tumor ulceration or volume >1,500 mm3). A, Mice bearing PANC-1 tumors were treated with Intraperitoneal injection of PBS (control, n = 5) or C3a antibody (Anti-C3a group, n = 5) every other day. Mean time to reaching 300 mm3 is 17.2 days in the control arm compared with 27.2 days in the Anti-C3a arm (*, P = 0.0006). B, Mice bearing MIAPaCa-2 tumor were treated with intraperitoneal injection of PBS (control, n = 5) or C3a antibody (anti-C3a group, n = 5) every other day. Anti-C3a treatment results in tumor growth delay (*, P < 0.0001). C, Mice bearing PANC-1 tumor were treated with either daily intraperitoneal injection of vehicle (4% DMSO in PBS) (control group, n = 5) or with daily intraperitoneal injection of the small-molecule C3aR antagonist SB290157 (C3aR antagonist group, n = 5, 7.5 mg/kg) for 22 days. The mean time to reaching 300 mm3 in the control group was 17 days compared with 28 days in the C3aR antagonist group (*, P < 0.0125). D, Neutralization of C3a enhances NK cell infiltration in the TME of PANC-1 xenograft mouse model on flow cytometry analysis. After PANC-1 tumor cells implanted subcutaneously reached a volume of 150 mm3, treatment was started with either intraperitoneal injection of PBS (control group, n = 3) or with intraperitoneal injection of C3a antibody (anti-C3a group, n = 3). The mice were euthanized after two treatments on day 4. FACS analysis revealed an increase in the proportion of NK cells (CD49b+) per tumor weight (mg) (* P = 0.04). E, IF staining of MIAPaCa-2 xenograft model revealed an increase of NK cells (NCR1, red) in the anti-C3a group compared with the control group. Statistical significance determined using t test otherwise specified.
FIGURE 5
FIGURE 5
C3a receptor antagonism results in tumor growth delay of Pan02 syngeneic mouse model in C57BL/6 mice and is mediated by increased NK cell infiltration in the TME. A, After Pan02 tumor cells implanted subcutaneously in C57BL/6 mice reached a volume of approximately 100 mm3, treatment was started with either daily intraperitoneal injection of vehicle (4% DMSO in PBS; control group, n = 6) or with daily intraperitoneal injection of the small-molecule C3aR antagonist SB290157 (SB290157 group, 5 mg/kg, n = 6) for 22 days and tumor size was monitored during and after treatment until endpoint (tumor ulceration or volume >1,000 mm3). The mean time to reaching 300 mm3 in the control group was 11.2 days compared with 23 days in the SB902157 treatment group (****, P < 0.0001). B, Flow cytometry analysis of control versus C3aR antagonist treated Pan02 tumor-bearing mice. Mice were randomized in two treatment groups (control vs. C3aR antagonist, n = 5 per group) and were treated daily for six treatments and euthanized the day after the last treatment. C3aR antagonism results in an increased NK cells (NK1.1+; as a percentage of live cells) in the TME (**, P = 0.0032). Representative gating of NK cells shown (*, Proportion of NK cells as a percentage of live cells). C, Representative IF staining of control and C3aR antagonist–treated mice (n = 3 per treatment group), showing an increase of NK cells (NK1.1-FITC) in the TME of C3aR antagonist-treated mice compared with vehicle-treated mice. D, Flow cytometry analysis of control versus C3aR antagonist–treated Pan02 tumor-bearing mice. Except a decrease in macrophages (Gr1CD11b+F4/80+) in the C3aR antagonist–treated tumors (**, P = 0.0055), no statistically significant (ns) difference in B cells (B220+), CD4+ T cells, CD8+ T cells, and MDSCs (Gr1+CD11b+) is noted between the two treatment groups. E, Left: NK and CD8+ T cells depletion experiment scheme. After randomization into the treatment arms, NK cells or CD8+ T cells depletion was achieved by the administration of 100 μg of antibody (anti-NK1.1, or anti-CD8) intraperitoneal on days 0, 4, 8, and 12. Mouse IgG1 was used as isotype control. Mice undergoing NK and CD8+ T cells depletion and receiving IgG1 isotype control antibody were treated with daily intraperitoneal injection of SB290157 (5 mg/kg) from day 0 to day 13. Mice in the control arm were treated with daily vehicle (4% DMSO in PBS). Right: Depletion of NK cells abrogates the effect of the C3aR antagonist, resulting in tumor growth rate similar to the control group, whereas with CD8+ T cells depletion, C3aR antagonist retains its effect on tumor growth delay. Statistical significance determined using t test.
FIGURE 6
FIGURE 6
Radiation of NK cells is detrimental to their cytotoxic activity and viability but potentiates the tumor growth delay of C3aR inhibition when delivered before the C3aR antagonist by enhancing NK cell killing of malignant cells. A, Experimental design evaluating the impact of radiation on NK cell viability and cytotoxic activity. B, The viability of NK cells is significantly decreased 24 hours after various single dose of radiation (n = 3, triplicate measurements from two independents experiments). C, Radiation of NK cells with various single dose decreases their cytotoxic activity against PANC-1 cells (n = 3, triplicate measurements from two independents experiments). The decrease in the cytotoxic activity is observed 3 hours after radiation. Cytotoxic activity measured using the LDH release assay at a ratio of 20:1 (NK:PANC-1). D, The killing of both PANC-1 and MIAPaCa-2 cells by NK cells is modestly enhanced by their irradiation prior to NK cell cytotoxic activity assay. Cytotoxic activity measured using the LDH release assay at a ratio of 5:1 (NK:Tumor). E, Experimental design in syngeneic mouse model of pancreatic cancer in C57BL/6 mice: After Pan02 tumor subcutaneously implanted in C57BL/6 mice reached approximately 100 mm3, the mice were randomized in four treatment arms. Arm 1 (control, intraperitoneal injection of vehicle: 4% DMSO in PBS, n = 5), arm 2 (C3aR antagonist, SB290157 only, daily intraperitoneal, 14 days), arm 3 (single radiation dose of 5 Gy, n = 5), arm 4 (combination therapy, single fraction of 5 Gy on day 0, followed by daily intraperitoneal injection of SB290157 starting on day 1 for 21 days, n = 5). Tumor size was monitored until experimental endpoint (tumor ulceration or volume >1,000 mm3). F, Left: Tumor growth curve in syngeneic mouse model of pancreatic cancer in C57BL/6 mice with Pan02 cells showing that the combination of C3aR antagonism following radiation results in a significant tumor growth delay compared with each individual treatment. Right: Time (days) after the beginning of treatment to reach 300 mm3 was determined; Control arm: 12.2 days; C3aR antagonist (SB290157) only arm: 18.4 days; Radiation only arm: 18.2 days; Combination treatment arm (radiation + C3aR antagonist): 26 days. *, P < 0.01; **, P < 0.001; ***, P < 0.0001; ns, not significant. Statistical significance determined by two-way ANOVA multiple comparisons. G, Survival curves of the various treatment arms in the syngeneic mouse model of pancreatic cancer in C57BL/6 mice with Pan02 cells. Median survival: Control (16 days); radiotherapy only (24 days); C3aR antagonist only (24 days); RT + C3aR antagonist (32 days).

Similar articles

Cited by

References

    1. Siegel RL, Miller KD, Fuchs HE, Jemal A. Cancer statistics, 2021. CA Cancer J Clin 2021;71:7–33. - PubMed
    1. Rahib L, Smith BD, Aizenberg R, Rosenzweig AB, Fleshman JM, Matrisian LM. Projecting cancer incidence and deaths to 2030: the unexpected burden of thyroid, liver, and pancreas cancers in the United States. Cancer Res 2014;74:2913–21. - PubMed
    1. Sung H, Ferlay J, Siegel RL, Laversanne M, Soerjomataram I, Jemal A, et al. . Global Cancer Statistics 2020: GLOBOCAN estimates of incidence and mortality worldwide for 36 cancers in 185 countries. CA Cancer J Clin 2021;71:209–49. - PubMed
    1. Pourshams A, Sepanlou SG, Ikuta KS, Bisignano C, Safiri S, Roshandel G, et al. . The global, regional, and national burden of pancreatic cancer and its attributable risk factors in 195 countries and territories, 1990–2017: a systematic analysis for the Global Burden of Disease Study 2017. Lancet Gastroenterol Hepatol 2019;4:934–47. - PMC - PubMed
    1. Huang J, Lok V, Ngai CH, Zhang L, Yuan J, Lao XQ, et al. . Worldwide burden of, risk factors for, and trends in pancreatic cancer. Gastroenterology 2021;160:744–54. - PubMed

Publication types