

Review
doi: 10.1016/j.gastha.2022.04.019.
A Novel Pancreatic Cancer Mini-tumor Model to Study Desmoplasia and Myofibroblastic Cancer-Associated Fibroblast Differentiation
Collaborators,
Affiliations
- PMID: 35937541
- PMCID: PMC9340885
- DOI: 10.1016/j.gastha.2022.04.019
Item in Clipboard
Review
A Novel Pancreatic Cancer Mini-tumor Model to Study Desmoplasia and Myofibroblastic Cancer-Associated Fibroblast Differentiation
Gastro Hep Adv.
2022.
No abstract available
Keywords: CAF, cancer-associated fibroblasts; MT, minitumor; MyCAF, myofibroblastic CAF; PDAC, pancreatic ductal adenocarcinoma; PDGFR, platelet-derived growth factor receptor; PDO, pancreatic tumor-derived organoids; TGFβ, transforming growth factor β; αSMA, α-smooth muscle actin.
Figures
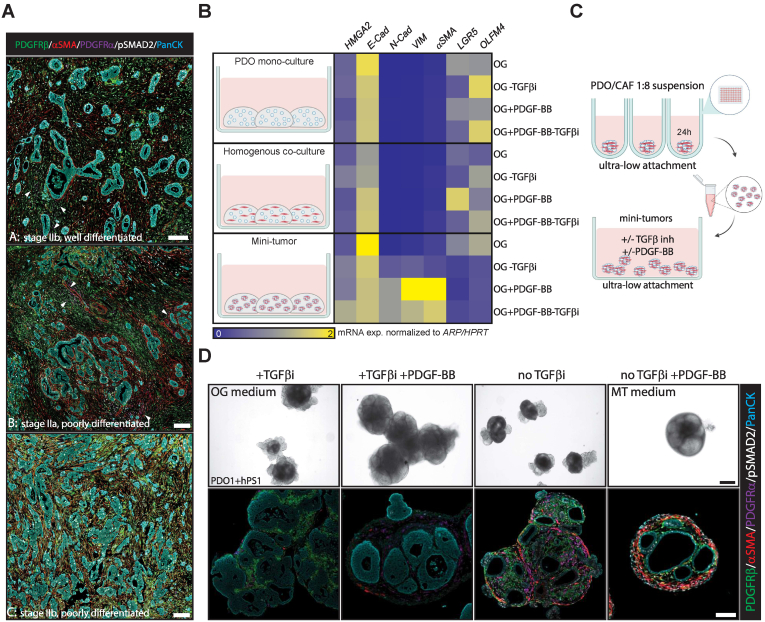
PDGF-BB and TGFβ drive pancreatic cancer MT formation including desmoplasia and MyCAF differentiation. (A) Examples of 3 different PDAC primary tumors (A, B, C) stained for PDGFRβ (green) PDGFRα (magenta), αSMA (red), pSMAD2 (white), and pan-cytokeratin (cyan). Scalebar 100 μm. Arrows indicate PDGFRα+ cells. (B) Relative mRNA expression of HMGA2, E-cadherin N-Cadherin, Vimentin (VIM), αSMA, LGR5 and OLFM4 in PDO1 monocultures, PDO1 + hPS1 homogenous and direct contact MT cocultures grown in organoid growth (OG) medium ± TGFβ inhibitor (TGFβi) or PDGF-BB for 10 days (n = 3). (C) Schematic overview of suspension MT generation. (D) Representative bright-field images (top panel) of PDO1 + hPS1 MTs cultured in OG, OG + PDGF-BB, OG-TGFβ inhibitor, and OG + PDGF-BB-TGFβ inhibitor (MT) medium for 10 days. These were subsequently processed and stained for PDGFRβ (green) PDGFRα (magenta), αSMA (red), pSMAD2 (white), and pan-cytokeratin (cyan) (bottom panel). n = 3; Scalebar 100 μm.
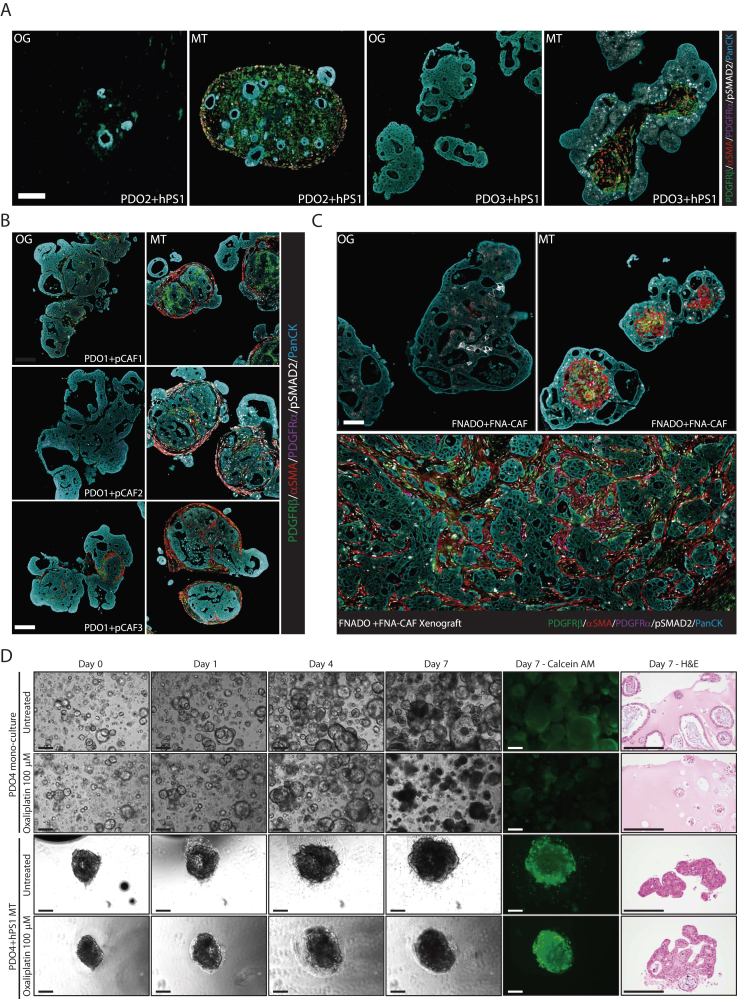
Characteristics and applicability of the MT model. (A) FFPE PDO2 + hPS1 and PDO3 + hPS1 MTs cultured in OG or MT (OG + PDGF-BB-TGFβ inhibitor) medium for 10 days stained for PDGFRβ (green), PDGFRα (magenta), αSMA (red), pSMAD2 (white), and pan-cytokeratin (cyan). Scalebar 100 μm. (B) Representative FFPE PDO1 + primary CAF1 (pCAF), pCAF2, and pCAF3 MTs cultured in OG or MT medium for 10 days stained for PDGFRβ (green), PDGFRα (magenta), αSMA (red), pSMAD2 (white), and pan-cytokeratin (cyan); n = 2. (C) FFPE FNADO + FNA-CAF MTs cultured in OG or MT medium for 10 days compared to FNADO + FNA-CAF xenograft, stained for PDGFRβ (green), PDGFRα (magenta), αSMA (red), pSMAD2 (white), and pan-cytokeratin (cyan); n = 3, scalebar 100 μm. (D) Monoculture organoids (PDO4) and MTs consisting of PDO4 and hPS1 fibroblasts were treated with oxaliplatin (100 μm) and imaged for 7 days using phase-contrast microscopy. On day 7, viability was assessed using calcein AM staining, and cells were subsequently processed for hematoxylin & eosin (H&E) staining. Scalebar 250 μm.
References
Publication types
LinkOut - more resources
Full Text Sources
Miscellaneous
