. 2021 Mar;1(1):100010.
doi: 10.1016/j.xops.2021.100010. Epub 2021 Mar 13.

Clinicomolecular Identification of Conserved and Individualized Features of Granulomatous Uveitis

Affiliations

Clinicomolecular Identification of Conserved and Individualized Features of Granulomatous Uveitis

Lynn M Hassman et al. Ophthalmol Sci. 2021 Mar.

Abstract

Objective: To identify molecular features that distinguish individuals with shared clinical features of granulomatous uveitis.

Design: Cross-sectional, observational study.

Participants: Four eyes from patients with active granulomatous uveitis.

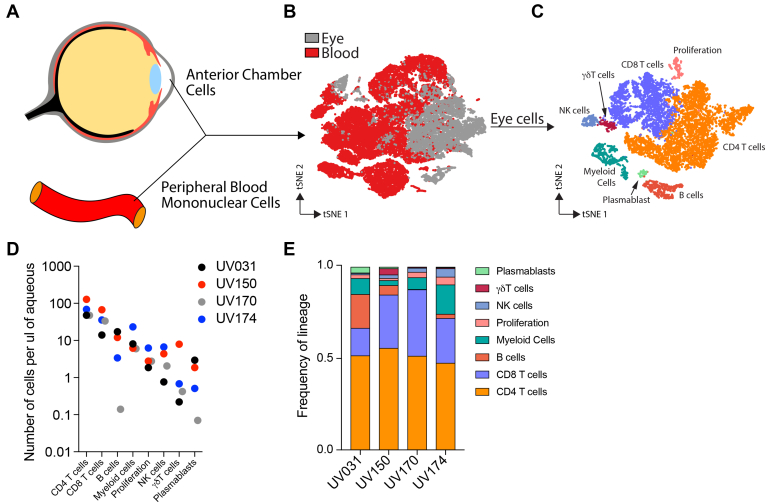
Methods: We performed single-cell RNA-sequencing with antigen-receptor sequence analysis to obtain an unbiased gene expression survey of ocular immune cells and identify clonally expanded lymphocytes.

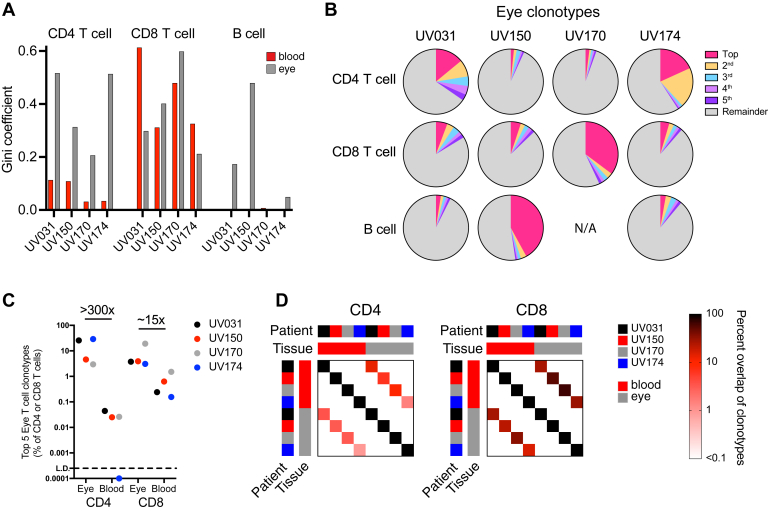
Main outcomes measures: For each inflamed eye, we measured the proportion of distinct immune cell types, the amount of B or T cell clonal expansion, and the transcriptional profile of T and B cells.

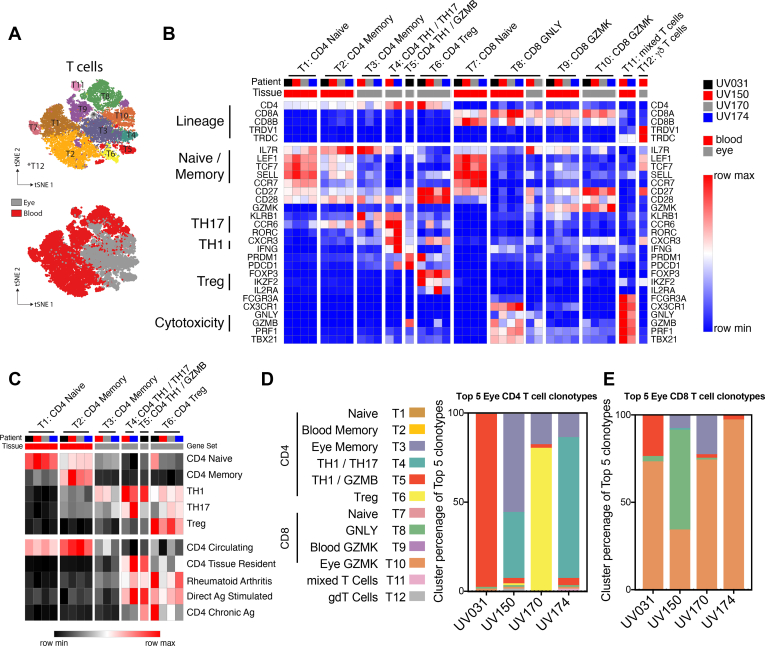
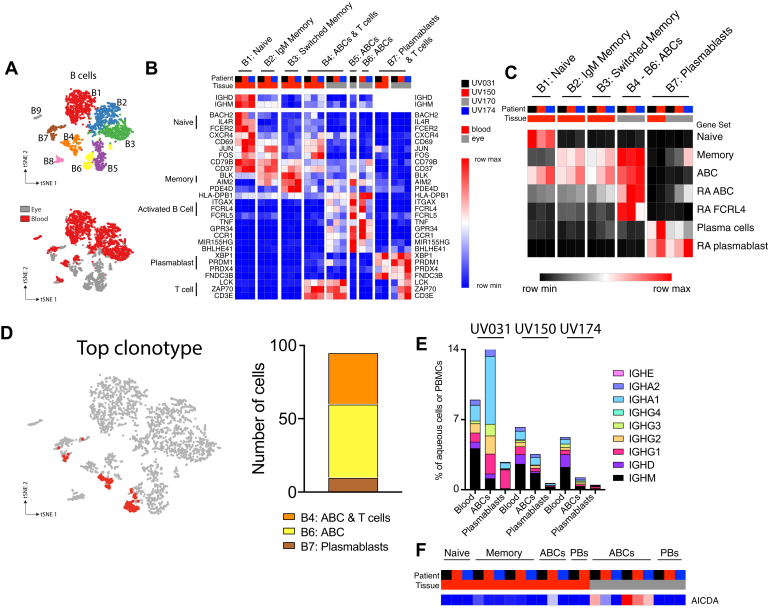
Results: Each individual had robust clonal expansion arising from a single T or B cell lineage, suggesting distinct, antigen-driven pathogenic processes in each patient. This variability in clonal expansion was mirrored by individual variability in CD4 T cell populations, whereas ocular CD8 T cells and B cells were more transcriptionally similar between patients. Finally, ocular B cells displayed evidence of class-switching and plasmablast differentiation within the ocular microenvironment, providing additional support for antigen-driven immune responses in granulomatous uveitis.

Conclusions: Collectively, our study identified both conserved and individualized features of granulomatous uveitis, illuminating parallel pathophysiologic mechanisms, and suggesting that future personalized therapeutic approaches may be warranted.

Keywords: B cells; T cells; Uveitis; clonal expansion; single cell RNA sequencing.


Conflict of interest statement

Conflict of interest statement: All authors have declared that no conflicts of interest exist.

Figures

Figure 1
Figure 1
High-resolution transcriptional profiling of ocular inflammatory cells. CD4 T cells are the most frequent immune cell across patients with variable contribution of other cell types. A, Diagram showing how cells were collected from the anterior chamber and the peripheral blood for single-cell RNA sequencing. B, Diagram showing t-distributed stochastic neighbor embedding (tSNE) visualization of blood and ocular immune cells colored by tissue source. C, Diagram showing ocular immune cells on a tSNE visualization, colored by cell type. D, Graph showing concentration of ocular immune cells for each patient and cell type. E, Bar graph showing frequency of ocular immune cell types for each patient. NK = natural killer.
Figure 2
Figure 2
Highly expanded T- and B-cell clonotypes in the eye. Robust clonal expansion is seen in a single ocular T- or B-cell lineage, with ocular CD8 T-cell clonotypes more abundant in the blood compared with CD4 T-cell clonotypes. A, Bar graph showing T- and B-cell diversity and clonality in blood and ocular T or B cells for each indicated patient, as measured by the Gini coefficient, where on a scale from 0 to 1, 0 indicates that all sequences have the same frequency and 1 indicates that the repertoire is dominated by a single sequence. B, Pie charts showing the proportions of the 5 most frequent ocular CD4 T-cell, CD8 T-cell, or B-cell clonotypes for each individual. C, Graph showing composite frequency of the top 5 CD4 and CD8 T-cell clonotypes from (B) in both the eye and blood for each patient. D, Graphs showing percent overlap of all CD4 and CD8 T-cell clonotypes in the blood and eye from all patients. Percentage is calculated as the number of shared individual clonotypes in each row-column intersection divided by the total number of clonotypes in each column without regard to clonotype frequency. Overlap is detected only between blood and eye samples within a single patient, and not between patients.
Figure 3
Figure 3
CD4 T cells show individualized combinations of ocular TH1, TH1/TH17, and regulatory T (Treg) cells, whereas CD8 T cells share a common transcriptional program. Gene expression in effector CD4 T cells reflects both patient-to-patient variation and shared signatures of tissue residency, antigen exposure, and rheumatoid arthritis. In contrast, ocular CD8 T cells across patients share increased expression of intermediate differentiation markers and reduced expression of classic cytotoxic molecules. A, Diagram showing t-distributed stochastic neighbor embedding subanalysis of blood and ocular T cells colored by cluster (top panel) or tissue source (bottom panel). B, Heatmap representation of relative gene expression of cluster-defining genes (rows) for each patient (columns black, red, grey, blue) and tissue (blood, red; eye, grey). Clusters are annotated with cell lineages defined above. Samples with less than 5% contribution to each cluster were excluded. Clusters are annotated with lineage and functional subset. Genes defining specific T-cell states or functions are indicated. C, Heatmap representation of relative expression of cell lineage or state-defining gene set expression between T-cell clusters. D, E, Bar graphs showing percent of T-cell cluster occupancy for the top 5 ocular (D) CD4 and (E) CD8 T-cell clonotypes.
Figure 4
Figure 4
Ocular B cells are activated B cells with transcriptional similarities to synovial B cells in rheumatoid arthritis (RA). Clonally expanded B cells demonstrate evidence of plasmablast differentiation and class switching. A, Diagram showing t-distributed stochastic neighbor embedding subanalysis of blood and ocular B cells colored by cluster (top panel) or by tissue source (bottom panel). BE, Clusters B8 and B9 were excluded from further analysis because these clusters represented predominantly myeloid cells and erythrocyte precursors, respectively. B, Heatmap representation of relative gene expression of cluster-defining genes (rows) for each patient (columns black, red, grey, blue) and tissue (blood, red; eye, grey). Clusters are annotated with cell lineages defined above. Genes specific to B-cell subsets and T cells are indicated with labeled brackets. Samples with less than 5% contribution to each cluster were excluded. C, Heatmap representation of relative expression of cell lineage or state-defining gene set expression between B-cell clusters. Samples with less than 5% contribution to each cluster were excluded. D, Diagram showing distribution of the top expanded B-cell clonotype from patient UV150 between activated B cell (ABC; B4 and B6) and plasmablast (B7) clusters. E, Concentration of each immunoglobulin subclass in blood, ocular ABCs, and ocular plasmablasts clusters for each patient. Relative frequency of switched non-immunoglobulin M (IgM) subclass increases with differentiation. F, Relative expression of AICDA, found primarily in ABCs. PB = plasmablast.

References

    1. Jaffe G.J., Dick A.D., Brezin A.P., et al. Adalimumab in patients with active noninfectious uveitis. N Engl J Med. 2016;375(10):932–943. - PubMed
    1. Jabs D.A. Immunosuppression for the uveitides. Ophthalmology. 2018;125(2):193–202. - PMC - PubMed
    1. Rathinam S.R., Gonzales J.A., Thundikandy R., et al. Effect of corticosteroid-sparing treatment with mycophenolate mofetil vs methotrexate on inflammation in patients with uveitis: a randomized clinical trial. JAMA. 2019;322(10):936–945. - PMC - PubMed
    1. Kanski J.J., Bowling B., Nischal K.K., Pearson A. 7th ed. Elsevier/Saunders; Edinburgh; New York: 2011. Clinical Ophthalmology: A Systematic Approach; p. ix.
    1. Chan C.C., BenEzra D., Hsu S.M., et al. Granulomas in sympathetic ophthalmia and sarcoidosis. Immunohistochemical study. Arch Ophthalmol. 1985;103(2):198–202. - PubMed