

Ferroptosis-related lncRNA signature predicts prognosis and immunotherapy efficacy in cutaneous melanoma
- PMID: 35937602
- PMCID: PMC9354448
- DOI: 10.3389/fsurg.2022.860806
Ferroptosis-related lncRNA signature predicts prognosis and immunotherapy efficacy in cutaneous melanoma
Abstract
Purpose: Ferroptosis-related lncRNAs are promising biomarkers for predicting the prognosis of many cancers. However, a ferroptosis-related signature to predict the prognosis of cutaneous melanoma (CM) has not been identified. The purpose of this study was to construct a ferroptosis-related lncRNA signature to predict prognosis and immunotherapy efficacy in CM.
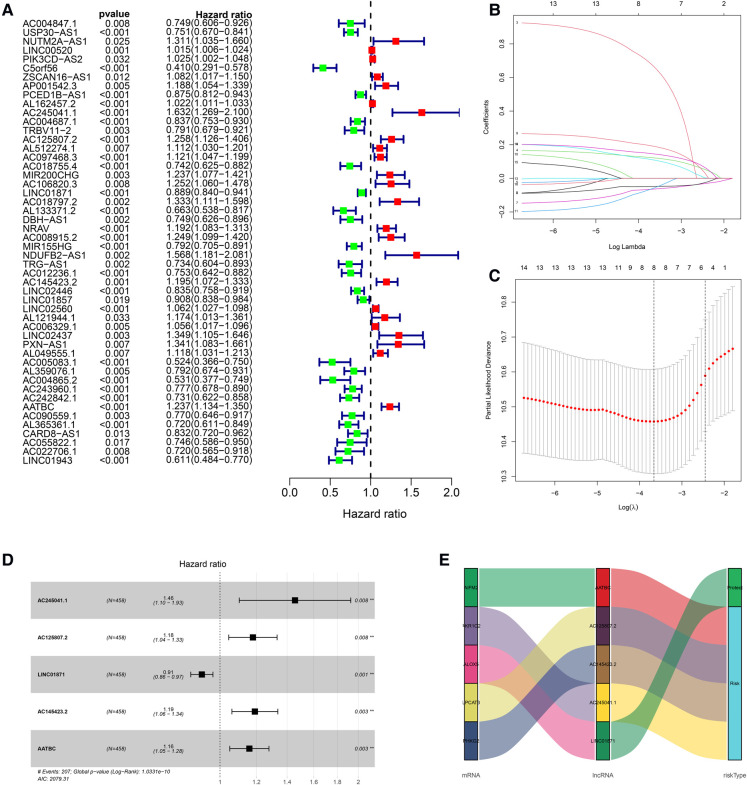
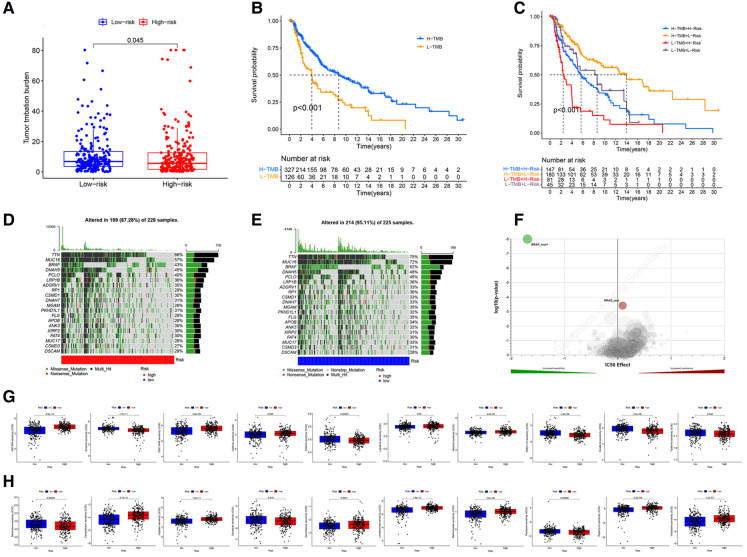
Methods: Ferroptosis-related differentially expressed genes (FDEGs) and lncRNAs (FDELs) were identified using TCGA, GTEx, and FerrDb datasets. We performed Cox and LASSO regressions to identify key FDELs, and constructed a risk score to stratify patients into high- and low-risk groups. The lncRNA signature was evaluated using the areas under the receiver operating characteristic curves (AUCs) and Kaplan-Meier analyses in the training, testing, and entire cohorts. Multivariate Cox regression analyses including the lncRNA signature and common clinicopathological characteristics were performed to identify independent predictors of overall survival (OS). A nomogram was developed for clinical use. We performed gene set enrichment analyses (GSEA) to identify significantly enriched pathways. Differences in the tumor microenvironment (TME) between the 2 groups were assessed using 7 algorithms. To predict the efficacy of immune checkpoint inhibitors (ICI), we analyzed the association between PD1 and CTLA4 expression and the risk score. Finally, differences in Tumor Mutational Burden (TMB) and molecular drugs Sensitivity between the 2 groups were performed.
Results: We identified 5 lncRNAs (AATBC, AC145423.2, LINC01871, AC125807.2, and AC245041.1) to construct the risk score. The AUC of the lncRNA signature was 0.743 in the training cohort and was validated in the testing and entire cohorts. Kaplan-Meier analyses revealed that the high-risk group had poorer prognosis. Multivariate Cox regression showed that the lncRNA signature was an independent predictor of OS with higher accuracy than traditional clinicopathological features. The 1-, 3-, and 5-year survival probabilities for CM patients were 92.7%, 57.2%, and 40.2% with an AUC of 0.804, indicating a good accuracy and reliability of the nomogram. GSEA showed that the high-risk group had lower ferroptosis and immune response. TME analyses confirmed that the high-risk group had lower immune cell infiltration (e.g., CD8+ T cells, CD4+ memory-activated T cells, and M1 macrophages) and lower immune functions (e.g., immune checkpoint activation). Low-risk patients whose disease expressed PD1 or CTLA4 were likely to respond better to ICIs. The analysis demonstrated that the TMB had significantly difference between low- and high- risk groups. Chemotherapy drugs, such as sorafenib, Imatinib, ABT.888 (Veliparib), Docetaxel, and Paclitaxel showed Significant differences in the estimated IC50 between the two risk groups.
Conclusion: Our novel ferroptosis-related lncRNA signature was able to accurately predict the prognosis and ICI outcomes of CM patients. These ferroptosis-related lncRNAs might be potential biomarkers and therapeutic targets for CM.
Keywords: cutaneous melanoma; ferroptosis; immune checkpoint; immune infiltration; long non-coding RNA.
© 2022 Xu, Chen, Niu, Yang, Xing, Yin, Guo, Zhang, Yang and Han.
Conflict of interest statement
The authors declare that the research was conducted in the absence of any commercial or financial relationships that could be construed as a potential conflict of interest.
Figures


Similar articles
-
A Novel Pyroptotic and Inflammatory Gene Signature Predicts the Prognosis of Cutaneous Melanoma and the Effect of Anticancer Therapies.Front Med (Lausanne). 2022 Apr 15;9:841568. doi: 10.3389/fmed.2022.841568. eCollection 2022. Front Med (Lausanne). 2022. PMID: 35492358 Free PMC article.
-
Construction of a ferroptosis-related five-lncRNA signature for predicting prognosis and immune response in thyroid carcinoma.Cancer Cell Int. 2022 Sep 29;22(1):296. doi: 10.1186/s12935-022-02674-z. Cancer Cell Int. 2022. PMID: 36175889 Free PMC article.
-
Development and Validation of a Novel Ferroptosis-Related LncRNA Signature for Predicting Prognosis and the Immune Landscape Features in Uveal Melanoma.Front Immunol. 2022 Jun 14;13:922315. doi: 10.3389/fimmu.2022.922315. eCollection 2022. Front Immunol. 2022. PMID: 35774794 Free PMC article.
-
Ferroptosis-related long non-coding RNA signature predicts the prognosis of hepatocellular carcinoma: A Review.Medicine (Baltimore). 2022 Nov 25;101(47):e31747. doi: 10.1097/MD.0000000000031747. Medicine (Baltimore). 2022. PMID: 36451456 Free PMC article. Review.
-
A new CCCH-type zinc finger-related lncRNA signature predicts the prognosis of clear cell renal cell carcinoma patients.Front Genet. 2022 Sep 30;13:1034567. doi: 10.3389/fgene.2022.1034567. eCollection 2022. Front Genet. 2022. PMID: 36246657 Free PMC article.
Cited by
-
The role of non-coding RNAs in the regulation of cell death pathways in melanoma.Discov Oncol. 2025 Jun 11;16(1):1063. doi: 10.1007/s12672-025-02888-3. Discov Oncol. 2025. PMID: 40500552 Free PMC article. Review.
-
Ferroptosis-related LncRNAs in diseases.BMC Biol. 2025 Jun 6;23(1):158. doi: 10.1186/s12915-025-02268-x. BMC Biol. 2025. PMID: 40481573 Free PMC article. Review.
-
Evaluation of Ferroptosis as a Biomarker to Predict Treatment Outcomes of Cancer Immunotherapy.Cancer Res Commun. 2025 Aug 1;5(8):1288-1297. doi: 10.1158/2767-9764.CRC-25-0268. Cancer Res Commun. 2025. PMID: 40693608 Free PMC article.
-
Machine learning-derived identification of tumor-infiltrating immune cell-related signature for improving prognosis and immunotherapy responses in patients with skin cutaneous melanoma.Cancer Cell Int. 2023 Sep 26;23(1):214. doi: 10.1186/s12935-023-03048-9. Cancer Cell Int. 2023. PMID: 37752452 Free PMC article.
-
Identification of lncRNAs involved in response to ionizing radiation in fibroblasts of long-term survivors of childhood cancer and cancer-free controls.Front Oncol. 2023 Apr 27;13:1158176. doi: 10.3389/fonc.2023.1158176. eCollection 2023. Front Oncol. 2023. PMID: 37182169 Free PMC article.
References
LinkOut - more resources
Full Text Sources
Research Materials