Review
. 2022 Jul 22:16:898300.
doi: 10.3389/fnhum.2022.898300. eCollection 2022.

2020 International brain-computer interface competition: A review

Affiliations
Review

2020 International brain-computer interface competition: A review

Ji-Hoon Jeong et al. Front Hum Neurosci. .

Abstract

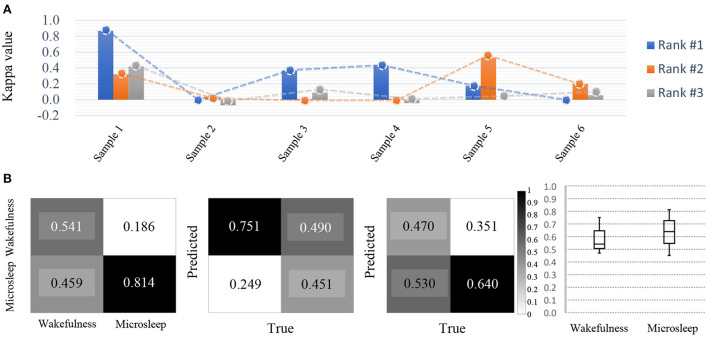
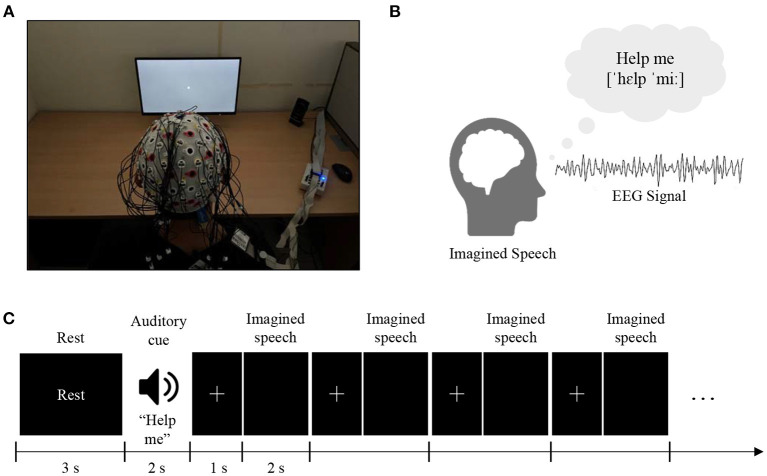
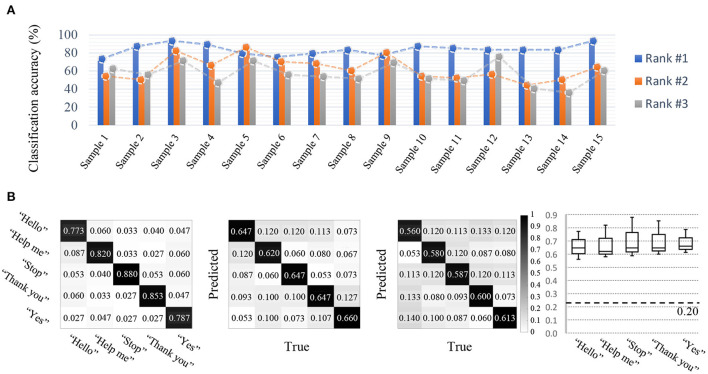
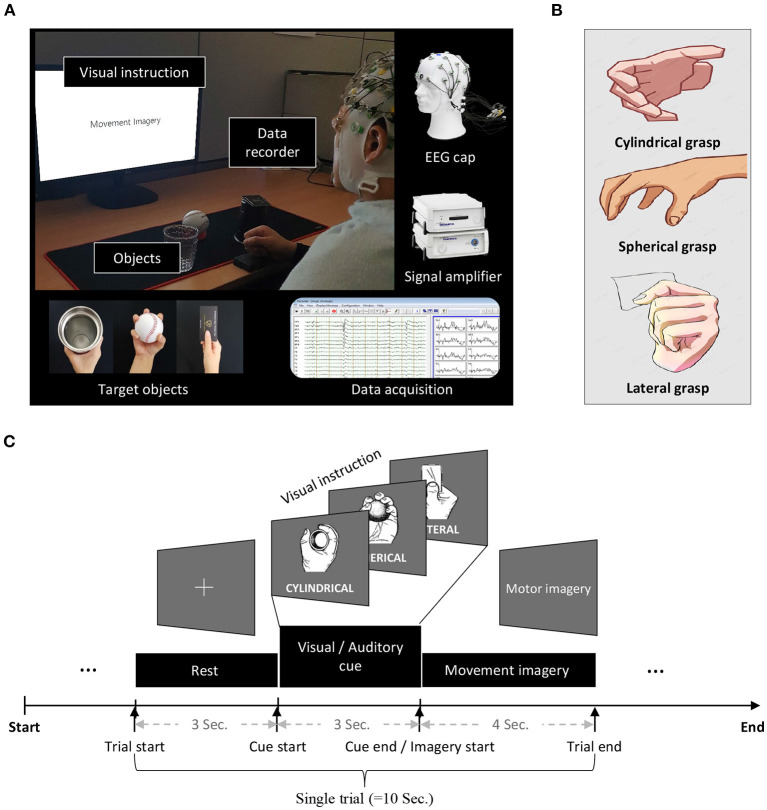
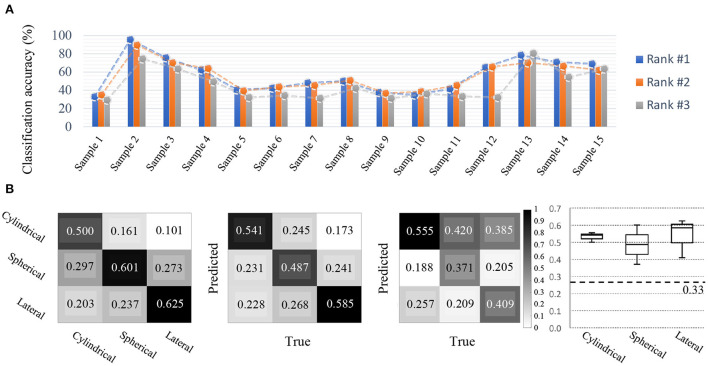
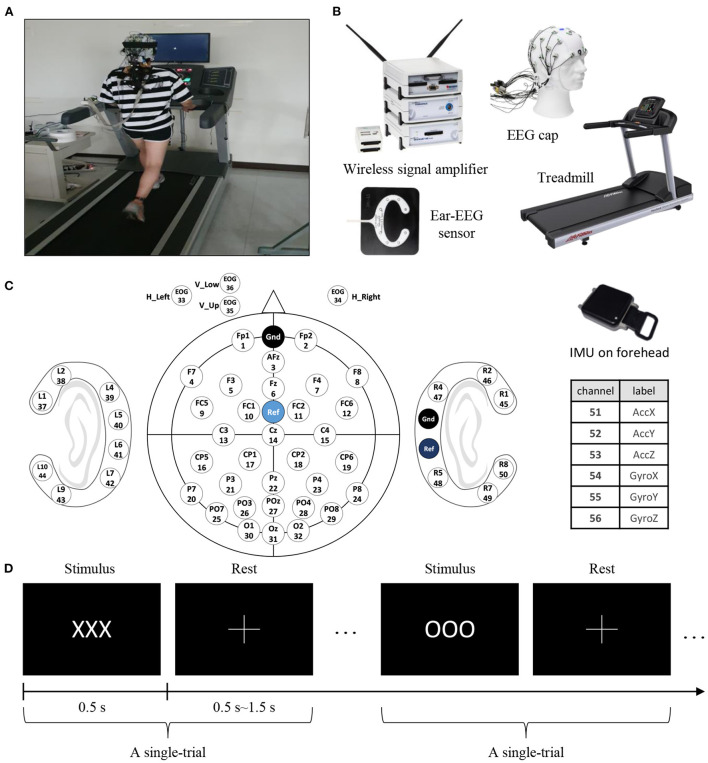
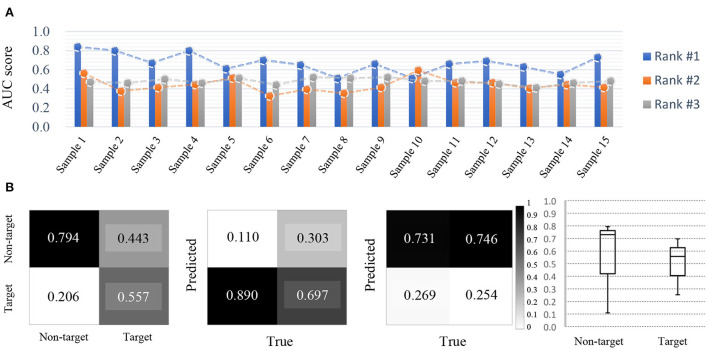
The brain-computer interface (BCI) has been investigated as a form of communication tool between the brain and external devices. BCIs have been extended beyond communication and control over the years. The 2020 international BCI competition aimed to provide high-quality neuroscientific data for open access that could be used to evaluate the current degree of technical advances in BCI. Although there are a variety of remaining challenges for future BCI advances, we discuss some of more recent application directions: (i) few-shot EEG learning, (ii) micro-sleep detection (iii) imagined speech decoding, (iv) cross-session classification, and (v) EEG(+ear-EEG) detection in an ambulatory environment. Not only did scientists from the BCI field compete, but scholars with a broad variety of backgrounds and nationalities participated in the competition to address these challenges. Each dataset was prepared and separated into three data that were released to the competitors in the form of training and validation sets followed by a test set. Remarkable BCI advances were identified through the 2020 competition and indicated some trends of interest to BCI researchers.

Keywords: brain-computer interface (BCI); competition; electroencephalogram; neural decoding; open datasets.


Figures

Figure 1
Figure 1
Overview of noninvasive BCI. Every BCI begins its analysis with meaningful feature extraction through signal processing, starting with data recording. Researchers decode EEG data collected from experimental environments suitable for each study using advanced methodologies to develop BCI applications.
Figure 2
Figure 2
Experimental setup and protocol. (A) During the experiment, the subjects were seated comfortably in a chair with armrests at 60 (±5) cm in front of a 21-inch LCD monitor. (B) EEG signals were measured using brainwave collection equipment (BrainAmp, BrainProducts GmbH, Germany) and data recorders (BrainVision, BrainProducts GmbH, Germany). (C) In the experimental paradigm, for all blocks, the first 3 s of each trial began with a fixation cross that appeared at the center of the monitor to prepare subjects for the MI task. Afterward, the subject performed the imagery task using the appropriate hand for 4 s when a right or left arrow appeared as a visual cue. After each task, the screen remained blank for 6 s. The given data set provides only 4 s MI tasks.
Figure 3
Figure 3
Competition outcomes. (A) Decoding results on short-calibration BCI (Accuracy), where the difference between the top performer and the other two performers are significant, but the difference between the second and third places is not significant. All participants demonstrate consistent decoding performance regarding the samples used. For short-calibration BCI, both right-hand MI and left-hand MI classes were used. (B) Despite using a small amount of data, on average, the true positive rate and performance were approximately 0.200 (20%) higher than the chance rate.
Figure 4
Figure 4
Overview of training data from modified Sleep-EDF dataset. In Data Set-B, an open dataset was modified to provide large sleep stage data, unlike other competition tracks. (A) Total number of samples according to classes in the training set. For this competition, we selected a total of 50 EEG data from 20 males and 30 females, excluding missing data and subjects outside the range of 25–56 years of age. (B) Spectrogram of DataSample01 based on classes. From top to bottom, the figure represents the average spectrogram for Wake, NREM1, NREM2, NREM3, and NREM4 states (PSD: power spectral density). (C) Hypnogram of DataSample01. (PSD, power spectral density).
Figure 5
Figure 5
Experimental setup and protocol corresponding to validation and test data. (A) Provides an experimental environment that simulates 3D driving while wearing the EEG cap. (B) Locations of electrodes for recording EEG. Pz and Oz were used to detect micro-sleep. (C) The experiment was conducted for approximately 1 h, and the subjects were evaluated based on the Karolinska sleepiness scale (KSS) 13 times, which was used to indicate their drowsiness level while driving.
Figure 6
Figure 6
Competition outcomes. (A) Micro-sleep detection results (kappa value) and achieved decoding performance indicating large deviations among participants. All participants show relatively large decoding performance deviations for each sample. (B) For micro-sleep detection, despite being the top-ranked models, detection accuracy is still insufficient and there is a large deviation in the performance achieved by each participant (based on Cohen's kappa value).
Figure 7
Figure 7
Experimental setups and protocols. (A) The subjects were seated in a comfortable chair in front of a 24-inch LCD monitor screen and were instructed to imagine the silent pronunciation of the given word as if they were performing real speech, without moving any articulators or making the sound. (B) Five critical main words/phrases for basic communication (“hello,” “help me,” “stop,” “thank you,” and “yes”) were selected. Seventy trials per class (70× 5 = 350 trials) are released for training (60 trials per class) and validation (10 trials per class) purposes. (C) An auditory cue was randomly presented for 2 s, followed by 0.8–1.2 s of a cross mark. The subjects were instructed to perform imagined speech of the given cue as soon as the cross mark disappeared on the screen. Four cross marks and imagined speech phases were followed in a row per random cue. After performing the imagined speech four times, 3 s of the relaxation phase was given to clear the mind.
Figure 8
Figure 8
Competition outcomes. (A) Imagined speech BCI results (accuracy). (B) For imagined speech BCI, the true positive rate of every class demonstrated a true positive rate above the baseline, however, high variation was found among the different classes. In addition, the results showed different tendencies according to each participant's model.
Figure 9
Figure 9
Experimental setup and protocols. Dataset was recorded under three sessions, and the datasets from the first two sessions (day 1 and day 2) was released for training purposes. The test data released later to competitors was obtained in the third session. (A) During a session of the experiment, subjects were seated in a comfortable chair in front of a 24-inch LCD monitor screen. (B) Three designated objects (cup, ball, and card) were placed on the screen, and a visual cue (a flashing green circle around the targeted object) indicated what grasping motion the subject should imagine. (C) A single trial comprised three continuous stages, which posed a designated task to the subjects. These experimental stages were rest, preparation, and performance of movement imagery. A single trial lasting 10 s consisted of three sub-stages, which were 3, 3, and 4 s in duration, respectively. The subject performed motor imagery during the 4 s stage after the visual cue was provided.
Figure 10
Figure 10
Competition outcomes. (A) Cross-session BCI results (Accuracy). Compared to other disciplines, all participants achieved relatively good decoding performance. For cross-session BCI, various grasping MIs using a single-arm were performed, and the top-3 BCI model performances during various sessions were acceptable per each class. (B) Confusion metrices for each class and candle plot for comparison. Based on the results of the top-3 participants, the prediction by class and the true answer rate are organized into confusion metrics. From the left, metrices showing which class was predicted more accurately by Rank 1, Rank 2, and Rank 3 participants. The candle plot on the far right corresponds to classes Cylindrical, Spherical, and Lateral, respectively, from the left, and representing the mean and standard deviation of the classification results achieved by the top-3 participants by class.
Figure 11
Figure 11
Experimental setups and protocols. (A) Experimental setup showing a subject walking on a treadmill. (B) In this experiment, we simultaneously collected data from various devices: EEG signals from the scalp (actiCap, BrainProducts GmbH, Germany), EEG signals from around the ear (cEEGrid, TMSi, USA), forehead IMU signals (APDM, APDM wearable technologies, USA), and from the treadmill. (C) Channel labels: 32 scalp-EEG electrodes, 3 EOG electrodes, and 6 IMU sensors. (D) The experimental paradigm was executed with target (“OOO”) and non-target (“XXX”) characters. The ratio of targets was 0.2 and the number of total trials was 300. In a trial, a stimulus was presented for 0.5 s followed by the cross symbol indicating a random rest period lasting 0.5–1.5 s.
Figure 12
Figure 12
Competition outcomes. (A) Ambulatory BCI results (AUC score). Rank #1 and #2 show relatively large performance deviation for each sample. (B) Overall, the results tended to distinguish between target and non-target class, and rank #1 showed high AUC scores in the ambulatory environment.

Similar articles

Cited by

References

    1. Abiri R., Borhani S., Sellers E. W., Jiang Y., Zhao X. (2019). A comprehensive review of EEG-based brain-computer interface paradigms. J. Neural Eng. 16, 011001. 10.1088/1741-2552/aaf12e - DOI - PubMed
    1. Abu-Rmileh A., Zakkay E., Shmuelof L., Shriki O. (2019). Co-adaptive training improves efficacy of a multi-day EEG-based motor imagery BCI training. Front. Human Neurosci. 13, 362. 10.3389/fnhum.2019.00362 - DOI - PMC - PubMed
    1. Aghajani H., Garbey M., Omurtag A. (2017). Measuring mental workload with EEG+ fNIRS. Front. Hum. Neurosci. 11, 359. 10.3389/fnhum.2017.00359 - DOI - PMC - PubMed
    1. Ahn M., Ahn S., Hong J. H., Cho H., Kim K., Kim B. S., et al. . (2013). Gamma band activity associated with BCI performance: simultaneous MEG/EEG study. Front. Hum. Neurosci. 7, 848. 10.3389/fnhum.2013.00848 - DOI - PMC - PubMed
    1. An S., Kim S., Chikontwe P., Park S. H. (2020). “Few-shot relation learning with attention for EEG-based motor imagery classification,” in 2020 IEEE/RSJ International Conference on Intelligent Robots and Systems (IROS) (Las Vegas, NV: IEEE; ), 10933–10938.

LinkOut - more resources