Gene expression patterns associated with multidrug therapy in multibacillary leprosy
- PMID: 35937686
- PMCID: PMC9354612
- DOI: 10.3389/fcimb.2022.917282
Gene expression patterns associated with multidrug therapy in multibacillary leprosy
Abstract
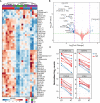
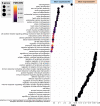
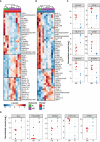
Multidrug therapy (MDT) has been successfully used in the treatment of leprosy. However, although patients are cured after the completion of MDT, leprosy reactions, permanent disability, and occasional relapse/reinfection are frequently observed in patients. The immune system of multibacillary patients (MB) is not able to mount an effective cellular immune response against M. leprae. Consequently, clearance of bacilli from the body is a slow process and after 12 doses of MDT not all MB patients reduce bacillary index (BI). In this context, we recruited MB patients at the uptake and after 12-month of MDT. Patients were stratified according to the level of reduction of the BI after 12 doses MDT. A reduction of at least one log in BI was necessary to be considered a responder patient. We evaluated the pattern of host gene expression in skin samples with RNA sequencing before and after MDT and between samples from patients with or without one log reduction in BI. Our results demonstrated that after 12 doses of MDT there was a reduction in genes associated with lipid metabolism, inflammatory response, and cellular immune response among responders (APOBEC3A, LGALS17A, CXCL13, CXCL9, CALHM6, and IFNG). Also, by comparing MB patients with lower BI reduction versus responder patients, we identified high expression of CDH19, TMPRSS4, PAX3, FA2H, HLA-V, FABP7, and SERPINA11 before MDT. From the most differentially expressed genes, we observed that MDT modulates pathways related to immune response and lipid metabolism in skin cells from MB patients after MDT, with higher expression of genes like CYP11A1, that are associated with cholesterol metabolism in the group with the worst response to treatment. Altogether, the data presented contribute to elucidate gene signatures and identify differentially expressed genes associated with MDT outcomes in MB patients.
Keywords: bacillary load; gene signature; lipid metabolism; multibacillary leprosy; multidrug therapy.
Copyright © 2022 Ferreira, Leal-Calvo, Mendes, Avanzi, Busso, Benjak, Sales, Ferreira, de Berrêdo-Pinho, Cole, Sarno, Moraes and Pinheiro.
Conflict of interest statement
The authors declare that the research was conducted in the absence of any commercial or financial relationships that could be construed as a potential conflict of interest.
Figures


References
-
- Cambau E., Williams D. L. (2019). “Anti-leprosy drugs: Modes of action and mechanisms of resistance in mycobacterium leprae,” in International textbook of leprosy. Eds. In Scollard D. M., Gillis T. P. Available at: www.internationaltextbookofleprosy.org.
-
- da Silva Prata R. B., de Mattos Barbosa M. G., Andrade Silva B. J., da Paixão Oliveira J. A., Bittencourt T. L., Pinheiro R. O. (2019). Macrophages in the pathogenesis of leprosy. In: Macrophages activation – biology and disease (United Kingdom: Intech Open; ), 1–19. doi: 10.5772/INTECHOPEN.88754IntechOpen - DOI
Publication types
MeSH terms
Substances
LinkOut - more resources
Full Text Sources
Medical
Research Materials
Miscellaneous

