. 2022 Jul 22:12:942951.
doi: 10.3389/fcimb.2022.942951. eCollection 2022.

GDF15 and ACE2 stratify COVID-19 patients according to severity while ACE2 mutations increase infection susceptibility

Affiliations

GDF15 and ACE2 stratify COVID-19 patients according to severity while ACE2 mutations increase infection susceptibility

Margalida Torrens-Mas et al. Front Cell Infect Microbiol. .

Abstract

Coronavirus disease 19 (COVID-19) is a persistent global pandemic with a very heterogeneous disease presentation ranging from a mild disease to dismal prognosis. Early detection of sensitivity and severity of COVID-19 is essential for the development of new treatments. In the present study, we measured the levels of circulating growth differentiation factor 15 (GDF15) and angiotensin-converting enzyme 2 (ACE2) in plasma of severity-stratified COVID-19 patients and uninfected control patients and characterized the in vitro effects and cohort frequency of ACE2 SNPs. Our results show that while circulating GDF15 and ACE2 stratify COVID-19 patients according to disease severity, ACE2 missense SNPs constitute a risk factor linked to infection susceptibility.

Keywords: ACE2; COVID-19; GDF5; inflammation; mutations.


Conflict of interest statement

The authors declare that the research was conducted in the absence of any commercial or financial relationships that could be construed as a potential conflict of interest.

Figures

Figure 1
Figure 1
Differences in circulating GDF15 and ACE2 levels in COVID-19 patients and a uninfected control group. (A) GDF15 levels; (B) ACE2 levels; (C) ratio GDf15/ACE2; The box plots represent the maximum and minimum levels (whiskers), the upper and lower quartiles, and the median. The length of each box represents the interquartile range. Dots represent outliers. Statistical significance between groups was determined using the ANOVA test. **p <0.001, #p <0.001 UCI vs Control, n/s (non significant); GDF15 (Growth differentiation factor 15); ACE2 (angiotensin-converting enzyme 2).
Figure 2
Figure 2
Representative scatterplot showing the association between GDF15 and ACE2 levels. Results of the 72 subjects are shown. Each dot represents an individual value. The solid blue line represents the regression line. The grey shade represents the confidence interval.
Figure 3
Figure 3
Representative scatterplots showing the association between GDF15 and ACE2 levels with age. GDF15 is positive associated with age (A), while ACE2 is not correlated with age (B). Each dot represents an individual value. The solid blue line represents the regression line. The grey shade represents the confidence interval.
Figure 4
Figure 4
Differences in circulating GDF15 (A) and ACE2 levels (B) by sex in COVID-19 patients and the uninfected control group. No differences were found by sex in GDF15 and ACE levels. The box plots represent the maximum and minimum levels (whiskers), the upper and lower quartiles, and the median. The length of each box represents the interquartile range. Dots represent outliers. Statistical significance between groups was determined using the ANOVA test.
Figure 5
Figure 5
ACE2 mRNA levels in COVID-19 patients and the uninfected control group. The box plots represent the maximum and minimum levels (whiskers), the upper and lower quartiles, and the median. The length of each box represents the interquartile range. Dots represent outliers. Statistical significance between groups was determined using the ANOVA test. **p <0.001, #p <0.001 UCI vs Control, n/s (non significant); ACE2 (angiotensin-converting enzyme 2).
Figure 6
Figure 6
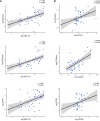
Representative scatterplots (spearman correlations) showing the association between GDF15 (A) and ACE2 levels (B) with classical inflammatory markers.The solid line represents the regression line. The grey shade represents the confidence interval.
Figure 7
Figure 7
mtDNA and HIF1 alpha mRNA levels in COVID-19 patients and the uninfected control group. The box plots represent the maximum and minimum levels (whiskers), the upper and lower quartiles, and the median. The length of each box represents the interquartile range. Dots represent outliers. Statistical significance between groups was determined using the ANOVA test. No difference were found in mtDNA and HIF1 alpha mRNA levels among groups.
Figure 8
Figure 8
Principal Component Analysis (PCA). To test potential associations between the studied parameters,a PCA was computed, showing a clear distinction between COVID-19 patients and uninfected control subjects.
Figure 9
Figure 9
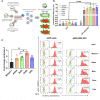
Differential SARS-CoV-2 infection is dependent on COVID19 variant-of-concern and ACE2 expression. (A) SARS-CoV-2 cell entry assay strategy: Lentiviral-based replication-defective pseudovirus were generated in HEK293T cells from lentiviral parental genes, SARS-CoV-2 Spike and encapsulating a mCherry reporter. Since the entry steps of the SARS-CoV-2 pseudovirions are governed by the coronavirus Spike protein at their surface, they enter cells in a similar fashion to native counterparts. A549 airway cells were transfected with exogenous GFP-hACE2 enabling SARS-CoV-2 pseudovirus to effectively infect the cells with mCherry reporter. Double-positive GFP/mCherry cells were quantified by flow cytometry to assess viral infection capacity. (B,C) Following the strategy described in A, A549 cells expressing GFP-hACE2 were assayed for cell entry by SARS-CoV-2 pseudovirus expressing either empty vector (Δ Spike) or Spike protein corresponding to origin variant (Wuhan-1) or variants-of-concern Alpha, Beta, Delta or Zeta. A representative flow cytometry experiment is shown. Bars demonstrate mean and Standard Error of Mean while each data point represents a unique experiment; ****P < 0.0001; **P < 0.01; *P < 0.1 by two-tailed t-test.
Figure 10
Figure 10
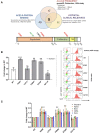
ACE2 polymorphisms K26R, P389 and N720D promote SARS-CoV-2 infection in all VOCs. (A) Studying the effect of ACE2 SNPs. Non-synonymous ACE2 single nucleotide polymorphism were selected among those fulfilling the triple criteria of high allelic frequency (Allele freq > 1.00e-4; Allele count > 20); involved in ACE2-claw S-protein RBD-binding interface and previously associated to clinical outcome. (B, C) Following the strategy described in Fig 9A, A549 cells expressing either GFP-ACE2 either WT or polymorphisms were assayed for cell entry by SARS-CoV-2 pseudovirus expressing either empty vector (Δ Spike) or Spike protein corresponding to origin variant (Wuhan-1) or variants-of-concern Alpha, Beta, Delta or Zeta. A representative flow cytometry experiment is shown. Bars demonstrate mean and Standard Error of Mean while each data point represents a unique experiment; ***P < 0.001, **P < 0.01, *P < 0.1, ns P >0.1 to WT by two-tailed t-test.
Figure 11
Figure 11
Infection-promoting ACE2 SNPs are a risk factor for COVID19 susceptibility. (A) Heatmap showing the distribution of ACE2 variants in the hospitalization severity groups. Coloured squares indicate de presence of the ACE2 variants. Red: Promoting; Green: Protective; Yellow: No-effect. (B) Frequencies of ACE2 SNPs among hospitalization severity groups. Bars represent frequencies of the SNP in each group (C) Frequencies of ACE2 SNPS among susceptibility groups.
Figure 12
Figure 12
GDF15 and ACE2 levels among ICU and non-ICU COVID-19 patients and ACE2 genotypes.
Figure 13
Figure 13
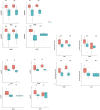
GDF15 and ACE2 levels by protective or promotive genotypes. Genotype 0 corresponding to subjects that did not carry any variant; Genotype 1, subjects that carry at least one promoting variant; Genotype 2, subjects that carry at least one protective variant; Genotype 3, subjects that carry at least one promoting and one protective variant ( Supplementary Table 5 ; Figure 13 ). We only found differences in the levels of the ACE2 mRNA (P<0.05).

Similar articles

Cited by

References

    1. Adela R., Banerjee S. K. (2015). GDF-15 as a target and biomarker for diabetes and cardiovascular diseases: a translational prospective. J. Diabetes Res. 2015, 490842. doi: 10.1155/2015/490842 - DOI - PMC - PubMed
    1. Ahmed D. S., Isnard S., Berini C., Lin J., Routy J. P., Royston L.. (2022). Coping with stress: the mitokine GDF-15 as a biomarker of COVID-19 severity. Front. Immunol. 13, 820350. doi: 10.3389/fimmu.2022.820350 - DOI - PMC - PubMed
    1. Albini A., Calabrone L., Carlini V., Benedetto N., Lombardo M., Bruno A., et al. . (2021). Preliminary evidence for IL-10-Induced ACE2 mRNA expression in lung-derived and endothelial cells: implications for SARS-Cov-2 ARDS pathogenesis. Front. Immunol. 12, 718136. doi: 10.3389/fimmu.2021.718136 - DOI - PMC - PubMed
    1. AlGhatrif M., Tanaka T., Moore A. Z., Bandinelli S., Lakatta E. G., Ferrucci L.. (2021). Age-associated difference in circulating ACE2, the gateway for SARS-COV-2, in humans: results from the InCHIANTI study. GeroScience 43 (2), 619–627. doi: 10.1007/s11357-020-00314-w - DOI - PMC - PubMed
    1. Baker S. A., Kwok S., Berry G. J., Montine TJ. (2021). Angiotensin-converting enzyme 2 (ACE2) expression increases with age in patients requiring mechanical ventilation. PLoS One 16 (2), e0247060. doi: 10.1371/journal.pone.0247060 - DOI - PMC - PubMed

MeSH terms

Substances