

CD8+T Cell-Related Gene Biomarkers in Macular Edema of Diabetic Retinopathy
- PMID: 35937822
- PMCID: PMC9355330
- DOI: 10.3389/fendo.2022.907396
CD8+T Cell-Related Gene Biomarkers in Macular Edema of Diabetic Retinopathy
Abstract
Background: CD8+T lymphocytes have a strong pro-inflammatory effect in all parts of the tissue, and some studies have demonstrated that its concentration in the vitreous increased significantly, suggesting that CD8+T cells play a pivotal role in the inflammatory response of diabetic retinopathy (DR). However, the infiltration of CD8+T cells in the DR retina, especially in diabetic macular edema (DME), and its related genes are still unclear.
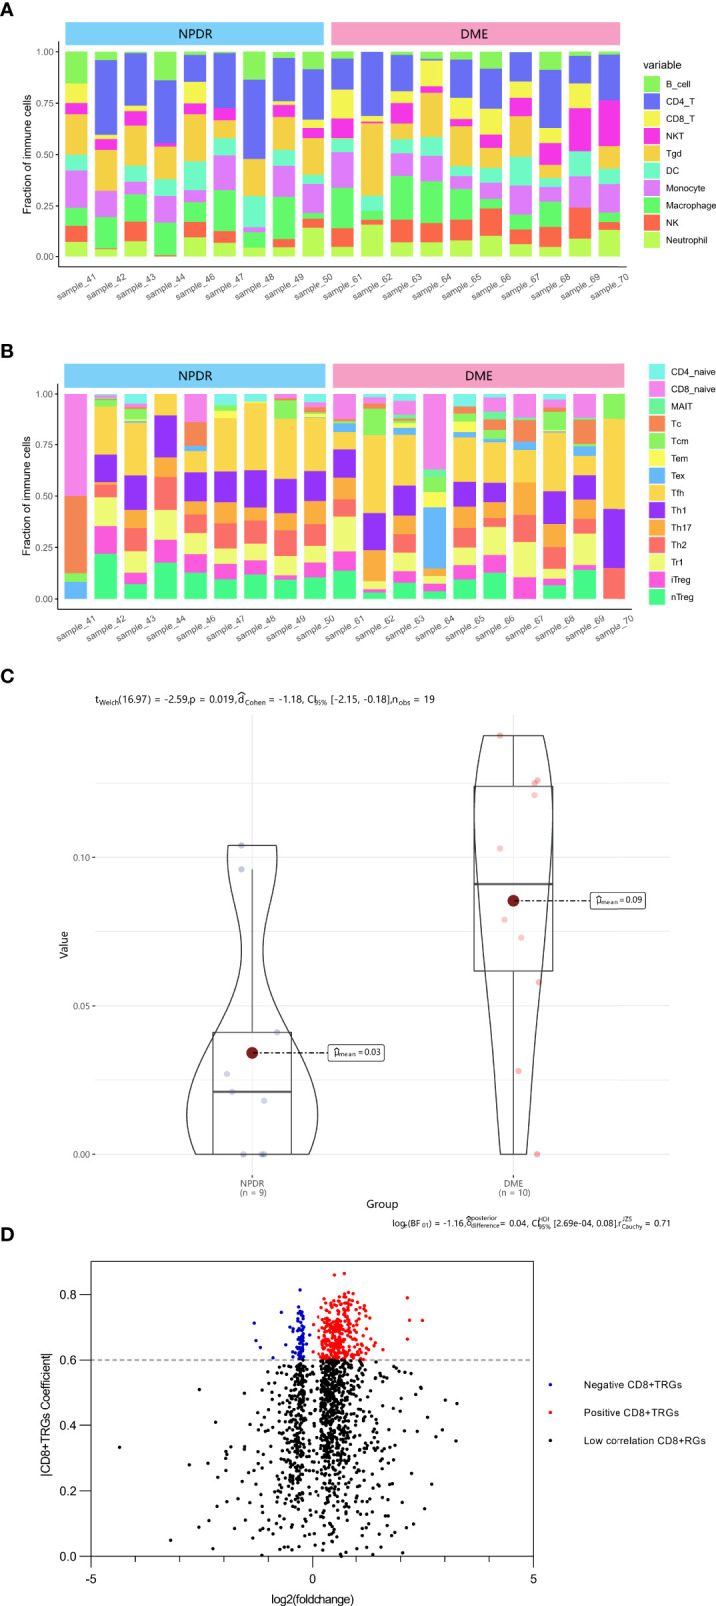
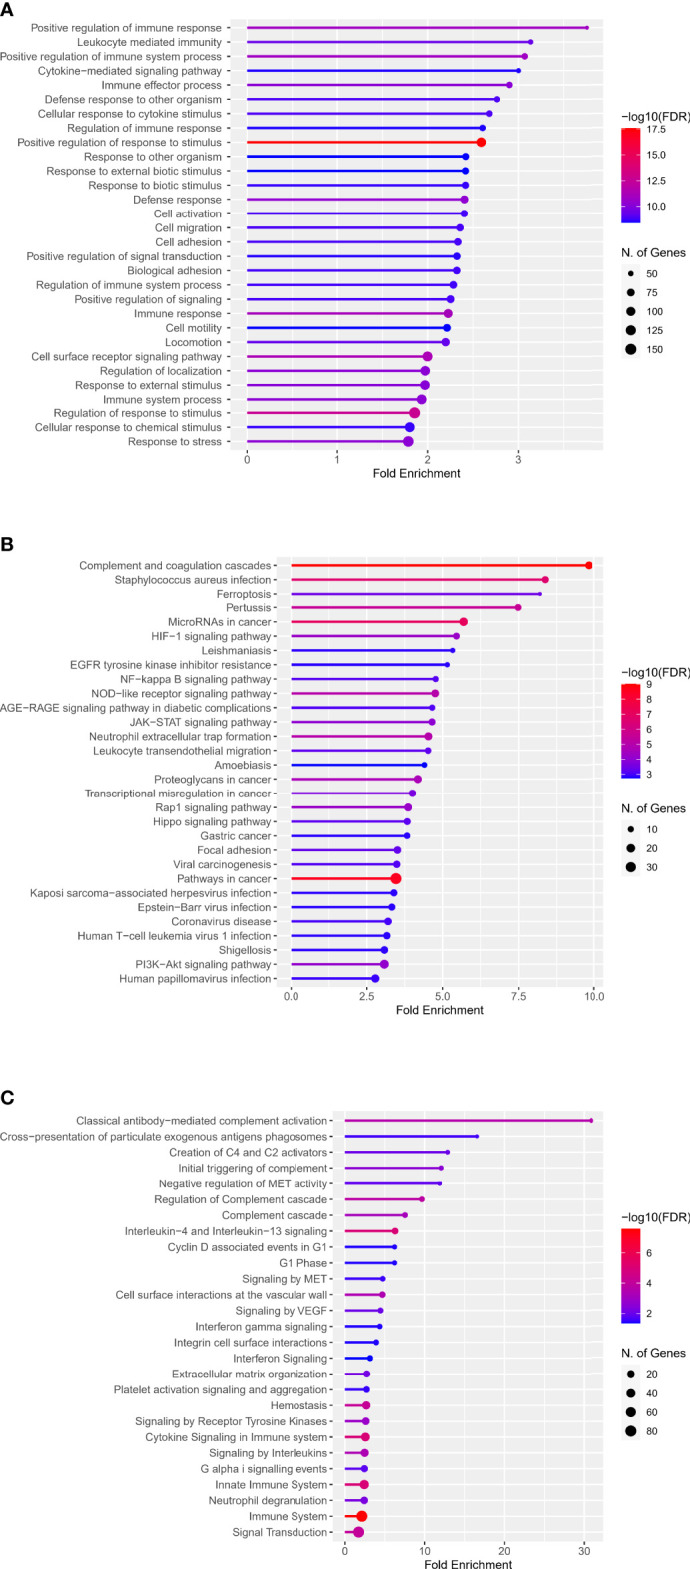
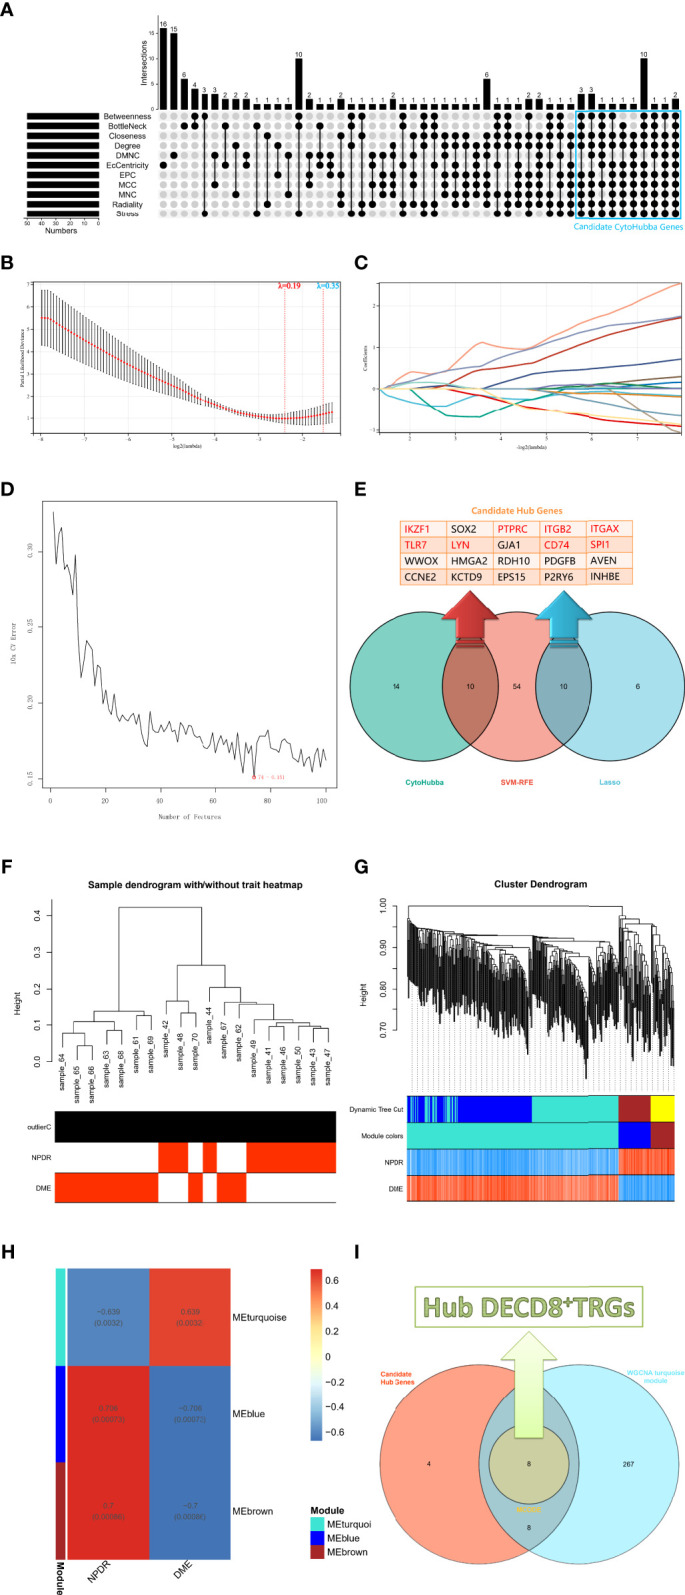
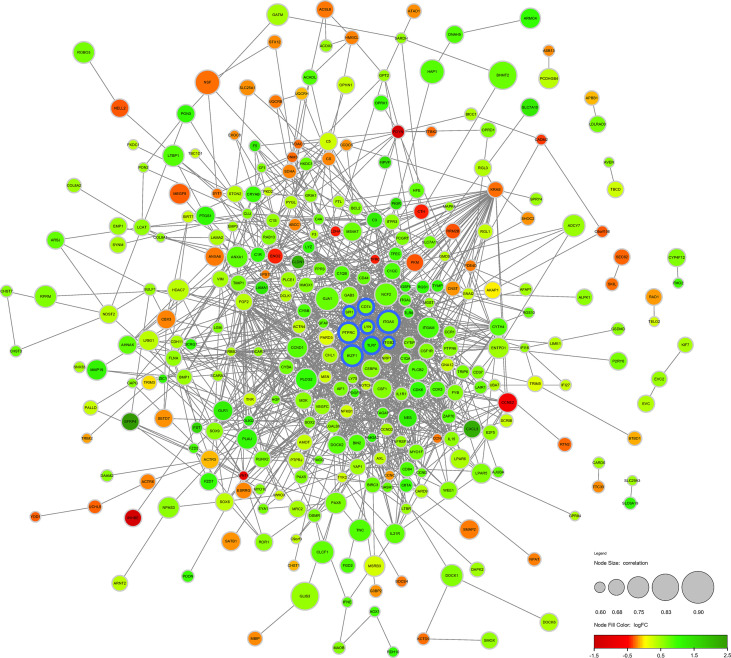
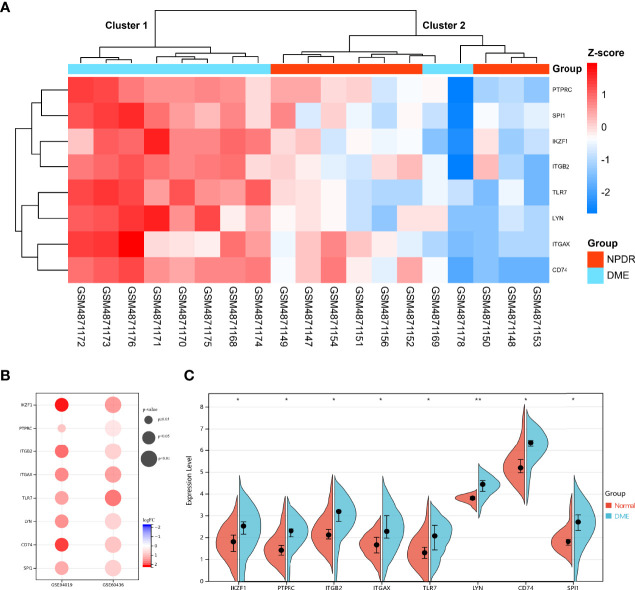
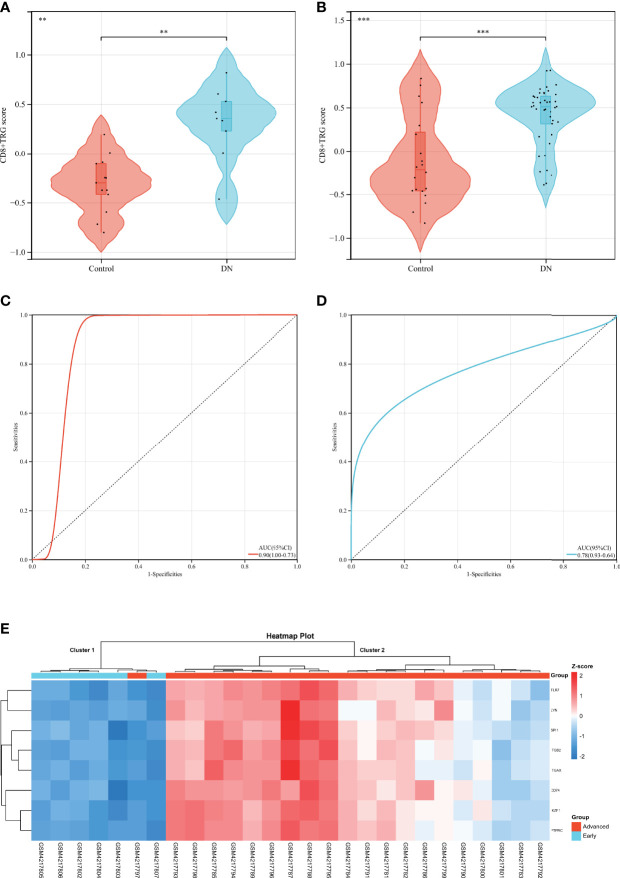
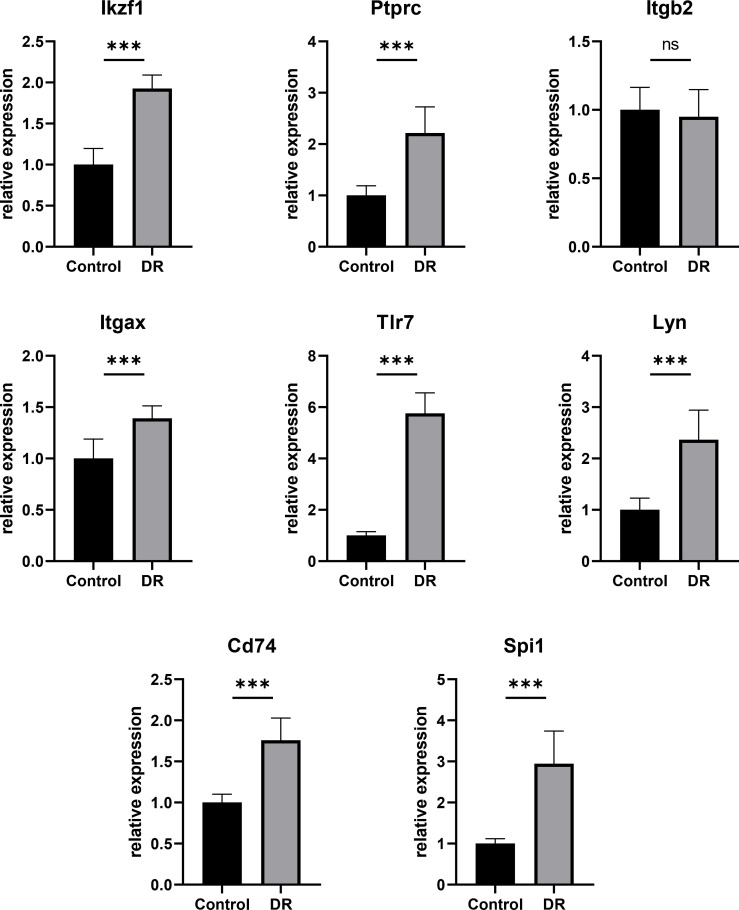
Methods: Download the GSE16036 dataset from the Gene Expression Omnibus (GEO) database. The ImmuCellAI program was performed to evaluate the abundance of 24 immune cells including CD8+T cells. The CD8+T cell-related genes (DECD8+TRGs) between non-proliferative diabetic retinopathy (NPDR) and DME were detected via difference analysis and correlation analysis. Enrichment analysis and protein-protein interaction (PPI) network mapping were implemented to explore the potential function of DECD8+TRGs. Lasso regression, support vector machine recursive feature elimination (SVM-RFE), CytoHubba plug-in and MCODE plug-in in Cytoscape software, and Weighted Gene Co-Expression Network Analysis (WGCNA) were performed to comprehensively analyze and obtain Hub DECD8+TRGs. Hub DECD8+TRGs expression patterns were further validated in other two DR-related independent datasets. The CD8+TRG score was defined as the genetic characterization of Hub DECD8+TRGs using the GSVA sample scoring method, which can be administered to distinguish early and advanced diabetic nephropathy (DN) as well as normal and DN. Finally, the transcription level of DECD8+TRGs in DR model mouse were verified by quantitative real-time PCR (qPCR).
Results: A total of 371 DECD8+TRGs were identified, of which 294 genes were positively correlated and only 77 genes were negatively correlated. Eight genes (IKZF1, PTPRC, ITGB2, ITGAX, TLR7, LYN, CD74, SPI1) were recognized as Hub DECD8+TRGs. DR and DN, which have strong clinical correlation, have been proved to be associated with CD8+T cell-related hub genes by multiple independent data sets. Hub DECD8+TRGs can not only distinguish PDR from normal and DN from normal, but also play a role in the early and progressive stages of the two diseases (NPDR vs DME, Early DN vs Advanced DN). The qPCR transcription level and trend of Hub DECD8+TRGs in DR mouse model was basically the same as that in human transcriptome.
Conclusion: This study not only increases our understanding of the molecular mechanism of CD8+T cells in the progression of DME, but also expands people's cognitive vision of the molecular mechanism of crosstalk of CD8+T cells in the eyes and kidneys of patients with diabetes.
Keywords: CD8+T cell; bioinformatic analysis; biomarker; diabetic macular edema; diabetic retinopathy.
Copyright © 2022 Huang and Zhou.
Conflict of interest statement
The authors declare that the research was conducted in the absence of any commercial or financial relationships that could be construed as a potential conflict of interest.
Figures
Similar articles
-
Gene Biomarkers Related to Th17 Cells in Macular Edema of Diabetic Retinopathy: Cutting-Edge Comprehensive Bioinformatics Analysis and In Vivo Validation.Front Immunol. 2022 May 16;13:858972. doi: 10.3389/fimmu.2022.858972. eCollection 2022. Front Immunol. 2022. PMID: 35651615 Free PMC article.
-
Identification of the Relationship between Hub Genes and Immune Cell Infiltration in Vascular Endothelial Cells of Proliferative Diabetic Retinopathy Using Bioinformatics Methods.Dis Markers. 2022 Feb 3;2022:7231046. doi: 10.1155/2022/7231046. eCollection 2022. Dis Markers. 2022. PMID: 35154512 Free PMC article.
-
Identification of differential immune cells and related diagnostic genes in patients with diabetic retinopathy.Medicine (Baltimore). 2023 Sep 29;102(39):e35331. doi: 10.1097/MD.0000000000035331. Medicine (Baltimore). 2023. PMID: 37773794 Free PMC article.
-
Algorithms for Diagnosis of Diabetic Retinopathy and Diabetic Macula Edema- A Review.Adv Exp Med Biol. 2021;1307:357-373. doi: 10.1007/5584_2020_499. Adv Exp Med Biol. 2021. PMID: 32166636 Review.
-
Utilizing machine learning algorithms to identify biomarkers associated with diabetic nephropathy: A review.Medicine (Baltimore). 2024 Feb 23;103(8):e37235. doi: 10.1097/MD.0000000000037235. Medicine (Baltimore). 2024. PMID: 38394492 Free PMC article. Review.
Cited by
-
Single-Cell Sequencing Reveals the Expression of Immune-Related Genes in Macrophages of Diabetic Kidney Disease.Inflammation. 2024 Feb;47(1):227-243. doi: 10.1007/s10753-023-01906-2. Epub 2023 Sep 30. Inflammation. 2024. PMID: 37777674
-
Aspergillus fumigatus Extracellular Vesicles Display Increased Galleria mellonella Survival but Partial Pro-Inflammatory Response by Macrophages.J Fungi (Basel). 2023 May 4;9(5):541. doi: 10.3390/jof9050541. J Fungi (Basel). 2023. PMID: 37233252 Free PMC article.
-
Novel biomarkers and therapeutic approaches for diabetic retinopathy and nephropathy: Recent progress and future perspectives.Front Endocrinol (Lausanne). 2022 Nov 25;13:1065856. doi: 10.3389/fendo.2022.1065856. eCollection 2022. Front Endocrinol (Lausanne). 2022. PMID: 36506068 Free PMC article. Review.
-
Targeting mitophagy in diabetic retinopathy: novel insights into SQSTM1/BNIP3L pathway regulated by luteolin.Front Pharmacol. 2025 Jun 25;16:1593213. doi: 10.3389/fphar.2025.1593213. eCollection 2025. Front Pharmacol. 2025. PMID: 40635752 Free PMC article.
-
Using Bioinformatics and Machine Learning to Predict the Genetic Characteristics of Ferroptosis-Cuproptosis-Related Genes Associated with Sleep Deprivation.Nat Sci Sleep. 2024 Sep 24;16:1497-1513. doi: 10.2147/NSS.S473022. eCollection 2024. Nat Sci Sleep. 2024. PMID: 39347483 Free PMC article.
References
-
- Balaji R, Duraisamy R, Kumar M. Complications of Diabetes Mellitus: A Review. Drug Invention Today (2019) 12(1):98–103.
Publication types
MeSH terms
Substances
LinkOut - more resources
Full Text Sources
Medical
Research Materials
Miscellaneous