

The Effect of Sleep Restriction, With or Without Exercise, on Skeletal Muscle Transcriptomic Profiles in Healthy Young Males
- PMID: 35937838
- PMCID: PMC9355502
- DOI: 10.3389/fendo.2022.863224
The Effect of Sleep Restriction, With or Without Exercise, on Skeletal Muscle Transcriptomic Profiles in Healthy Young Males
Abstract
Background: Inadequate sleep is associated with many detrimental health effects, including increased risk of developing insulin resistance and type 2 diabetes. These effects have been associated with changes to the skeletal muscle transcriptome, although this has not been characterised in response to a period of sleep restriction. Exercise induces a beneficial transcriptional response within skeletal muscle that may counteract some of the negative effects associated with sleep restriction. We hypothesised that sleep restriction would down-regulate transcriptional pathways associated with glucose metabolism, but that performing exercise would mitigate these effects.
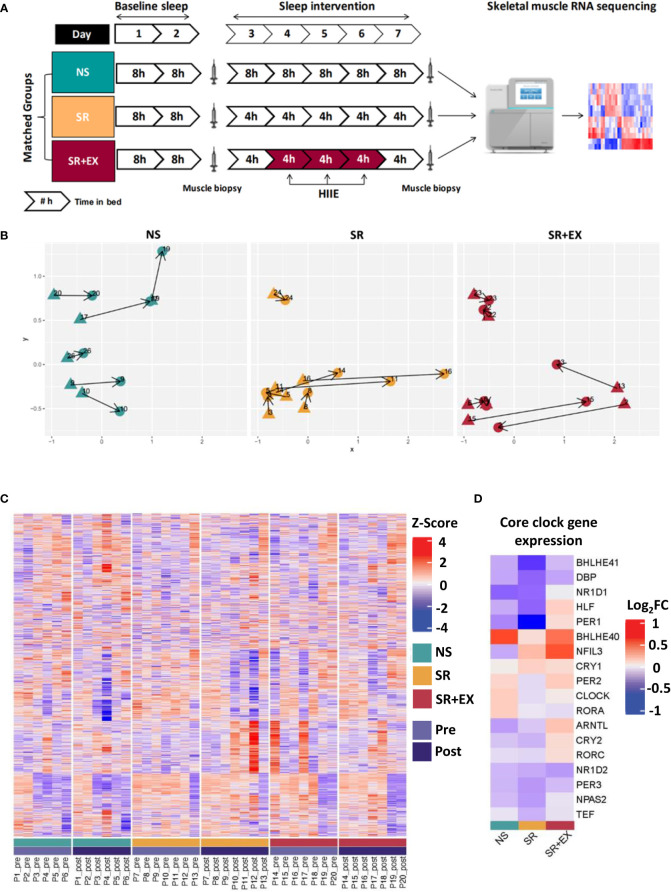
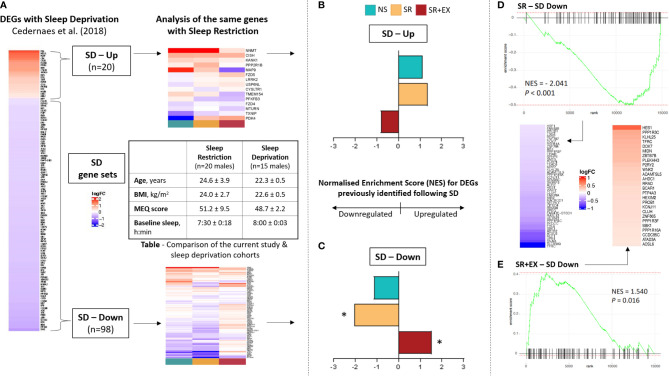
Methods: 20 healthy young males were allocated to one of three experimental groups: a Normal Sleep (NS) group (8 h time in bed per night (TIB), for five nights (11 pm - 7 am)), a Sleep Restriction (SR) group (4 h TIB, for five nights (3 am - 7 am)), and a Sleep Restriction and Exercise group (SR+EX) (4 h TIB, for five nights (3 am - 7 am) and three high-intensity interval exercise (HIIE) sessions (performed at 10 am)). RNA sequencing was performed on muscle samples collected pre- and post-intervention. Our data was then compared to skeletal muscle transcriptomic data previously reported following sleep deprivation (24 h without sleep).
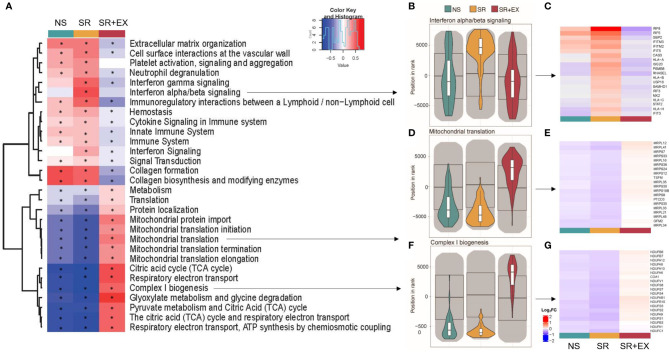
Results: Gene set enrichment analysis (GSEA) indicated there was an increased enrichment of inflammatory and immune response related pathways in the SR group post-intervention. However, in the SR+EX group the direction of enrichment in these same pathways occurred in the opposite directions. Despite this, there were no significant changes at the individual gene level from pre- to post-intervention. A set of genes previously shown to be decreased with sleep deprivation was also decreased in the SR group, but increased in the SR+EX group.
Conclusion: The alterations to inflammatory and immune related pathways in skeletal muscle, following five nights of sleep restriction, provide insight regarding the transcriptional changes that underpin the detrimental effects associated with sleep loss. Performing three sessions of HIIE during sleep restriction attenuated some of these transcriptional changes. Overall, the transcriptional alterations observed with a moderate period of sleep restriction were less evident than previously reported changes following a period of sleep deprivation.
Keywords: circadian rhythm; high-intensity interval exercise (HIE); inflammation; mitochondria; skeletal muscle; sleep loss; sleep restriction; transcriptomics.
Copyright © 2022 Lin, Saner, Weng, Caruana, Botella, Kuang, Lee, Jamnick, Pitchford, Garnham, Bartlett, Chen and Bishop.
Conflict of interest statement
The authors declare that the research was conducted in the absence of any commercial or financial relationships that could be construed as a potential conflict of interest.
Figures
Similar articles
-
Exercise mitigates sleep-loss-induced changes in glucose tolerance, mitochondrial function, sarcoplasmic protein synthesis, and diurnal rhythms.Mol Metab. 2021 Jan;43:101110. doi: 10.1016/j.molmet.2020.101110. Epub 2020 Oct 31. Mol Metab. 2021. PMID: 33137489 Free PMC article.
-
The effect of sleep restriction, with or without high-intensity interval exercise, on myofibrillar protein synthesis in healthy young men.J Physiol. 2020 Apr;598(8):1523-1536. doi: 10.1113/JP278828. Epub 2020 Mar 11. J Physiol. 2020. PMID: 32078168 Free PMC article.
-
The interactive effect of sustained sleep restriction and resistance exercise on skeletal muscle transcriptomics in young females.Physiol Genomics. 2024 Jul 1;56(7):506-518. doi: 10.1152/physiolgenomics.00010.2024. Epub 2024 May 20. Physiol Genomics. 2024. PMID: 38766755 Clinical Trial.
-
Effects of Acute Sleep Loss on Physical Performance: A Systematic and Meta-Analytical Review.Sports Med. 2022 Nov;52(11):2669-2690. doi: 10.1007/s40279-022-01706-y. Epub 2022 Jun 16. Sports Med. 2022. PMID: 35708888 Free PMC article.
-
Is exercise a viable therapeutic intervention to mitigate mitochondrial dysfunction and insulin resistance induced by sleep loss?Sleep Med Rev. 2018 Feb;37:60-68. doi: 10.1016/j.smrv.2017.01.001. Epub 2017 Jan 19. Sleep Med Rev. 2018. PMID: 29056415 Review.
Cited by
-
Effects of acute exercise or short-term exercise interventions on metabolic markers during experimentally-induced sleep loss in humans: A systematic literature review.J Sport Health Sci. 2025 Apr 23;14:101044. doi: 10.1016/j.jshs.2025.101044. Online ahead of print. J Sport Health Sci. 2025. PMID: 40280326 Free PMC article. Review.
-
Short Sleep Duration Disrupts Glucose Metabolism: Can Exercise Turn Back the Clock?Exerc Sport Sci Rev. 2024 Jul 1;52(3):77-86. doi: 10.1249/JES.0000000000000339. Epub 2024 Apr 12. Exerc Sport Sci Rev. 2024. PMID: 38608214 Free PMC article. Review.
-
Repurposed Nrf2 activator dimethyl fumarate rescues muscle inflammation and fibrosis in an aggravated mdx mouse model of Duchenne muscular dystrophy.Redox Biol. 2025 Jul;84:103676. doi: 10.1016/j.redox.2025.103676. Epub 2025 May 14. Redox Biol. 2025. PMID: 40381228 Free PMC article.
References
Publication types
MeSH terms
LinkOut - more resources
Full Text Sources
Medical
Research Materials
Miscellaneous