Neural Substrates of External and Internal Visual Sensations Induced by Human Intracranial Electrical Stimulation
- PMID: 35937874
- PMCID: PMC9355733
- DOI: 10.3389/fnins.2022.918767
Neural Substrates of External and Internal Visual Sensations Induced by Human Intracranial Electrical Stimulation
Abstract
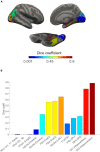
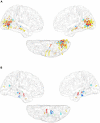
Offline perceptions are self-generated sensations that do not involve physical stimulus. These perceptions can be induced by external hallucinated objects or internal imagined objects. However, how the brain dissociates these visual sensations remains unclear. We aimed to map the brain areas involved in internal and external visual sensations induced by intracranial electrical stimulation and further investigate their neural differences. In this study, we collected subjective reports of internal and external visual sensations elicited by electrical stimulation in 40 drug-refractory epilepsy during presurgical evaluation. The response rate was calculated and compared to quantify the dissociated distribution of visual responses. We found that internal and external visual sensations could be elicited when different brain areas were stimulated, although there were more overlapping brain areas. Specifically, stimulation of the hippocampus and inferior temporal cortex primarily induces internal visual sensations. In contrast, stimulation of the occipital visual cortex mainly triggers external visual sensations. Furthermore, compared to that of the dorsal visual areas, the ventral visual areas show more overlap between the two visual sensations. Our findings show that internal and external visual sensations may rely on distinct neural representations of the visual pathway. This study indicated that implantation of electrodes in ventral visual areas should be considered during the evaluation of visual sensation aura epileptic seizures.
Keywords: epilepsy; hippocampus; inferior temporal cortex; intracranial electrical stimulation; offline perception.
Copyright © 2022 Li, Tan, Wang, Wang and Wang.
Conflict of interest statement
The authors declare that the research was conducted in the absence of any commercial or financial relationships that could be construed as a potential conflict of interest.
Figures


Similar articles
-
Mapping of functional organization in human visual cortex: electrical cortical stimulation.Neurology. 2000 Feb 22;54(4):849-54. doi: 10.1212/wnl.54.4.849. Neurology. 2000. PMID: 10690975
-
Visceral and emotional responses to direct electrical stimulations of the cortex.Ann Clin Transl Neurol. 2023 Jan;10(1):5-17. doi: 10.1002/acn3.51694. Epub 2022 Nov 24. Ann Clin Transl Neurol. 2023. PMID: 36424874 Free PMC article.
-
Auditory brainstem implant: electrophysiologic responses and subject perception.Ear Hear. 2015 May-Jun;36(3):368-76. doi: 10.1097/AUD.0000000000000126. Ear Hear. 2015. PMID: 25437141 Free PMC article.
-
Human brain plasticity: evidence from sensory deprivation and altered language experience.Prog Brain Res. 2002;138:177-88. doi: 10.1016/S0079-6123(02)38078-6. Prog Brain Res. 2002. PMID: 12432770 Review.
-
Role of intradental A- and C-type nerve fibres in dental pain mechanisms.Proc Finn Dent Soc. 1992;88 Suppl 1:507-16. Proc Finn Dent Soc. 1992. PMID: 1508908 Review.
Cited by
-
Toward a personalized closed-loop stimulation of the visual cortex: Advances and challenges.Front Cell Neurosci. 2022 Dec 13;16:1034270. doi: 10.3389/fncel.2022.1034270. eCollection 2022. Front Cell Neurosci. 2022. PMID: 36582211 Free PMC article.
-
Electrophysiological Signatures of Visual Sensations Elicited by Direct Electrical Stimulation.Neurosci Bull. 2025 Jul 23. doi: 10.1007/s12264-025-01464-7. Online ahead of print. Neurosci Bull. 2025. PMID: 40699543
References
LinkOut - more resources
Full Text Sources
Miscellaneous

