. 2022 Jul 22:16:931328.
doi: 10.3389/fnins.2022.931328. eCollection 2022.

Reduced Ca2+ transient amplitudes may signify increased or decreased depolarization depending on the neuromodulatory signaling pathway

Affiliations

Reduced Ca2+ transient amplitudes may signify increased or decreased depolarization depending on the neuromodulatory signaling pathway

Arunima Debnath et al. Front Neurosci. .

Abstract

Neuromodulators regulate neuronal excitability and bias neural circuit outputs. Optical recording of neuronal Ca2+ transients is a powerful approach to study the impact of neuromodulators on neural circuit dynamics. We are investigating the polymodal nociceptor ASH in Caenorhabditis elegans to better understand the relationship between neuronal excitability and optically recorded Ca2+ transients. ASHs depolarize in response to the aversive olfactory stimulus 1-octanol (1-oct) with a concomitant rise in somal Ca2+, stimulating an aversive locomotory response. Serotonin (5-HT) potentiates 1-oct avoidance through Gαq signaling, which inhibits L-type voltage-gated Ca2+ channels in ASH. Although Ca2+ signals in the ASH soma decrease, depolarization amplitudes increase because Ca2+ mediates inhibitory feedback control of membrane potential in this context. Here, we investigate octopamine (OA) signaling in ASH to assess whether this negative correlation between somal Ca2+ and depolarization amplitudes is a general phenomenon, or characteristic of certain neuromodulatory pathways. Like 5-HT, OA reduces somal Ca2+ transient amplitudes in ASH neurons. However, OA antagonizes 5-HT modulation of 1-oct avoidance behavior, suggesting that OA may signal through a different pathway. We further show that the pathway for OA diminution of ASH somal Ca2+ consists of the OCTR-1 receptor, the Go heterotrimeric G-protein, and the G-protein activated inwardly rectifying channels IRK-2 and IRK-3, and this pathway reduces depolarization amplitudes in parallel with somal Ca2+ transient amplitudes. Therefore, even within a single neuron, somal Ca2+ signal reduction may indicate either increased or decreased depolarization amplitude, depending on which neuromodulatory signaling pathways are activated, underscoring the need for careful interpretation of Ca2+ imaging data in neuromodulatory studies.

Keywords: Ca2+ dynamics; depolarization; graded potentials; neuromodulation; signal integration.


Conflict of interest statement

The authors declare that the research was conducted in the absence of any commercial or financial relationships that could be construed as a potential conflict of interest.

Figures

FIGURE 1
FIGURE 1
OA reverses 5-HT modulation of 1-oct avoidance behavior but does not reverse 5-HT modulation of somal Ca2+ transients in ASH. (A) Representative traces of ASH somal Ca2+ transients in response to 1-oct exposure in control (far left), OA, 5-HT, and 5-HT + OA treated worms. Gray boxes represent duration of 1-oct exposure. (B) Quantification of 5-HT and OA effects on 1-oct-induced ASH somal Ca2+ transients. (C) OA antagonizes 5-HT potentiation of 1-oct avoidance behavior (30% 1-oct stimulus). *Significantly different from untreated control (p < 0.0001, ANOVA). N.S., not significantly different compared with untreated control (p > 0.05, ANOVA). ΔF/Fo, change in fluorescence relative to original fluorescence intensity. Values are mean ± SD. Numbers within bars indicate n.
FIGURE 2
FIGURE 2
OCTR-1 and GOA-1 are required for OA effects on 1-oct-stimulated avoidance behavior and ASH somal Ca2+ signals. (A) OA fails to antagonize the 5-HT potentiation of aversive behavior in octr-1 null mutants. (B) OA fails to inhibit ASH somal Ca2+ transients in octr-1 null mutants. (C) The ability of OA to reverse 5-HT signaling is evident in wild type animals (left three bars), but absent in ASH::PTX animals (right three bars) (30% 1-oct stimulus). 5-HT signaling is unaffected in ASH::PTX animals. (D) OA does not inhibit ASH somal Ca2+ transients in goa-1 null mutants. *Significantly different from untreated control (p < 0.0001, ANOVA). N.S., not significantly different compared with untreated control (p > 0.05, unpaired t-test). ΩSignificantly different from untreated wild type (p < 0.0001, ANOVA). ΨSignificantly different from 5-HT treated wild type (p < 0.0001, ANOVA) but not significantly different from untreated wild type (p > 0.05, ANOVA). Significantly different from untreated ASH::PTX animals (p < 0.0001, ANOVA) but not significantly different from 5-HT treated wild type. φNot significantly different from 5-HT treated ASH::PTX animals (p > 0.05, ANOVA) but significantly different from untreated ASH::PTX animals (p < 0.0001, ANOVA. Values are mean ± SD. Numbers within bars indicate n.
FIGURE 3
FIGURE 3
OA does not inhibit primary signal transduction of 1-oct or L-VGCC activity. (A,B) Ca2+ transients induced by 1-oct in wild-type ASH amphids. Gray boxes in (B) represent duration of 1-oct exposure. (C) Quantification of amphid Ca2+ signals. N.S., not significantly different from untreated counterpart (p = 0.1966, unpaired t-test). (D) Experimental approach for high K+ stimulation of ASH neurons, showing the two-barrel puffer used to deliver the stimulus. Puffer is mounted on a motorized drive and can be moved to deliver stimuli at precise intervals (i.e., compare left and right panels). Neuron on right is partially dissected and exposed to bath. (E) Images of GCaMP3 fluorescence in a dissected ASH soma before (left) and during (right) exposure to 30 mM K+ solution. (F) Representative traces of high K+-stimulated somal Ca2+ transients. Green boxes represent duration of high K+ exposure. (G) Quantification of 5-HT and OA effects on high K+-stimulated somal Ca2+ signals. *Significantly different from untreated control (p = 0.0196, ANOVA). N.S., not significantly different from untreated control (p = 0.4799, ANOVA). Values are mean ± SD. Numbers within bars indicate n.
FIGURE 4
FIGURE 4
Octopamine inhibition of 1-oct-induced somal Ca2+ transients in ASHs requires IRK-2 and IRK-3. *Significantly different from untreated control (p < 0.005, unpaired t-test). N.S., not significantly different compared with untreated control (p > 0.05, unpaired t-test). Values are mean ± SD. Numbers within bars indicate n.
FIGURE 5
FIGURE 5
Determination of the physiological concentration range for OA/OCTR-1 signaling. (A) Diagram illustrating dual pipette perfusion system. Upper pipette delivers the olfactory stimulus, which is a saturated solution of 1-oct in external solution (shaded gray). Pipette is mounted on a motorized drive, which is moved to deliver stimuli at precise intervals. Lower pipette delivers external solutions, with or without OA, separated from one another by a glass septum that allows for rapid switching. This stream also deflects the 1-oct solution away from the exposed cell body to prevent direct contact of the exposed cell soma with 1-oct. (B) Representative traces of 1-oct-stimulated ASH somal Ca2+ transients at various OA concentrations in wild type and OA receptor mutants. Gray boxes represent duration of 1-oct exposure. (C) Quantification of 1-oct induced ASH somal Ca2+ transients. *Significantly different from untreated control (p < 0.05, paired t-test). N.S., not significantly different compared with untreated control (p > 0.05, paired t-test). Values are mean ± SD. Numbers within bars indicate n.
FIGURE 6
FIGURE 6
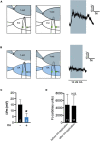
Octopamine inhibits 1-oct-stimulated depolarization in ASH neurons. (A,B) Recording protocol (left) and representative trace (right) of 1-oct-stimulated depolarization in ASH in the absence (A) and presence (B) of 10 nM OA. 1-Oct solution shaded gray, 10 nM OA shaded blue, neuron on right exposed to bath to provide access to the patch pipette. Gray box over trace indicates duration of 1-oct exposure. (C) Quantification of OA inhibition of ASH depolarization. ΔVm, change in membrane potential. (D) OA treatment does not decrease resting Ca2+ levels in the soma of ASH neurons. Average somal GCaMP3 fluorescence values in bath-exposed ASH neurons before and after 10 nM OA application. N.S., not significantly different compared with untreated control (p > 0.05, paired t-test). *Significantly different from untreated control (p < 0.005, unpaired t-test). Values are mean ± SD. Numbers within bars indicate n.
FIGURE 7
FIGURE 7
Interacting signaling pathways within the ASH neuron regulate the strength of sensory responses. The sensory activation pathway (gold) depolarizes the neuron, leading to synaptic vesicle release and excitatory signaling to downstream aversive locomotory circuitry. Ca2+ entering through L-VGCCs, responsible for optically measurable somal Ca2+ transients, provides negative feedback on depolarization (dashed box). 5-HT signaling (red) inhibits this Ca2+-mediated inhibition, and therefore disinhibits depolarization. Finally, OA signaling (blue) blocks sensory-dependent depolarization through OCTR-1, Go, and GIRK channels. Identity of signaling proteins indicated by text above and below pathways. Corresponding mutants shown in parentheses.

Similar articles

Cited by

References

    1. Adolph A. R., Tuan F. J. (1972). Serotonin and inhibition in Limulus lateral eye. J. Gen. Physiol. 60 679–697. 10.1085/jgp.60.6.679 - DOI - PMC - PubMed
    1. Akerboom J., Chen T. W., Wardill T. J., Tian L., Marvin J. S., Mutlu S., et al. (2012). Optimization of a GCaMP calcium indicator for neural activity imaging. J. Neurosci. 32 13819–13840. 10.1523/jneurosci.2601-12.2012 - DOI - PMC - PubMed
    1. Al-Anzi B., Armand E., Nagamei P., Olszewski M., Sapin V., Waters C., et al. (2010). The leucokinin pathway and its neurons regulate meal size in Drosophila. Curr. Biol. 20 969–978. 10.1016/j.cub.2010.04.039 - DOI - PMC - PubMed
    1. Ali F., Kwan A. C. (2020). Interpreting in vivo calcium signals from neuronal cell bodies, axons, and dendrites: a review. Neurophotonics 7:e011402. 10.1117/1.NPh.7.1.011402 - DOI - PMC - PubMed
    1. Alten B., Guzikowski N. J., Zurawski Z., Hamm H. E., Kavalali E. T. (2022). Presynaptic mechanisms underlying GABA(B)-receptor-mediated inhibition of spontaneous neurotransmitter release. Cell Rep. 38:110255. 10.1016/j.celrep.2021.110255 - DOI - PMC - PubMed