. 2022 Aug 3;9(8):211808.
doi: 10.1098/rsos.211808. eCollection 2022 Aug.

Trajectories of adolescent life satisfaction

Affiliations

Trajectories of adolescent life satisfaction

Amy Orben et al. R Soc Open Sci. .

Abstract

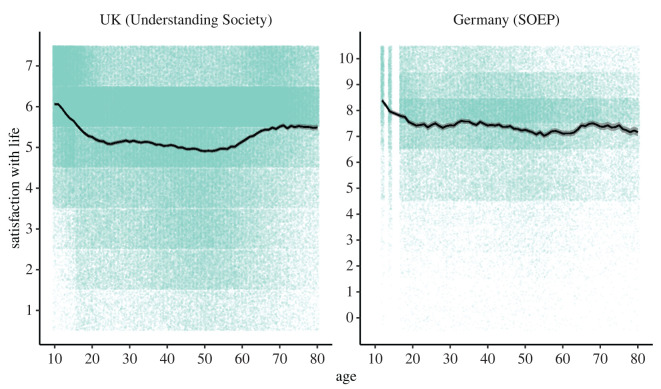
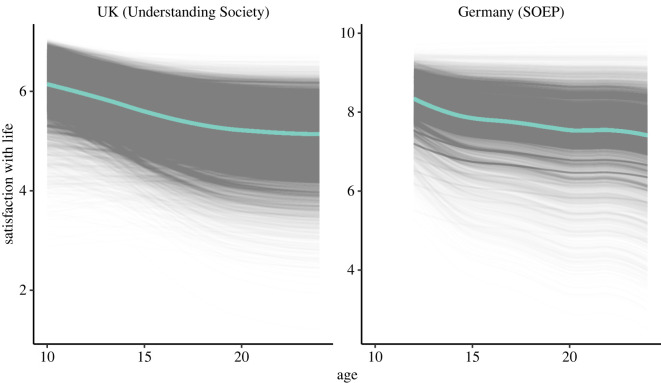
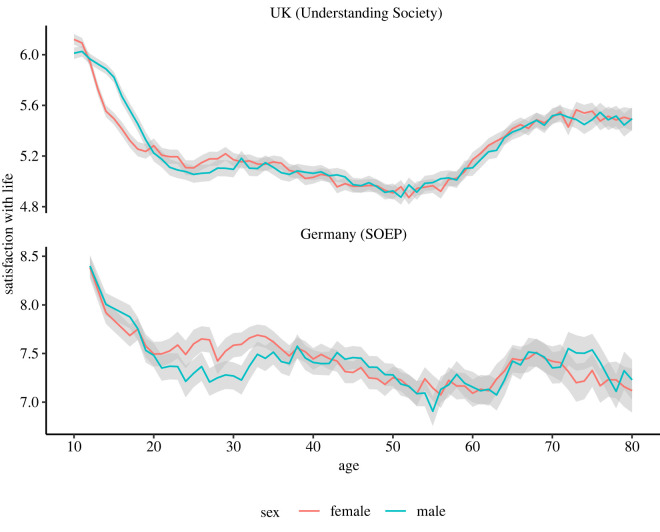
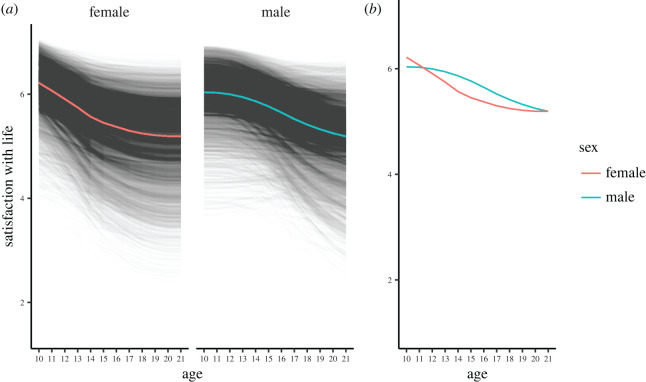
Increasing global policy interest in measuring and improving population wellbeing has prompted academic investigations into the dynamics of lifespan life satisfaction. Yet little research has assessed the complete adolescent age range, although it harbours developmental changes that could affect wellbeing far into adulthood. This study investigates how life satisfaction develops throughout the whole of adolescence, and compares this development to that in adulthood, by applying exploratory and confirmatory latent growth curve modelling to UK and German data, respectively (37 076 participants, 10-24 years). We find a near universal decrease in life satisfaction during adolescence. This decrease is steeper than at any other point across adulthood. Further, our findings suggest that adolescent girls' life satisfaction is lower than boys', but that this difference does not extend into adulthood. The study highlights the importance of studying adolescent subjective wellbeing trajectories to inform research, policy and practice.

Keywords: adolescents; latent growth models; life satisfaction; lifespan development; sex differences; subjective wellbeing.


Conflict of interest statement

We declare we have no competing interests.

Figures

Figure 1.
Figure 1.
Cross-sectional trajectory of life satisfaction for both UK (Understanding Society) and German (SOEP) participants between the ages of 10 and 80 years, and the ages of 12 and 80 years, respectively (black line = mean value by age, grey ribbon = 95% confidence interval error bars, teal points = individual data points). Please note that the error bars are very small owing to the large sample size analysed.
Figure 2.
Figure 2.
Longitudinal life satisfaction trajectories in UK and German data, for the ages of 10–24 years and 12–24 years, respectively. Latent growth curve estimated life satisfaction trajectories for adolescents (black lines) and trajectory for a simulated adolescent with a mean life satisfaction at ages 10 and 12, respectively (teal line).
Figure 3.
Figure 3.
Life satisfaction scores by age for 91 267 10–80 year-olds UK, and 41 275 12–80 year-olds German participants. Top: the UK data split by sex show that adolescence is also a time of substantial sex differences with girls showing an earlier drop in life satisfaction scores than boys, which lasts until late adolescence when the sex differences get smaller, and males do slightly worse than females in terms of life satisfaction. Bottom: the German data present less clear sex differences in early adolescence than the UK data, even though girls do show lower life satisfaction than boys during that time. The German data, however, show a prominent sex difference in life satisfaction during late adolescence and early adulthood, when males score lower in life satisfaction than females.
Figure 4.
Figure 4.
Longitudinal latent growth curve models of life satisfaction between 10 and 21 years in the UK dataset, differentiating by sex. (a) Latent growth curve model implied trajectories of life satisfaction for all participants (split by sex). The coloured lines show the implied trajectory for a simulated adolescent girl or boy who starts at their sex's mean life satisfaction at age 10. (b) The model implied trajectories for a simulated adolescent girl and boy who starts at their sex's mean life satisfaction at age 10 are overlaid to accommodate comparison.

References

    1. Helliwell JF, Layard R, Sachs J, De Neve J-E. 2020. World Happiness Report 2020. New York: Sustainable Development Solutions Network.
    1. Gallup. 2019. Gallup Global Emotions. See https://www.gallup.com/analytics/248906/gallup-globalemotions-report-201....
    1. Costanza R, et al. 2014. Development: time to leave GDP behind. Nature 505, 283-285. ( 10.1038/505283a) - DOI - PubMed
    1. Fox J. 2012. The Economics of Well-Being. Harvard Business Review, January–February 2012. See https://hbr.org/2012/01/the-economics-of-well-being.
    1. Adler MD, Fleurbaey M. (eds). 2016. The Oxford handbook of well-being and public policy. Oxford, UK: Oxford University Press.

LinkOut - more resources