

Establishment and Analysis of an Individualized EMT-Related Gene Signature for the Prognosis of Breast Cancer in Female Patients
- PMID: 35937944
- PMCID: PMC9352481
- DOI: 10.1155/2022/1289445
Establishment and Analysis of an Individualized EMT-Related Gene Signature for the Prognosis of Breast Cancer in Female Patients
Abstract
Background: The current high mortality rate of female breast cancer (BC) patients emphasizes the necessity of identifying powerful and reliable prognostic signatures in BC patients. Epithelial-mesenchymal transition (EMT) was reported to be associated with the development of BC. The purpose of this study was to identify prognostic biomarkers that predict overall survival (OS) in female BC patients by integrating data from TCGA database.
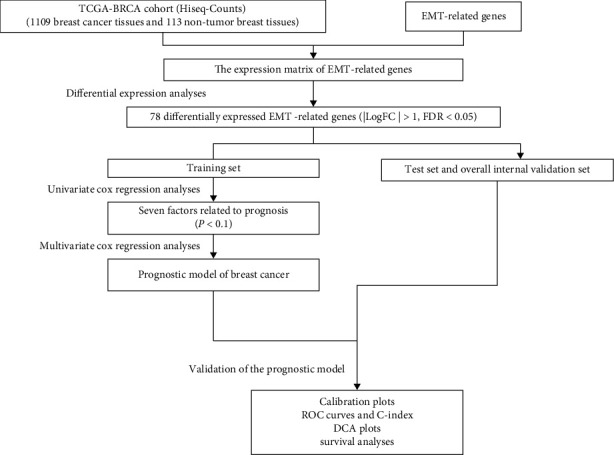
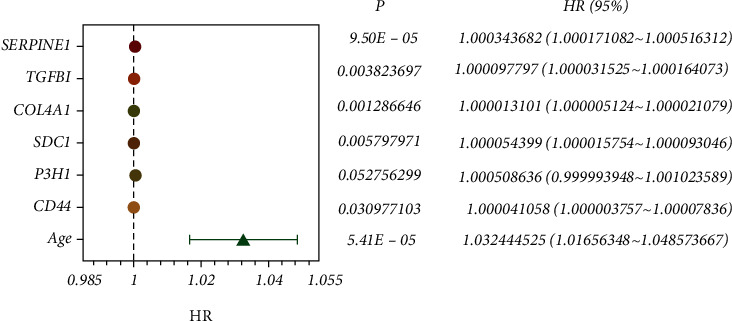
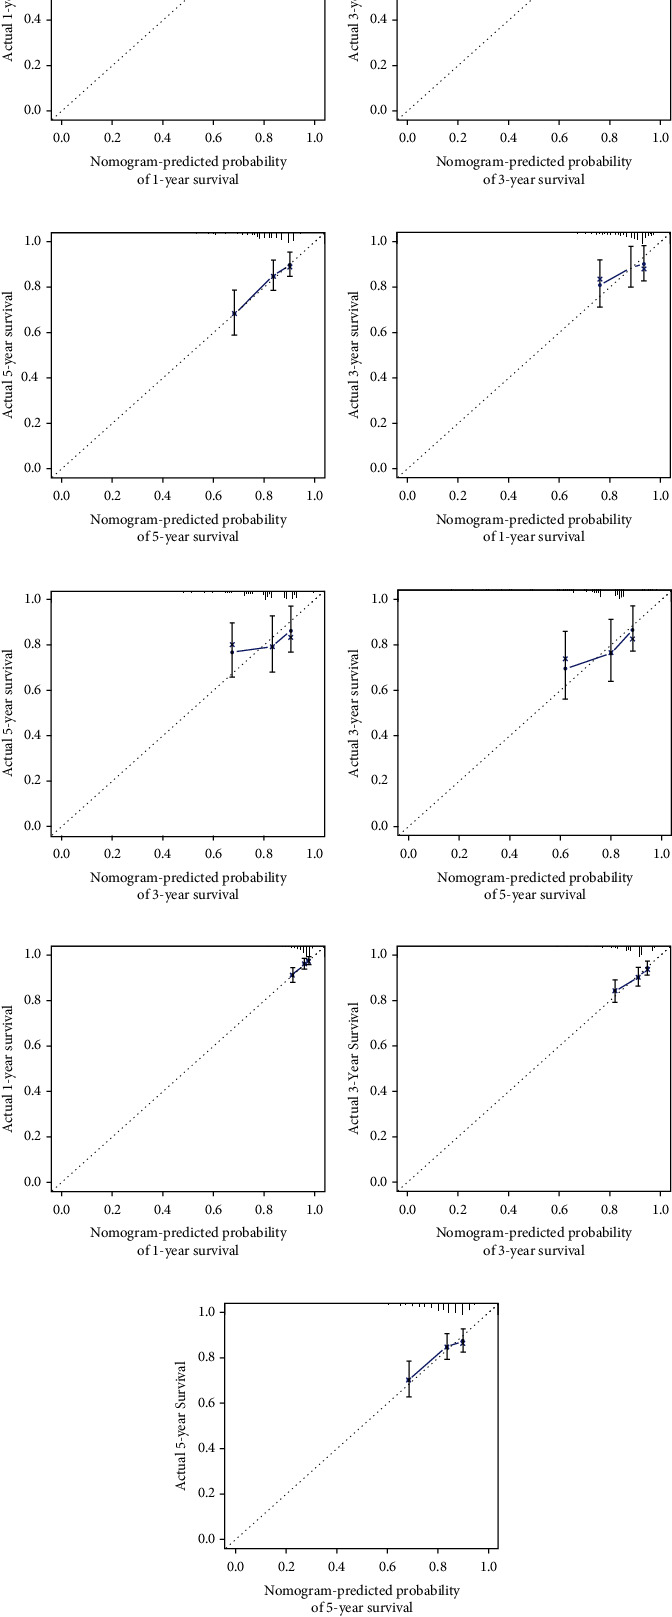
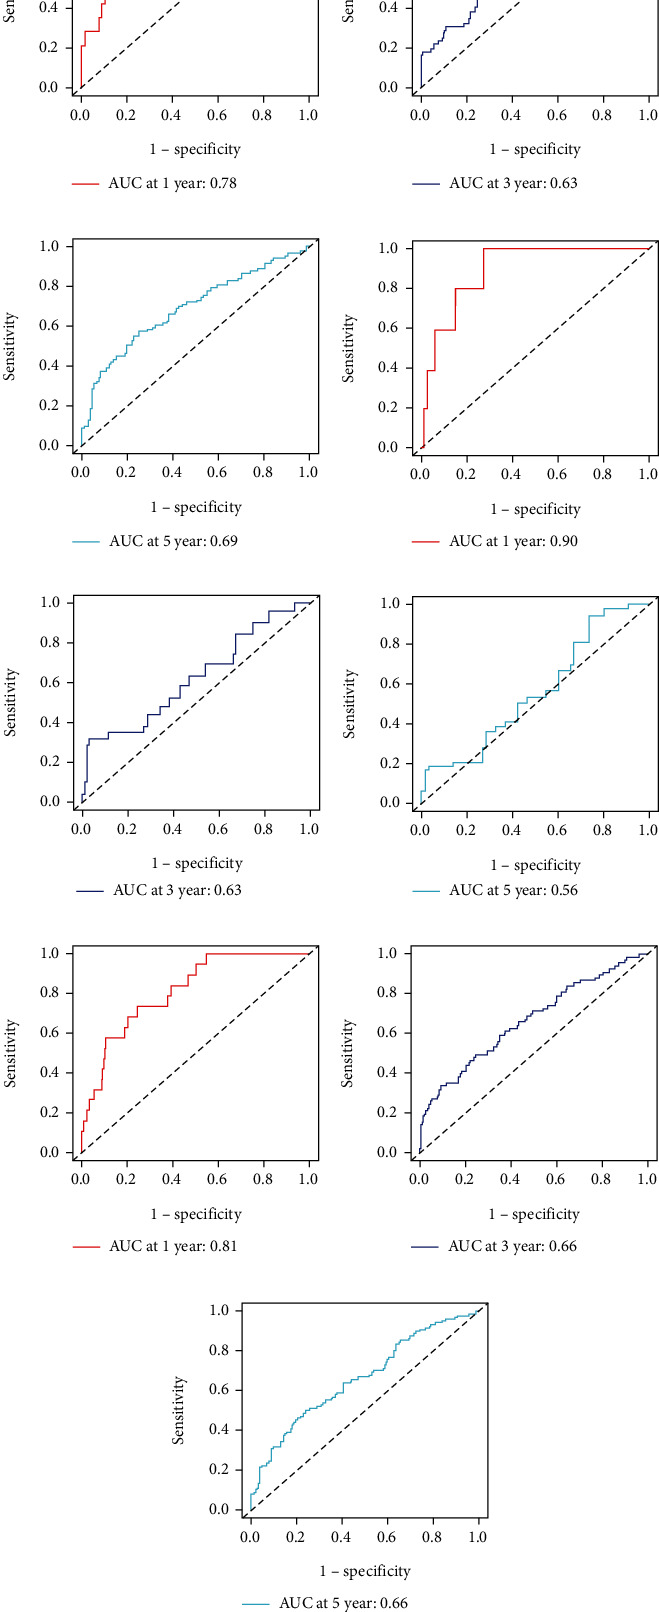
Method: We first downloaded the dataset in TCGA and identified gene signatures by overlapping candidate genes. Differential analysis was performed to find differential EMT-related genes. Univariate regression analysis was then performed to identify candidate prognostic variables. We then developed a prognostic model by multivariate analysis to predict OS. Calibration curves, receiver operating characteristics (ROC) curves, C-index, and decision curve analysis (DCA) were used to test the veracity of the prognostic model.
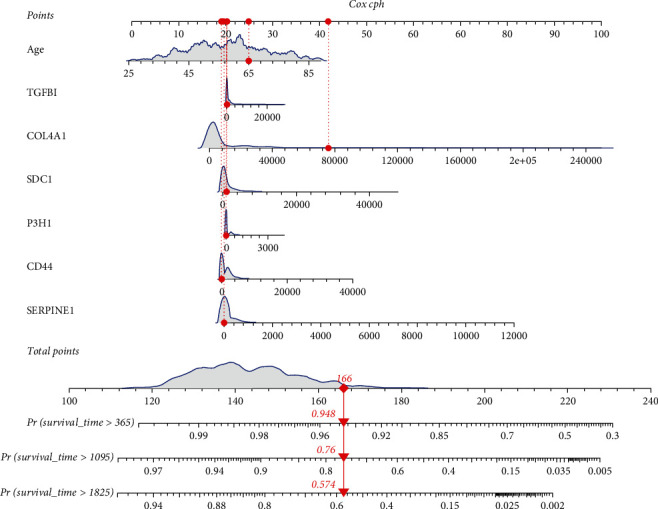
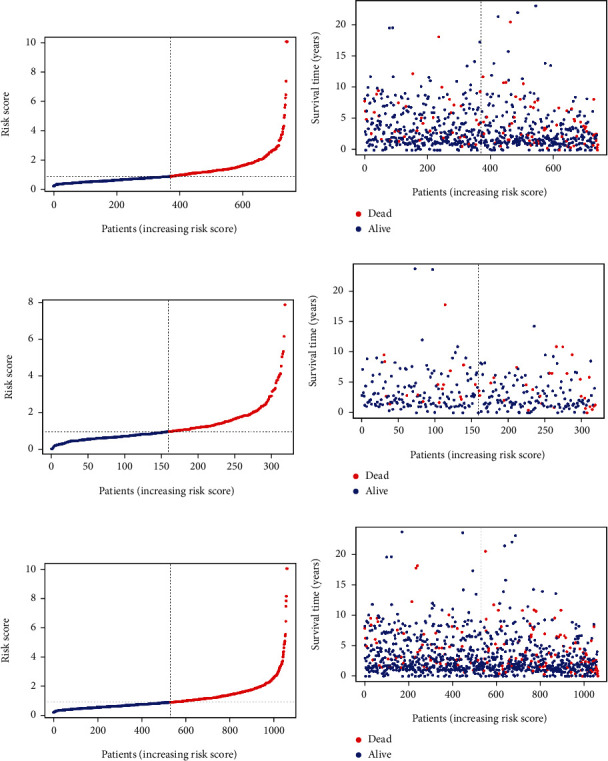
Result: In this study, we identified and validated a prognostic model integrating age and six genes (CD44, P3H1, SDC1, COL4A1, TGFβ1, and SERPINE1). C-index values for BC patients were 0.672 (95% CI 0.611-0.732) and 0.692 (95% CI 0.586-0.798) in the training cohort and test set, respectively. The calibration curve and the DCA curve show the good predictive performance of the model.
Conclusion: This study offered a robust predictive model for OS prediction in female BC patients and may provide a more accurate treatment strategy and personalized therapy in the future.
Copyright © 2022 Wei Xue et al.
Conflict of interest statement
The authors declare that they have no conflicts of interest.
Figures


Similar articles
-
Construction of a novel mRNA-signature prediction model for prognosis of bladder cancer based on a statistical analysis.BMC Cancer. 2021 Jul 27;21(1):858. doi: 10.1186/s12885-021-08611-z. BMC Cancer. 2021. PMID: 34315402 Free PMC article.
-
Development and validation of a robust epithelial-mesenchymal transition (EMT)-related prognostic signature for hepatocellular carcinoma.Clin Res Hepatol Gastroenterol. 2021 Sep;45(5):101587. doi: 10.1016/j.clinre.2020.101587. Epub 2021 Mar 1. Clin Res Hepatol Gastroenterol. 2021. PMID: 33662631
-
Prediction of Overall Survival Among Female Patients With Breast Cancer Using a Prognostic Signature Based on 8 DNA Repair-Related Genes.JAMA Netw Open. 2020 Oct 1;3(10):e2014622. doi: 10.1001/jamanetworkopen.2020.14622. JAMA Netw Open. 2020. PMID: 33017027 Free PMC article.
-
A novel prognostic models for identifying the risk of hepatocellular carcinoma based on epithelial-mesenchymal transition-associated genes.Bioengineered. 2020 Dec;11(1):1034-1046. doi: 10.1080/21655979.2020.1822715. Bioengineered. 2020. PMID: 32951492 Free PMC article.
-
A robust six-gene prognostic signature for prediction of both disease-free and overall survival in non-small cell lung cancer.J Transl Med. 2019 May 14;17(1):152. doi: 10.1186/s12967-019-1899-y. J Transl Med. 2019. PMID: 31088477 Free PMC article.
Cited by
-
Developing a prognosis and chemotherapy evaluating model for colon adenocarcinoma based on mitotic catastrophe-related genes.Sci Rep. 2024 Jan 18;14(1):1655. doi: 10.1038/s41598-024-51918-7. Sci Rep. 2024. PMID: 38238555 Free PMC article.
-
Update on Epithelial-Mesenchymal Plasticity in Cancer Progression.Annu Rev Pathol. 2024 Jan 24;19:133-156. doi: 10.1146/annurev-pathmechdis-051222-122423. Epub 2023 Sep 27. Annu Rev Pathol. 2024. PMID: 37758242 Free PMC article. Review.
-
EMT and cancer: what clinicians should know.Nat Rev Clin Oncol. 2025 Jul 22. doi: 10.1038/s41571-025-01058-2. Online ahead of print. Nat Rev Clin Oncol. 2025. PMID: 40696171 Review.
-
Pan-Cancer Analysis of P3H1 and Experimental Validation in Renal Clear Cell Carcinoma.Appl Biochem Biotechnol. 2024 Sep;196(9):5974-5993. doi: 10.1007/s12010-023-04845-8. Epub 2024 Jan 4. Appl Biochem Biotechnol. 2024. PMID: 38175417
-
Downregulation of MAL2 inhibits breast cancer progression through regulating β-catenin/c-Myc axis.Cancer Cell Int. 2023 Jul 21;23(1):144. doi: 10.1186/s12935-023-02993-9. Cancer Cell Int. 2023. PMID: 37480012 Free PMC article.
References
MeSH terms
LinkOut - more resources
Full Text Sources
Medical
Miscellaneous
