

RhoA with Associated TRAb or FT3 in the Diagnosis and Prediction of Graves' Ophthalmopathy
- PMID: 35937945
- PMCID: PMC9355757
- DOI: 10.1155/2022/8323946
RhoA with Associated TRAb or FT3 in the Diagnosis and Prediction of Graves' Ophthalmopathy
Abstract
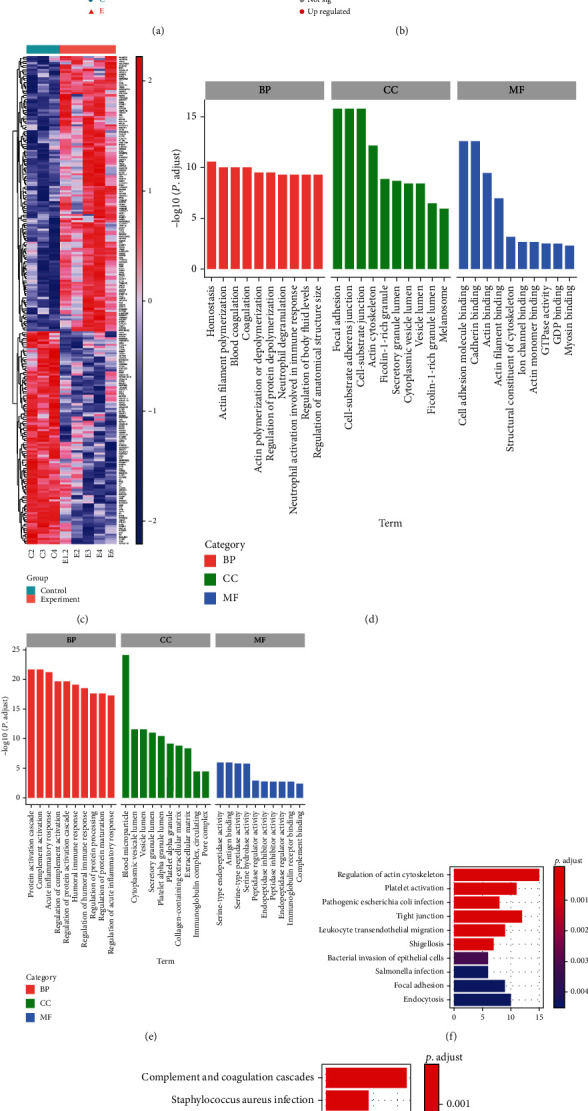
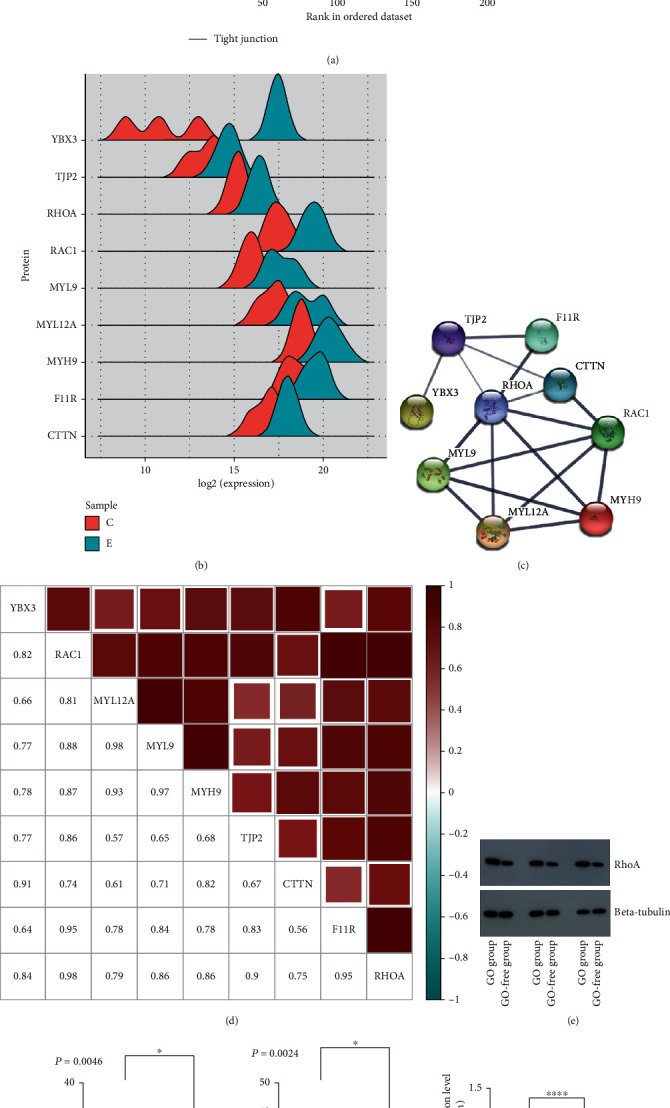
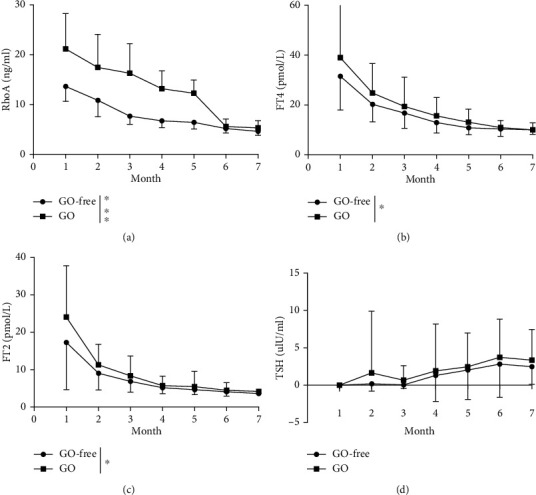
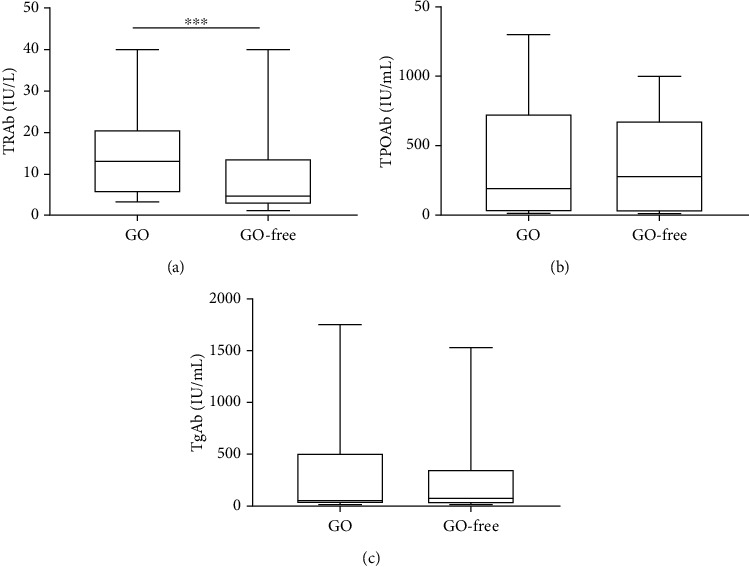
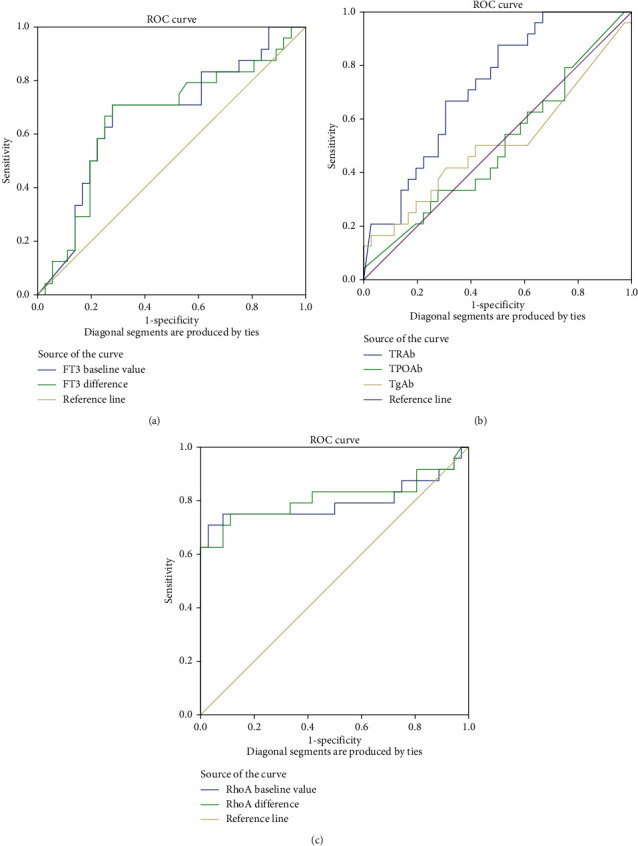
During Graves' disease (GD) treatment, Graves' ophthalmopathy (GO) is often ignored because only mild ocular symptoms are present in early GD. Therefore, we performed isobaric tags for relative and absolute quantification (iTRAQ) analysis and measured relevant endocrine hormones to identify predisposing factors of GO. Serum samples from 3 patients with mild GD and GO and 3 patients with GD but without GO were analyzed by iTRAQ. Based on their clinical data, 60 patients with GD were divided into the GO-free and GO groups. All patients were followed up for 7 months. Their eye conditions and changes in related biochemical indexes were recorded. The iTRAQ results showed that RhoA expression was upregulated and correlated significantly with the tight junction pathway and immunity. The changes in FT3 and RhoA from baseline to 7 months, the FT3 and RhoA baseline levels, and the TRAb titer levels in patients with GD significantly differed between the groups. ELISA and western blotting for RhoA, TRAb, and FT3 in the serum samples from GO patients showed significant upregulation, as well as elevated serum RhoA and TRAb levels in the mild stage of GO. At 7 months, the serum RhoA and FT3 levels were elevated. RhoA is a potential biomarker for mild GO. In GD patients, if an elevated serum RhoA level is accompanied by an elevated TRAb or FT3 level, GO is highly likely to occur, even when obvious ocular symptoms are absent.
Copyright © 2022 Sidi Zhao et al.
Conflict of interest statement
The authors declare that there are no conflicts of interest.
Figures
Similar articles
-
Relationship between longitudinal behaviour of some markers of eye autoimmunity and changes in ocular findings in patients with Graves' ophthalmopathy receiving corticosteroid therapy.Clin Endocrinol (Oxf). 2003 Sep;59(3):388-95. doi: 10.1046/j.1365-2265.2003.01861.x. Clin Endocrinol (Oxf). 2003. PMID: 12919164
-
CD4+ T cells and the Th1/Th2 imbalance are implicated in the pathogenesis of Graves' ophthalmopathy.Int J Mol Med. 2006 May;17(5):911-6. Int J Mol Med. 2006. PMID: 16596280
-
Clinical Implications of Immunoglobulin G4 to Graves' Ophthalmopathy.Thyroid. 2017 Sep;27(9):1185-1193. doi: 10.1089/thy.2017.0126. Thyroid. 2017. PMID: 28805160
-
Measuring TSH receptor antibody to influence treatment choices in Graves' disease.Clin Endocrinol (Oxf). 2017 May;86(5):652-657. doi: 10.1111/cen.13327. Clin Endocrinol (Oxf). 2017. PMID: 28295509 Review.
-
Clinical review: Clinical utility of TSH receptor antibodies.J Clin Endocrinol Metab. 2013 Jun;98(6):2247-55. doi: 10.1210/jc.2012-4309. Epub 2013 Mar 28. J Clin Endocrinol Metab. 2013. PMID: 23539719 Free PMC article. Review.
Cited by
-
Combining biomarkers to predict the disease activity of graves' ophthalmopathy: a combinatory model of the NLR, TRAb and FT4.Front Endocrinol (Lausanne). 2025 Jun 20;16:1546211. doi: 10.3389/fendo.2025.1546211. eCollection 2025. Front Endocrinol (Lausanne). 2025. PMID: 40620798 Free PMC article.
-
Immune-related visual dysfunction in thyroid eye disease: a combined orbital and brain neuroimaging study.Eur Radiol. 2024 Jul;34(7):4516-4526. doi: 10.1007/s00330-023-10309-8. Epub 2023 Dec 19. Eur Radiol. 2024. PMID: 38112763
-
Molecular Biomarkers in Thyroid Eye Disease: A Literature Review.Ophthalmic Plast Reconstr Surg. 2023 Dec 1;39(6S):S19-S28. doi: 10.1097/IOP.0000000000002466. Epub 2023 Dec 4. Ophthalmic Plast Reconstr Surg. 2023. PMID: 38054982 Free PMC article. Review.
References
MeSH terms
Substances
LinkOut - more resources
Full Text Sources
