Alteration in the Immune Microenvironment Based on APC Status in MSS/pMMR Colon Cancer
- PMID: 35937946
- PMCID: PMC9348928
- DOI: 10.1155/2022/3592990
Alteration in the Immune Microenvironment Based on APC Status in MSS/pMMR Colon Cancer
Abstract
Introduction: Immunotherapy is currently the most promising antitumor treatment approach. However, the colon cancer immunotherapy indication dMMR/MSI-H do not cover all colon cancer patients suitable for immunotherapy. We performed transcriptome-wide expression profile analyses of pMMR/MSS colon adenocarcinoma (COAD) specimens from TCGA database to identify a genetype signature associated with tumor immune microenvironment types (TIMTs).
Methods: TCGA database was used to identify tumor genotypes suitable for antitumor immunotherapy. We analyzed RNA-sequencing profiles of 338 COAD targeted to the pMMR/MSS group from TCGA public dataset. The ESTIMATE and the CIBERSORT were used to analyze the pMMR/MSS COAD immune microenvironment between APC wild and APC mutation. Furthermore, we further verified the relationship between APC genotype and TIMTs and the efficacy of immunotherapy in 42 colon cancer specimens.
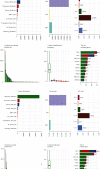
Results: We identified that in APC-wt/MSS colon cancer, the expressions of PD-1, PD-L1, CTLA4, and CYT (GZMA and PRF1) were increased. The TMB, Immunoscore, and the proportion of CT8+ T cell infiltration also were identified increasing in these patients. And pathway enrichment analysis for differentially expressed genes (DEGs) between APC-wt and APC-mt MSS COAD was done to further explore their biological function. Similarly, the significant pathways for DEGs were mainly enriched in the immune response, extracellular matrix, and cell adhesion which involved in immune response. Specimens from 42 colon cancer patients, including 22 APC-mt/MSS and 20 APC-wt/MSS, were immunohistochemically evaluated for expression of CD8 and PD-L1. And APC-wt/MSS tumors showed significantly higher expression of CD8 and PD-L1 than APC-mt/MSS tumor. Moreover, APC-wt was compared with APC-mt MSS/pMMR colon cancer (DOR, 45% and 26.7%, respectively; P < 0.05).
Conclusion: Based on the results, we found that more colon cancers of APC-wt/MSS are classified by TMIT I. And APC-wt/MSS colon cancer patients are more likely to benefit from antitumor immunotherapy.
Copyright © 2022 Haishan Lin and Bangwei Cao.
Conflict of interest statement
The authors declare that they have no competing interests.
Figures


Similar articles
-
The aminophospholipid transporter, ATP8B3, as a potential biomarker and target for enhancing the therapeutic effect of PD-L1 blockade in colon adenocarcinoma.Genomics. 2024 Sep;116(5):110907. doi: 10.1016/j.ygeno.2024.110907. Epub 2024 Jul 27. Genomics. 2024. PMID: 39074670
-
DEPDC1B: A novel tumor suppressor gene associated with immune infiltration in colon adenocarcinoma.Cancer Med. 2024 Aug;13(15):e70043. doi: 10.1002/cam4.70043. Cancer Med. 2024. PMID: 39087856 Free PMC article.
-
Analysis of the molecular nature associated with microsatellite status in colon cancer identifies clinical implications for immunotherapy.J Immunother Cancer. 2020 Oct;8(2):e001437. doi: 10.1136/jitc-2020-001437. J Immunother Cancer. 2020. PMID: 33028695 Free PMC article.
-
Meta-analysis of neoadjuvant immunotherapy for non-metastatic colorectal cancer.Front Immunol. 2023 Jan 27;14:1044353. doi: 10.3389/fimmu.2023.1044353. eCollection 2023. Front Immunol. 2023. PMID: 36776899 Free PMC article.
-
The Potential Value of Immunotherapy in Colorectal Cancers: Review of the Evidence for Programmed Death-1 Inhibitor Therapy.Clin Colorectal Cancer. 2016 Dec;15(4):285-291. doi: 10.1016/j.clcc.2016.07.007. Epub 2016 Jul 22. Clin Colorectal Cancer. 2016. PMID: 27553906 Review.
References
MeSH terms
Substances
LinkOut - more resources
Full Text Sources
Research Materials

