Review
. 2022 Jul 22:13:927046.
doi: 10.3389/fgene.2022.927046. eCollection 2022.

A Pan-Cancer Analysis Reveals the Prognostic and Immunotherapeutic Value of Stanniocalcin-2 (STC2)

Affiliations
Review

A Pan-Cancer Analysis Reveals the Prognostic and Immunotherapeutic Value of Stanniocalcin-2 (STC2)

Zhong-Hui Jiang et al. Front Genet. .

Abstract

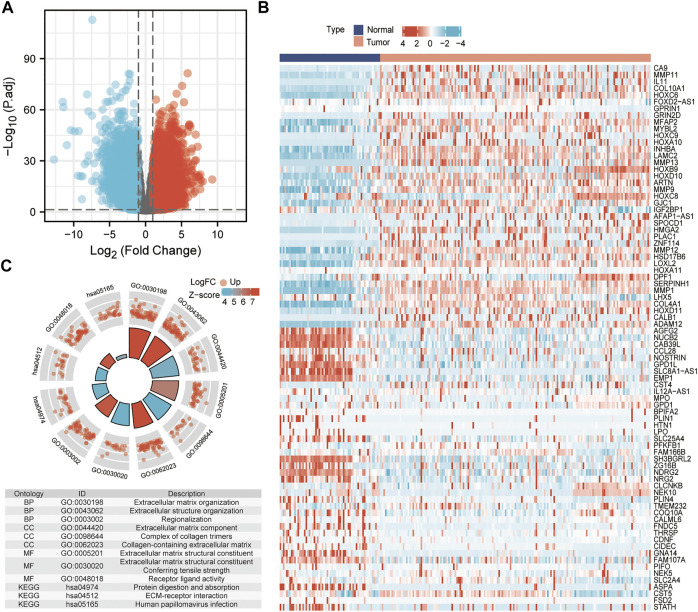
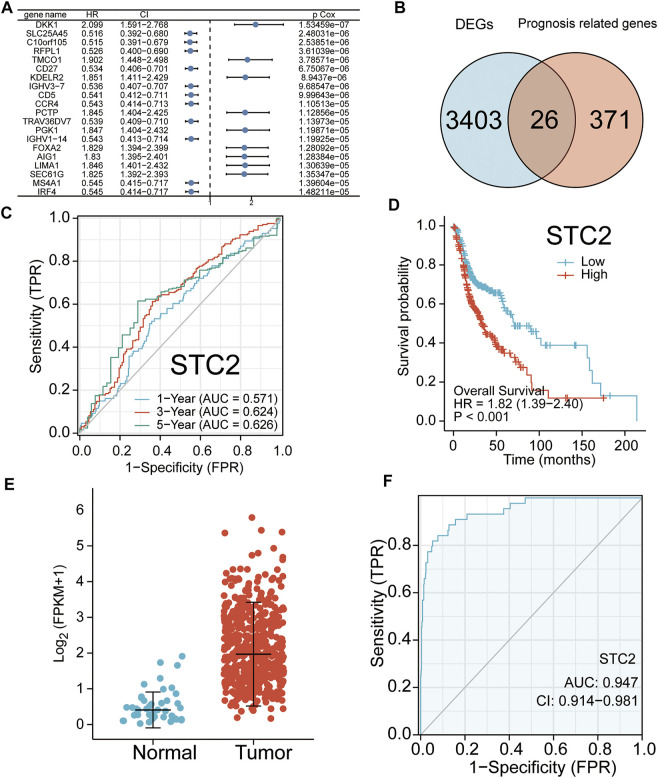
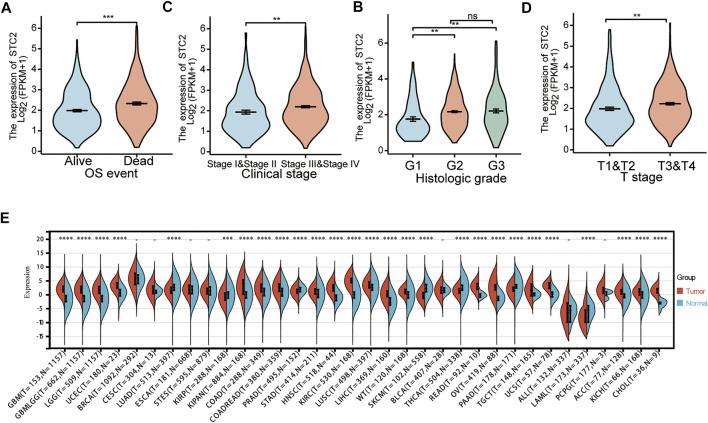
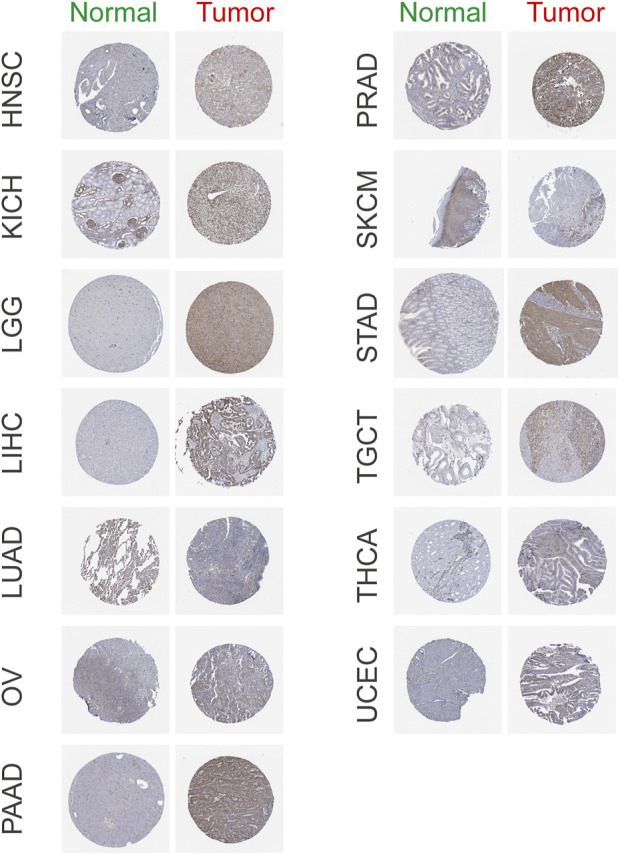
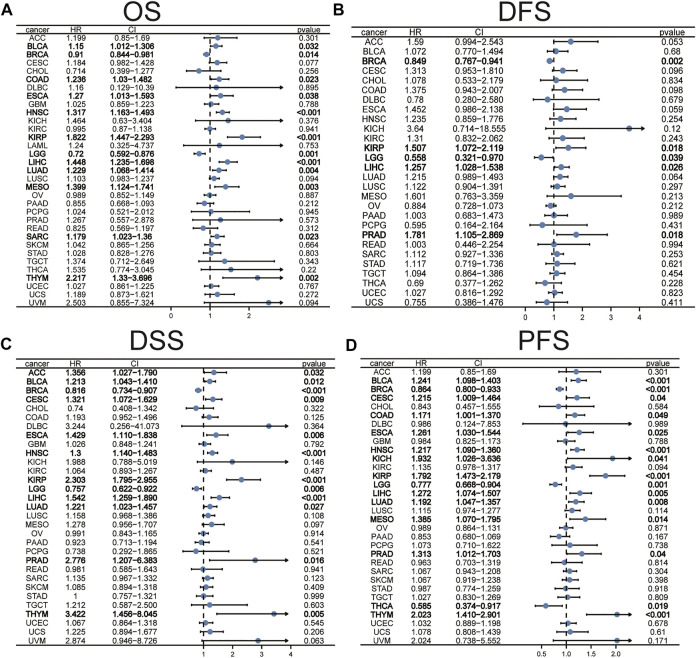
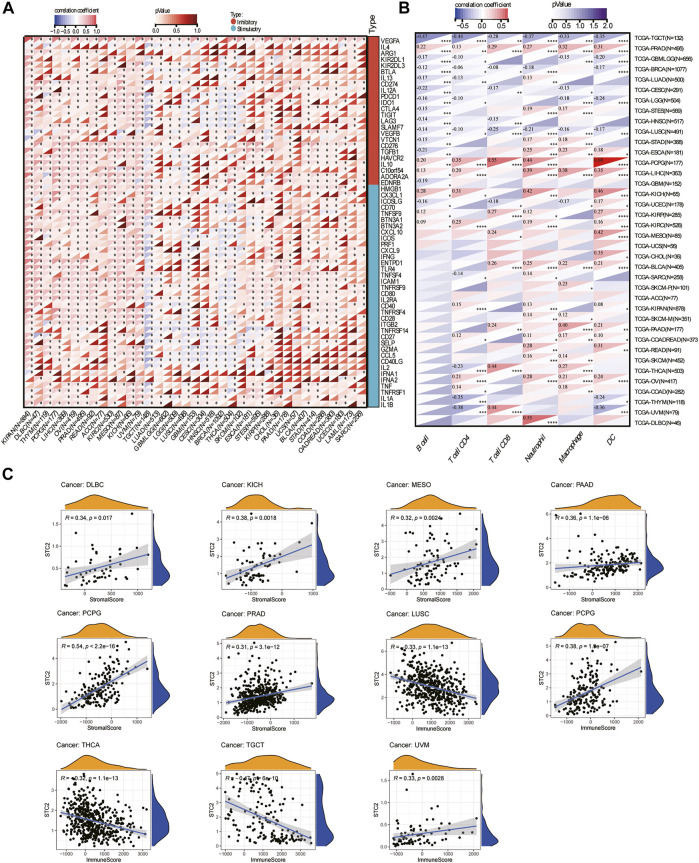
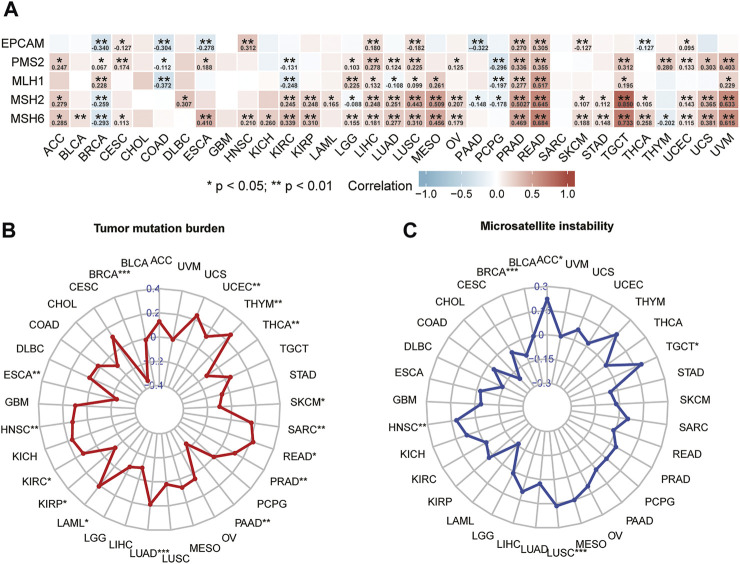
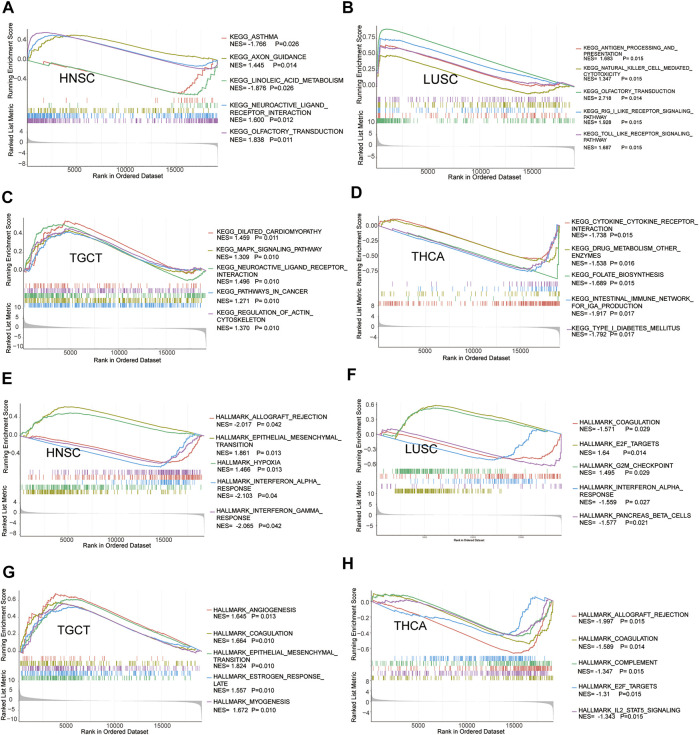
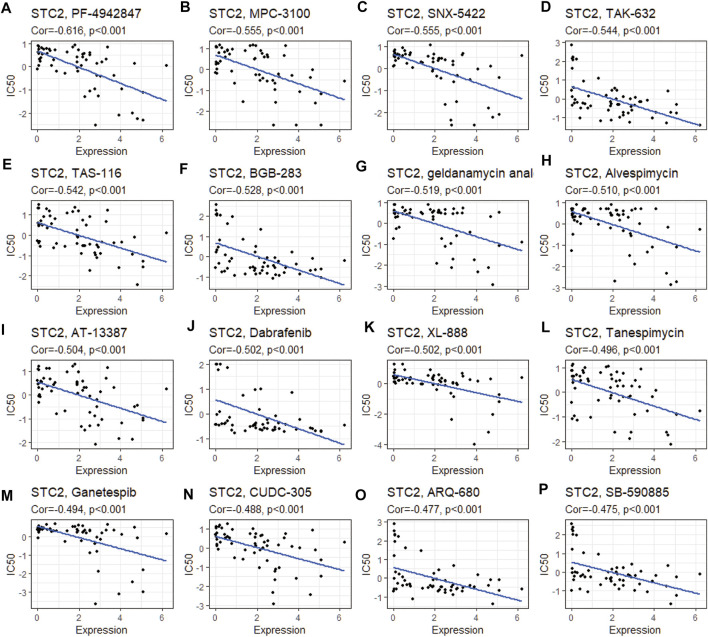
Background: Stanniocalcin-2 (STC2) is a secreted glycoprotein which plays an important role in regulating the homeostasis of calcium, glucose homeostasis, and phosphorus metastasis. Accumulating evidence suggests that STC2 is implicated in cancer mechanisms. However, the effects of STC2 on cancer development and progression across pan-cancer are not yet completely known. Methods: Data were downloaded from The Cancer Genome Atlas database to obtain differentially expressed genes significantly associated with prognosis (key genes). A gene was selected for subsequent correlation studies by integrating the significance of prognosis and the time-dependent ROC curve. Gene expression of different tumor types was analyzed based on the UCSC XENA website. Furthermore, our study investigated the correlation of STC2 expression between prognosis, immune cell infiltration, immune checkpoint genes (ICGs), mismatch repair genes (MMRs), tumor mutation burden (TMB), microsatellite instability (MSI), and drug sensitivity in various malignant tumors. Gene set enrichment analysis (GSEA) was conducted for correlated genes of STC2 to explore potential mechanisms. Results: A total of 3,429 differentially expressed genes and 397 prognosis-related genes were identified from the TCGA database. Twenty-six key genes were found by crossing the former and the latter, and the highest risk gene, STC2, was selected for subsequent correlation studies. STC2 had good diagnostic performance for HNSCC, and was closely related to the survival status and clinicopathological stage of HNSCC patients. In pan-cancer analysis, STC2 was upregulated in 20 cancers and downregulated in seven cancers. STC2 overexpression was overall negatively correlated with overall survival, disease-free survival, disease-specific survival, and progress-free survival. STC2 was profoundly correlated with the tumor immune microenvironment, including immune cell infiltration, ICGs, MMRs, TMB, and MSI. Moreover, STC2 was significantly negatively correlated with the sensitivity or resistance of multiple drugs. Conclusion: STC2 was a potential prognostic biomarker for pan-cancer and a new immunotherapy target.

Keywords: head and neck squamous cell carcinoma; pan-cancer; prognostic biomarkers; stanniocalcin-2; target therapy.


Conflict of interest statement

The authors declare that the research was conducted in the absence of any commercial or financial relationships that could be construed as a potential conflict of interest.

Figures

FIGURE 1
FIGURE 1
Identified differentially expressed genes. (A) Volcano plot: up-regulated and down-regulated genes were indicated in red dots and blue dots, respectively. (B) Heatmap of the differentially expressed genes. (C) GO terms and KEGG pathways enrichment analysis.
FIGURE 2
FIGURE 2
Identified key genes and their examined prognostic significance. (A) Top 20 genes with the highest correlation to overall survival (OS) are shown. (B) Crossing the 3,429 DEGs with 397 prognosis genes. (C) Kaplan–Meier curve of STC2. (D) Time-dependent receiver operating characteristics (ROC) curves of STC2 for 1, 3, and 5 years (E) STC2 mRNA levels in HNSCC tissues (n = 502) and normal tissues (n = 44). (F) Diagnostic significance of STC2 in HNSCC. ROC curves were plotted and the area under the curve (AUC) of STC2 was 94.7%.
FIGURE 3
FIGURE 3
Analysis of the correlation between STC2 expression and clinicopathology. (A) Expression levels of STC2 in different survival status of HNSCC. (B) Expression levels of STC2 in early and advanced cancer. (C) Expression levels of STC2 in different degrees of tumor differentiation. (D) Expression levels of STC2 in different tumor stages. (E) Expression levels of STC2 in 33 cancer types. *p < 0.05; **p < 0.01; ***p < 0.001; ****p < 0.0001.
FIGURE 4
FIGURE 4
Representative immunohistochemistry images of STC2 in HNSC, KICH, LGG, LICH, LUAD, OV, PAAD, PRAD, SKCM, STAD, TGCT, THCA, and UCEC based on The Human Protein Atlas.
FIGURE 5
FIGURE 5
The prognostic significance of STC2 in pan-cancer. The associations between STC2 expression levels and overall survival (A), disease-free survival (B), disease-specific survival (C), and progress-free survival (D) in various cancer types were illustrated by the forest plots.
FIGURE 6
FIGURE 6
Immunological correlation analysis. (A) The correlation between STC2 expression and immune checkpoint genes. (B) Correlation of STC2 expression with immune cell infiltration in 33 cancers. Blue represents negative correlation and red represents positive correlation. *p < 0.05; **p < 0.01; ***p < 0.001; ****p < 0.0001. (C) Correlation between STC2 and stromal scores and immune score.
FIGURE 7
FIGURE 7
Analysis of correlation between STC2 and mismatch repair genes (A), tumor mutation burden (B), and microsatellite instability (C).
FIGURE 8
FIGURE 8
Gene set enrichment analysis of STC2. Enrichments of KEGG pathways in HNSC (A), LUSC (B), TGCT (C), and THCA (D). Enrichments of HALLMARK pathways in HNSC (E), LUSC (F), TGCT (G), and THCA (H).
FIGURE 9
FIGURE 9
Drug sensitivity analysis of STC2. The expression of STC2 was associated with the drug sensitivity of PF-4942847 (A), MPC-3100 (B), SNX-5422 (C), TAK-632 (D), TAS-116 (E), BGB-283(F), geldanamycin analog (G), alvespimycin (H), AT-13387 (I), dabrafenib (J), XL-888 (K), tanespimycin (L), ganetespib (M), CUDC-305 (N), ARQ-680 (O), and SB-590885 (P).
FIGURE 10
FIGURE 10
Basic biology of STC2 and genetic alteration analysis. (A) Genomic location of STC2 gene in the GeneCards website. (B) Subcellular location of STC2 by COMPARTMENTS. (C) Mutation type and frequency of STC2. (D) Three-dimensional (3D) structures of STC2.

Similar articles

Cited by

References

    1. Bray F., Ferlay J., Soerjomataram I., Siegel R. L., Torre L. A., Jemal A. (2018). Global Cancer Statistics 2018: GLOBOCAN Estimates of Incidence and Mortality Worldwide for 36 Cancers in 185 Countries. CA A Cancer J. Clin. 68 (6), 394–424. 10.3322/caac.21492 - DOI - PubMed
    1. Brown N. F., Williams M., Arkenau H.-T., Fleming R. A., Tolson J., Yan L., et al. (2018). A Study of the Focal Adhesion Kinase Inhibitor GSK2256098 in Patients with Recurrent Glioblastoma with Evaluation of Tumor Penetration of [11C]GSK2256098. Neuro Oncol. 20 (12), 1634–1642. 10.1093/neuonc/noy078 - DOI - PMC - PubMed
    1. Chen B., Zeng X., He Y., Wang X., Liang Z., Liu J., et al. (2016). STC2 Promotes the Epithelial-Mesenchymal Transition of Colorectal Cancer Cells through AKT-ERK Signaling Pathways. Oncotarget 7 (44), 71400–71416. 10.18632/oncotarget.12147 - DOI - PMC - PubMed
    1. Chen W. N., Zhu G. J. (2008). Progress in the Research of Stanniocalcin. Sheng Li Ke Xue Jin Zhan 39 (3), 225–228. - PubMed
    1. Chen X., Liu Q., Huang W., Cai C., Xia W., Peng Y., et al. (2018). Stanniocalcin-2 Contributes to Mesenchymal Stromal Cells Attenuating Murine Contact Hypersensitivity Mainly via Reducing CD8+ Tc1 Cells. Cell. Death Dis. 9 (5), 548. 10.1038/s41419-018-0614-x - DOI - PMC - PubMed

LinkOut - more resources