. 2022 Jul 22:10:893806.
doi: 10.3389/fcell.2022.893806. eCollection 2022.

Novel interaction interfaces mediate the interaction between the NEIL1 DNA glycosylase and mitochondrial transcription factor A

Affiliations

Novel interaction interfaces mediate the interaction between the NEIL1 DNA glycosylase and mitochondrial transcription factor A

Nidhi Sharma et al. Front Cell Dev Biol. .

Abstract

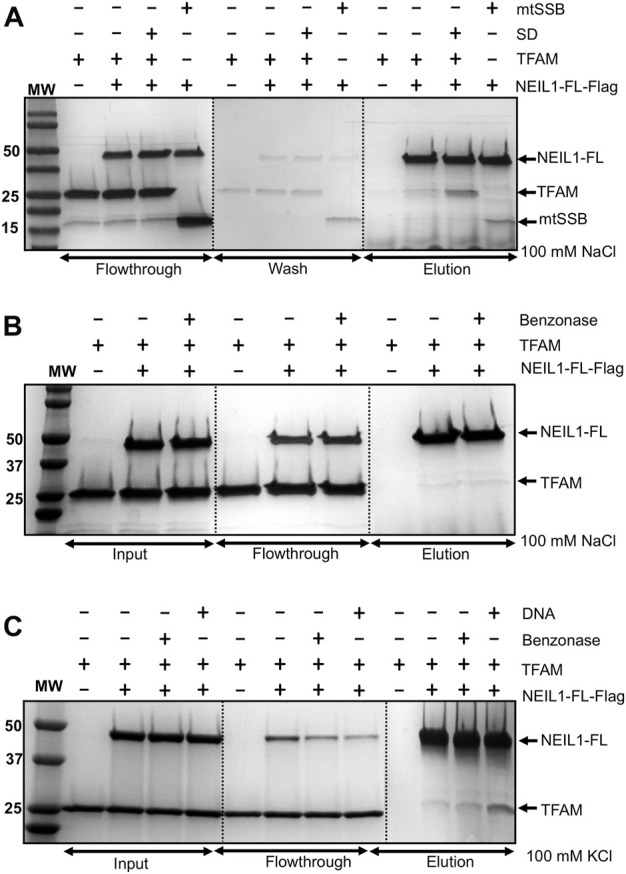
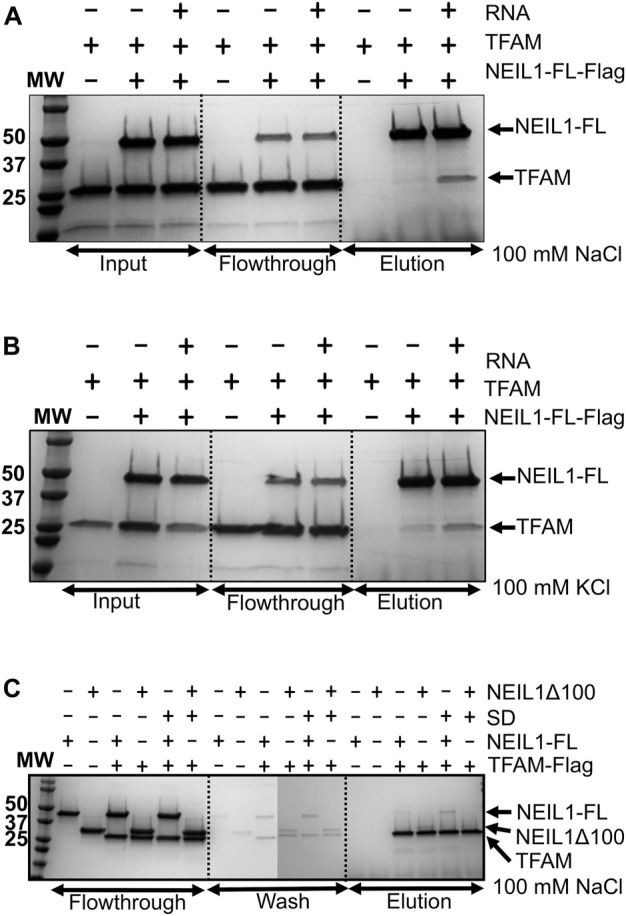
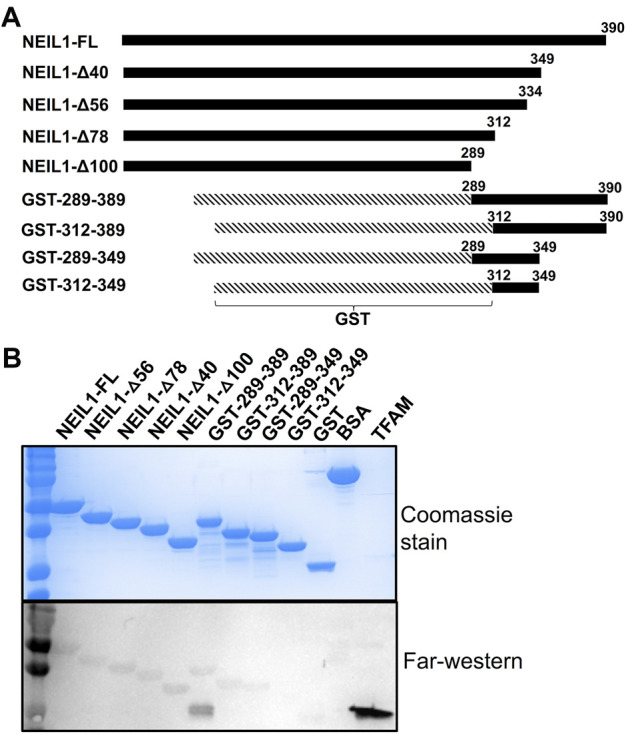
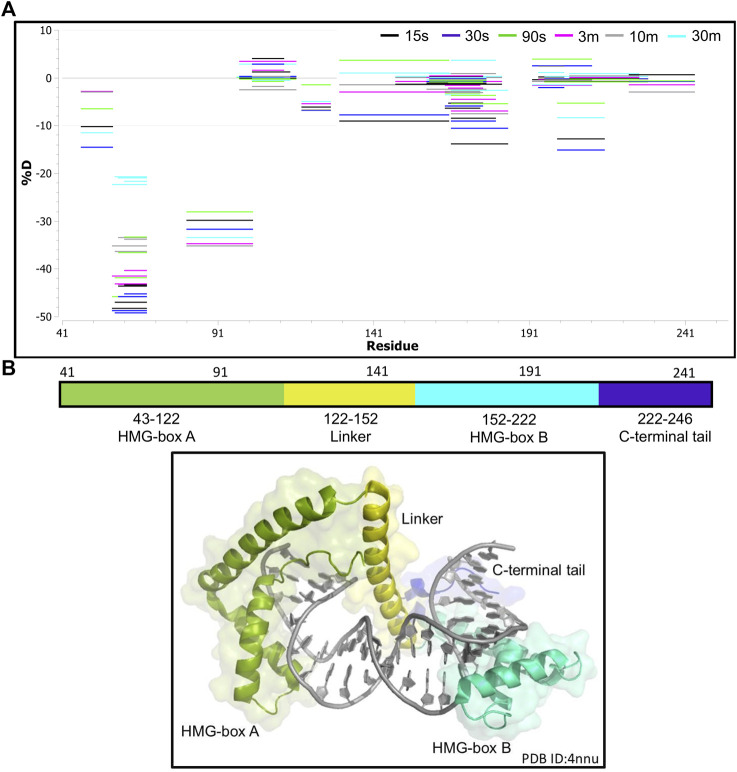
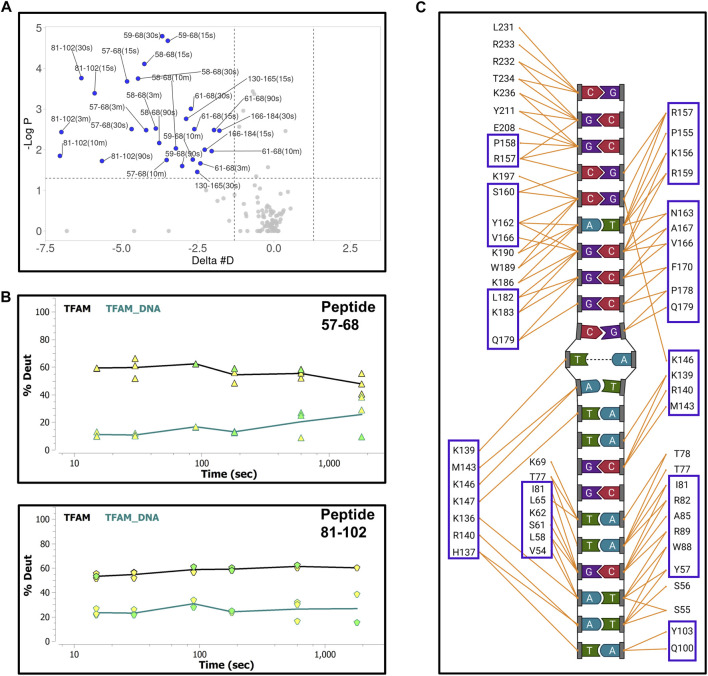
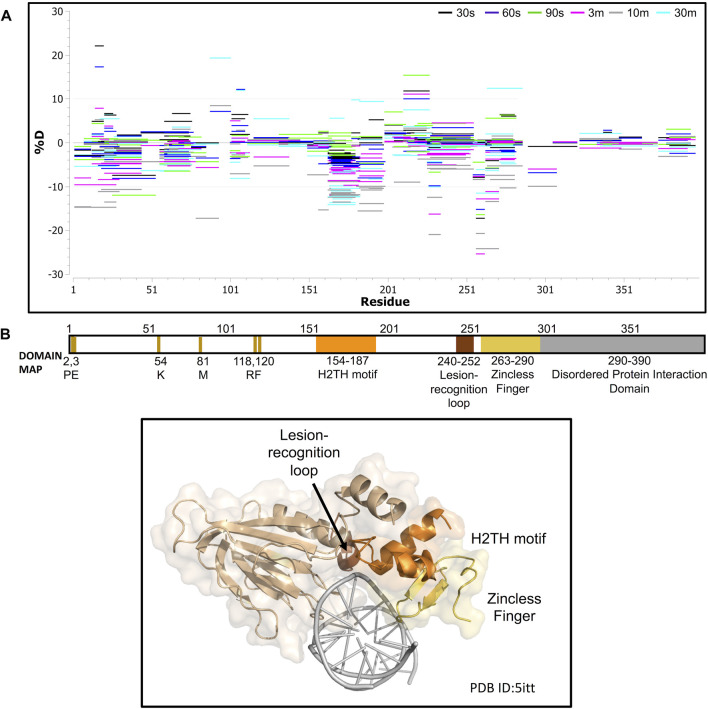
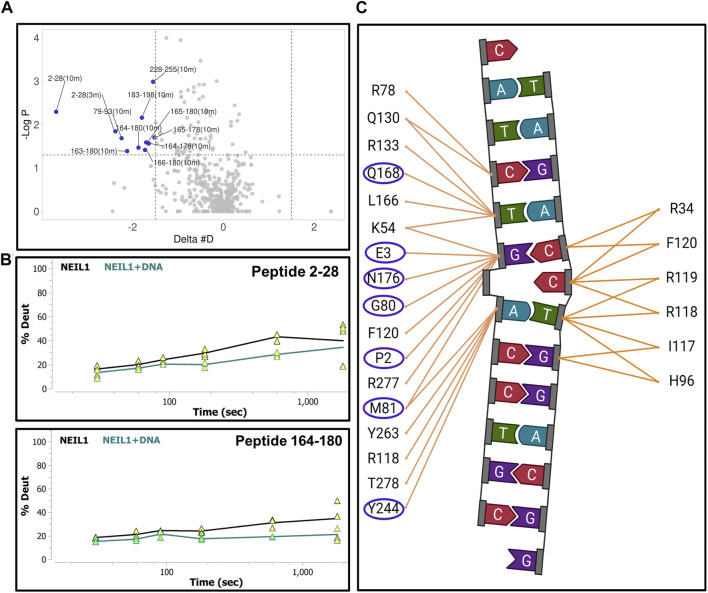
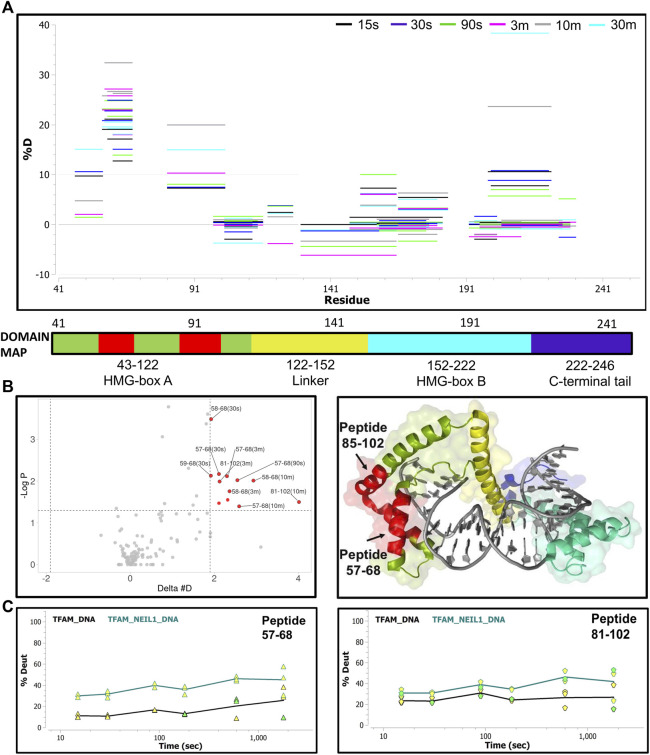
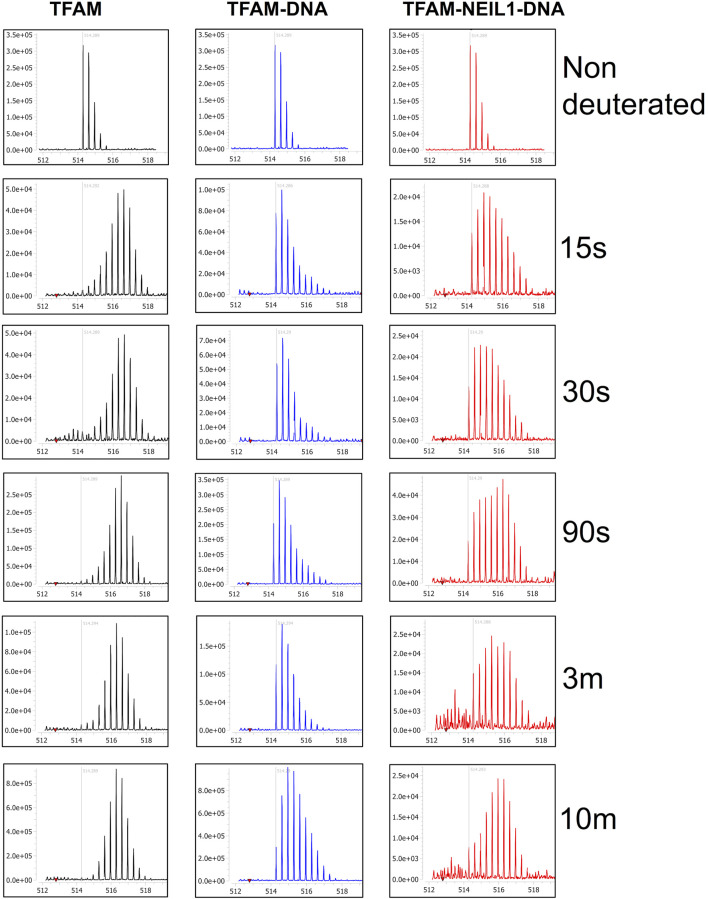
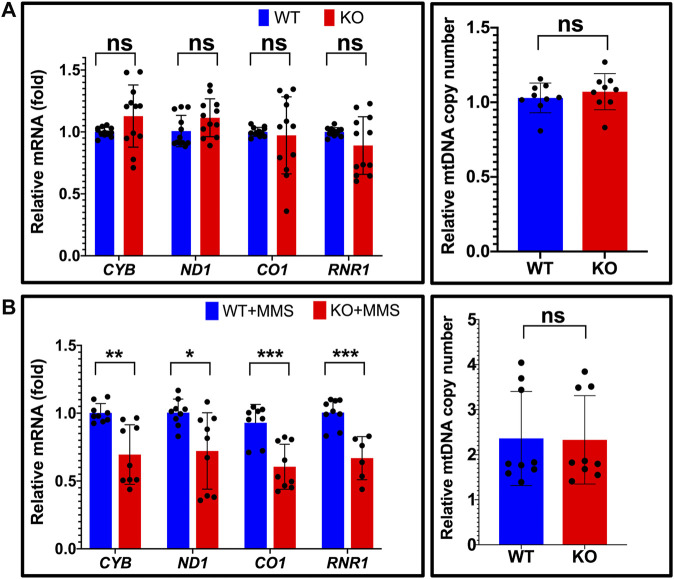
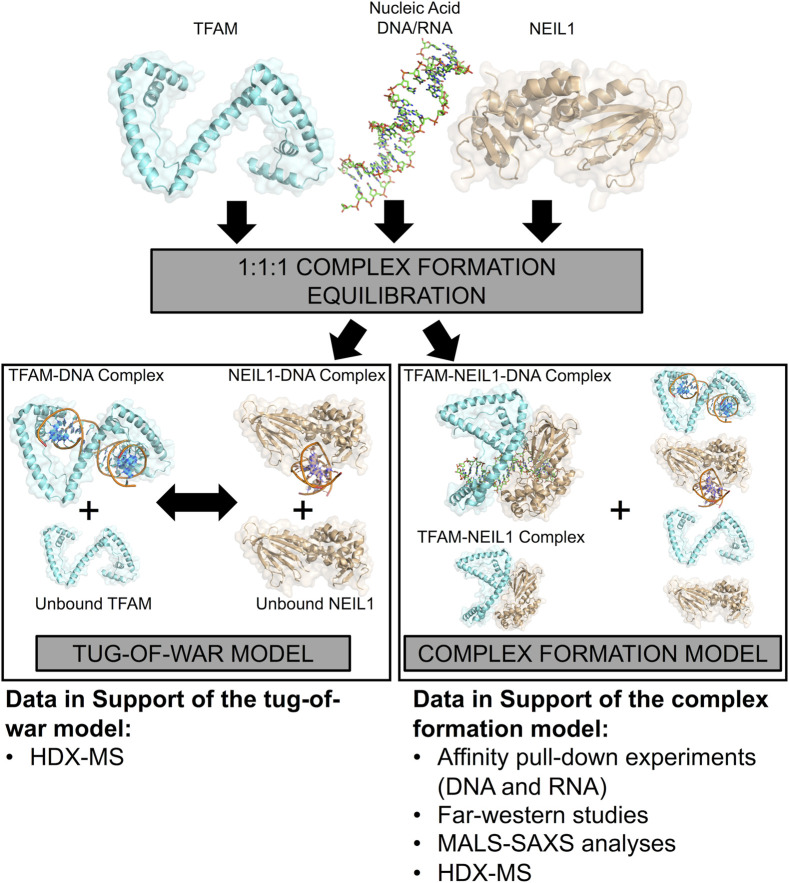
The maintenance of human mitochondrial DNA (mtDNA) is critical for proper cellular function as damage to mtDNA, if left unrepaired, can lead to a diverse array of pathologies. Of the pathways identified to participate in DNA repair within the mitochondria, base excision repair (BER) is the most extensively studied. Protein-protein interactions drive the step-by-step coordination required for the successful completion of this pathway and are important for crosstalk with other mitochondrial factors involved in genome maintenance. Human NEIL1 is one of seven DNA glycosylases that initiates BER in both the nuclear and mitochondrial compartments. In the current work, we scrutinized the interaction between NEIL1 and mitochondrial transcription factor A (TFAM), a protein that is essential for various aspects of mtDNA metabolism. We note, for the first time, that both the N- and C- terminal domains of NEIL1 interact with TFAM revealing a unique NEIL1 protein-binding interface. The interaction between the two proteins, as observed biochemically, appears to be transient and is most apparent at concentrations of low salt. The presence of DNA (or RNA) also positively influences the interaction between the two proteins, and molar mass estimates indicate that duplex DNA is required for complex formation at higher salt concentrations. Hydrogen deuterium exchange mass spectrometry data reveal that both proteins exchange less deuterium upon DNA binding, indicative of an interaction, and the addition of NEIL1 to the TFAM-DNA complex alters the interaction landscape. The transcriptional activity of TFAM appears to be independent of NEIL1 expression under normal cellular conditions, however, in the presence of DNA damage, we observe a significant reduction in the mRNA expression of TFAM-transcribed mitochondrial genes in the absence of NEIL1. Overall, our data indicate that the interaction between NEIL1 and TFAM can be modulated by local environment such as salt concentrations, protein availability, the presence of nucleic acids, as well as the presence of DNA damage.

Keywords: HDX-MS (hydrogen–deuterium exchange mass-spectrometry); NEIL1 DNA glycosylase; base excision repair (BER); mitochondrial transcription factor A (TFAM); small angle X-ray scattering (SAXS).


Conflict of interest statement

The authors declare that the research was conducted in the absence of any commercial or financial relationships that could be construed as a potential conflict of interest.

Figures

FIGURE 1
FIGURE 1
Affinity pull-down experiments reveal an interaction between recombinantly purified NEIL1 and TFAM. (A) Flag-tagged, full-length NEIL1 (NEIL1-FL) was used to pull down TFAM in the presence and absence of a specific DNA (SD) sequence containing an abasic site in a buffer containing 100 mM NaCl. TFAM was observed in the elution fractions in both the presence and absence of SD. mtSSB was used as a positive control as we previously documented the interaction between NEIL1 and mtSSB. (B) The purified proteins were treated with Benzonase prior to complex formation to eliminate nucleic acid contamination followed by the pull-down experiment. TFAM was observed in elution fractions containing either 100 mM NaCl in the buffer, or 100 mM KCl in the buffer (C) in the both Benzonase treated or non-treated samples indicating that there is a direct interaction between the two proteins.
FIGURE 2
FIGURE 2
Affinity pull-down experiments display an interaction between NEIL1 and TFAM using recombinantly purified proteins. (A) Flag tagged NEIL1 was used to pull down TFAM in the presence of RNA in a buffer containing 100 mM NaCl. TFAM is observed in the elution fractions in the absence and presence of RNA. (B) Flag tagged NEIL1 was used to pull down TFAM in the presence of RNA in a buffer containing 100 mM KCl. Under these conditions, TFAM is also observed in the elution fractions in the absence and presence of RNA. (C) The reverse pull-down experiment using Flag-tagged TFAM was performed. Full-length NEIL1 (NEIL1-FL) and a truncated NEIL1 enzyme lacking 100 residues from disordered C-terminal region (NEIL1-Δ100) were observed in the elution fractions in the presence and absence of DNA. Non-specific binding of untagged TFAM, NEIL1-FL, and NEIL1-Δ100 with Flag beads was not detected as shown in elution fractions when the interaction partner is absent.
FIGURE 3
FIGURE 3
Far-western analysis indicates that NEIL1 interacts with TFAM via multiple binding sites present at both the N- and C-terminal domains. (A) A map of the His-tagged polypeptides of NEIL1 lacking portions of the C-terminal disordered tail and the GST-tagged C-terminal polypeptides of NEIL1 lacking the N-terminal portion of the enzyme. (B) Far-western analysis to determine the minimal region of NEIL1 required for interaction with TFAM. All proteins used in this study were expressed in E. coli, purified to homogeneity, and verified by sodium dodecyl sulfate-polyacrylamide gel electrophoresis (SDS-PAGE) analysis stained with Coomassie blue. 50 pmol of NEIL1 and the truncated enzymes, bovine serum albumin (negative control), glutathione S-transferase (negative control), and 1 pmol of TFAM (positive control) were loaded onto the gel. Far-western analysis was performed where proteins were transferred to a PVDF membrane, denatured, slowly renatured on the membrane, incubated with 10 pmol/ml purified TFAM, and probed with an anti-TFAM antibody to detect an interaction.
FIGURE 4
FIGURE 4
Hydrogen-deuterium exchange of the TFAM-DNA complex reveals the regions of TFAM involved with DNA binding. (A) Woods plot representing the distribution of TFAM regions displaying differential levels of solvent protection in the presence of DNA. Percent change in deuteration for peptides after various time points (15 s–30 m) between TFAM and the TFAM-DNA complex, where a negative percentage indicates less deuteration and more protection due to complex formation with the DNA. Each horizontal line in the plot represents an individual peptide with residue range on the X-axis and deuteration level i.e., level of protection on the Y-axis. (B) The domain map and cartoon representation of the crystal structure of the TFAM-DNA complex (PDB ID:4nnu) are displayed. In the structure, the DNA is colored grey and each region is color-matched to the domain map above.
FIGURE 5
FIGURE 5
Hydrogen-deuterium exchange of the TFAM-DNA complex reveals the regions of TFAM involved with DNA binding. (A) Volcano plot quantifying the significant change in deuteron uptake for each peptide at a given time point. The upper left quadrant of the plot displays peptides (solid blue circles) with a significant decrease in deuteron uptake of the TFAM-DNA complex relative to TFAM alone. This significance is based on two statistical tests performed by the HDExaminer software where the first is a p-value test with a significance cutoff value of <0.05 (i.e., at a confidence level of 95%) and the second is based on whether the difference value on the X-axis (Delta #D) is greater than the replicate variance across all of the data within each specific data set as determined by the program. (B) Representative uptake plots are shown from the HDX-MS time course for peptides 57–68 and 81–102 that are significantly different between the TFAM-DNA and TFAM samples based on the volcano plot in (A). (C) Interaction map showing TFAM residues that interact with DNA in the crystal structure of the TFAM-DNA complex (PDB ID:4nnu). Blue boxes represent residues within peptides that display a significant decrease in deuteration observed in the volcano plot.
FIGURE 6
FIGURE 6
Hydrogen-deuterium exchange experiments for the NEIL1-DNA complex reveals regions of NEIL1 involved with DNA binding. (A) Woods plot representing the distribution of NEIL1 regions displaying differential levels of solvent protection in the presence of DNA. Percent change in deuteration for peptides after various time points (30 s–30 m) between NEIL1 and the NEIL1-DNA complex, where a negative percentage indicates less deuteration and more protection as a result of complex formation between NEIL1 and the DNA. Each horizontal line in the plot represents an individual peptide with residue range on the X-axis and deuteration level i.e., level of protection on the Y-axis. (B) Domain map and cartoon representation of crystal structure of NEIL1-DNA complex (PDB ID:5itt) are displayed. The active site and void-filling residues, and DNA binding motifs are indicated in the domain map. In the structure, the DNA is colored grey, and each region is color-matched to the domain map above.
FIGURE 7
FIGURE 7
Hydrogen-deuterium exchange experiments for the NEIL1-DNA complex reveals regions of NEIL1 involved with DNA binding. (A) Volcano plot quantifying the significant change in deuteron uptake for each peptide at a given time point. The upper left quadrant displays peptides (solid blue circles) at various time points, representing a significant decrease in deuteron uptake upon DNA binding to NEIL1 relative to NEIL1 alone at a p-value of <0.05 (please refer to the legend for Figure 5A for a detailed description of the statistical tests used). (B) Representative uptake plots are shown from the HDX-MS time course for two of the significant peptides, 2–28 and 164–180, that lie within the significant quadrant in panel (A) above. (C) Interaction map showing NEIL1 residues that interact with the DNA in the crystal structure of the NEIL1-DNA complex (PDB ID:5itt). The residues within the blue oval circles indicate those present in peptides with a significant decrease in deuteration, as observed in the volcano plot.
FIGURE 8
FIGURE 8
Hydrogen-deuterium exchange analysis of the TFAM-DNA and TFAM-NEIL1-DNA complexes reveals putative TFAM regions that interact with NEIL1 in the presence of DNA. (A) Woods plot representing percent change in deuteration for peptides after various time points (15 s–30 m) between the TFAM-DNA and TFAM-NEIL1-DNA complexes, where a positive percentage indicates more deuteration and less protection observed when NEIL1 is present within the TFAM-NEIL1-DNA complex. Each horizontal line in the plot represents an individual peptide with residue range on the X-axis and deuteration level i.e., level of protection on the Y-axis. (B) Volcano plot displaying TFAM peptides with a statistically significant increase in deuteration (p-value < 0.05; please refer to the legend for Figure 5A for a detailed description of the statistical tests used) in the TFAM-NEIL1-DNA complex indicated as solid red circles (left panel). On the right panel, the peptides with a significant increase in deuteration are mapped on the crystal structure of the TFAM-DNA complex (PDB ID:4nnu) and are highlighted in red. The domain map above also displays the two regions (red) that show the greatest difference in deuterium uptake upon the addition of NEIL1. (C) Representative uptake plots are shown from the HDX-MS time course for peptides 57–68 and 81–102 that lie within the significance quadrant of the volcano plot in (B).
FIGURE 9
FIGURE 9
Isotopic mass distribution spectra reveal bimodal deuterium exchange upon the addition of NEIL1 to the TFAM-DNA complex. Isotopic mass distribution spectra from representative HDX-MS experiments for the peptide containing TFAM residues 57–68 at various time points as indicated (15 s–10 m). The distribution pattern for TFAM alone (black) displays greater deuterium exchange when compared to the TFAM-DNA complex (blue), which appears to exchange less deuterium. The addition of NEIL1 to the sample mixture (TFAM-NEIL1-DNA complex; red) reveals a bimodal isotopic mass distribution, which likely results from the presence of multiple species (protein-protein; protein-DNA; protein-protein-DNA; or protein alone) within the sample. The grey line within each plot indicates an m/z value of 514.29 corresponding to the non-deuterated peptide.
FIGURE 10
FIGURE 10
Estimation of relative mitochondrial mRNA expression reveals that NEIL1 is necessary for efficient transcription by TFAM upon DNA damage. (A) Left, the relative mRNA expression of four mitochondrial genes encoding Cytochrome b (CYB), NADH dehydrogenase subunit 1 (ND1), Cytochrome c oxidase I (CO1), and 12S ribosomal RNA (RNR1) were estimated by qRT-PCR in untreated Hap1 cell lines where the expression of NEIL1 is either intact (i.e., wild-type, WT) or knocked out (i.e., KO). Right, estimation of mitochondrial copy number by qPCR in the WT and KO cell lines. (B) Left, the relative mRNA expression of the above four mitochondrial genes in the WT and KO Hap1 cells treated with 125 μM MMS for 3 days prior to gene expression analysis. Right, estimation of mitochondrial copy number by qPCR in the WT and KO cell lines after MMS treatment. Statistical analysis was performed in GraphPad Prism using a Student’s t-test where ns, not significant; *p < 0.05; **p < 0.01; and ***p < 0.001.
FIGURE 11
FIGURE 11
A model representing the interaction between NEIL1 and TFAM in the presence and absence of nucleic acid binding partners. Two scenarios are possible, when NEIL1, TFAM, and DNA are mixed in a 1:1:1 M ratio. In the tug-of-war model, the two proteins compete to form protein-DNA complexes, whereas, in the complex formation model, a small fraction of both proteins interact in the presence and absence of DNA, forming a complex. Species containing protein-DNA complexes or unbound-protein/DNA are also possible in this scenario. The HDX-MS data alone are insufficient to distinguish between the two proposed models but support for the complex formation model is also provided by pull-down, far-western, MALS, and SAXS analyses.

Similar articles

Cited by

References

    1. Acuner Ozbabacan S. E., Engin H. B., Gursoy A., Keskin O. (2011). Transient protein-protein interactions. Protein Eng. Des. Sel. 24, 635–648. 10.1093/protein/gzr025 - DOI - PubMed
    1. Alam T. I., Kanki T., Muta T., Ukaji K., Abe Y., Nakayama H., et al. (2003). Human mitochondrial DNA is packaged with TFAM. Nucleic Acids Res. 31, 1640–1645. 10.1093/nar/gkg251 - DOI - PMC - PubMed
    1. Albelazi M. S., Martin P. R., Mohammed S., Mutti L., Parsons J. L., Elder R. H., et al. (2019). The biochemical role of the human NEIL1 and NEIL3 DNA glycosylases on model DNA replication forks. Genes (Basel) 10, 315. 10.3390/genes10040315 - DOI - PMC - PubMed
    1. Anderson S., Bankier A. T., Barrell B. G., De Bruijn M. H., Coulson A. R., Drouin J., et al. (1981). Sequence and organization of the human mitochondrial genome. Nature 290, 457–465. 10.1038/290457a0 - DOI - PubMed
    1. Anson R. M., Hudson E., Bohr V. A. (2000). Mitochondrial endogenous oxidative damage has been overestimated. FASEB J. 14, 355–360. 10.1096/fasebj.14.2.355 - DOI - PubMed

LinkOut - more resources