. 2022 Jul 22:10:919731.
doi: 10.3389/fcell.2022.919731. eCollection 2022.

Single-Cell Transcriptomics of Proliferative Phase Endometrium: Systems Analysis of Cell-Cell Communication Network Using CellChat

Affiliations

Single-Cell Transcriptomics of Proliferative Phase Endometrium: Systems Analysis of Cell-Cell Communication Network Using CellChat

Zishui Fang et al. Front Cell Dev Biol. .

Abstract

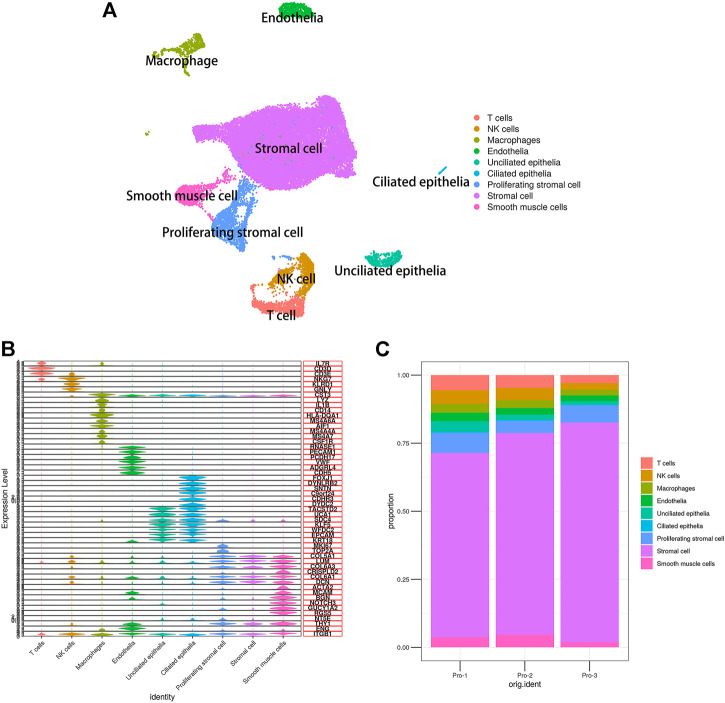
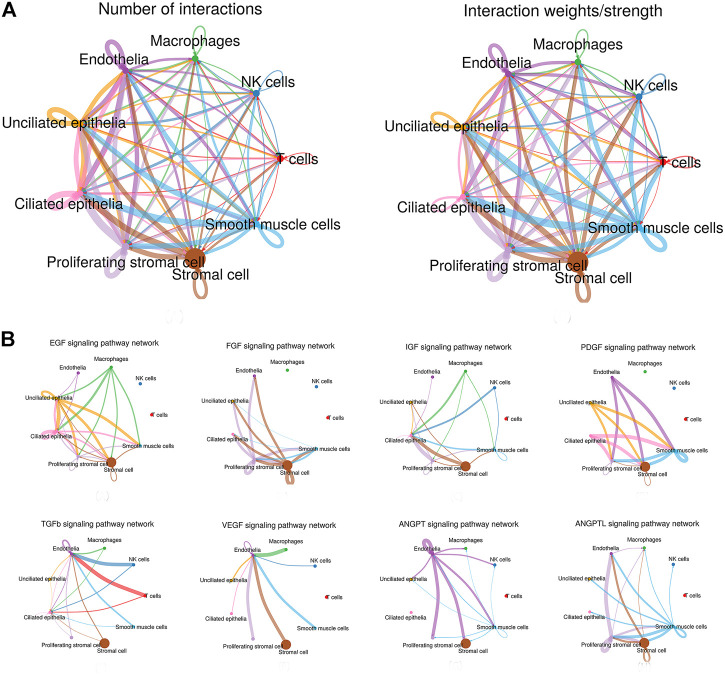
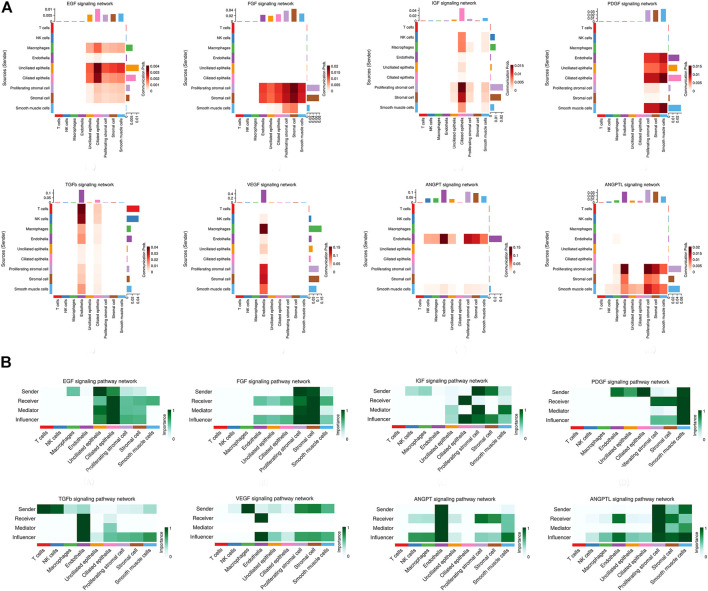
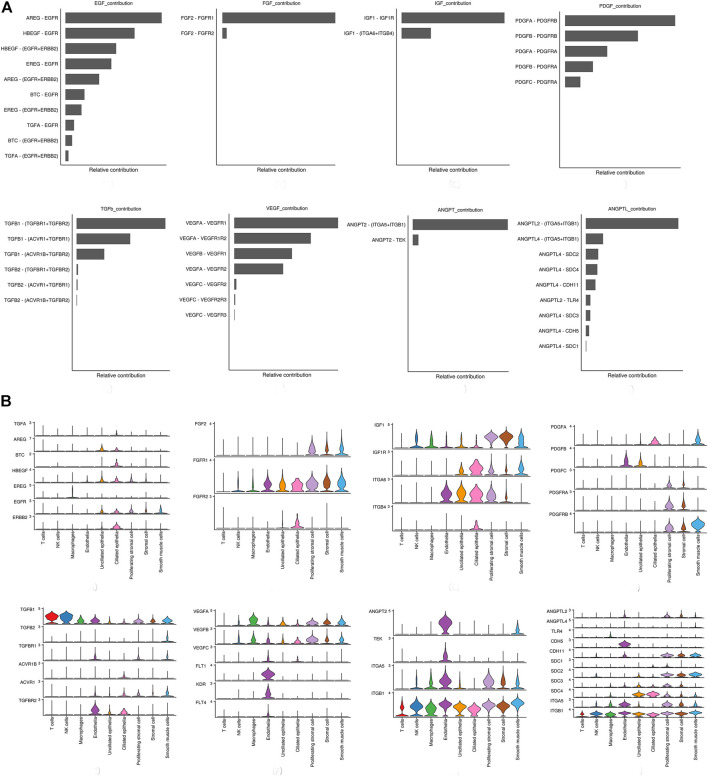
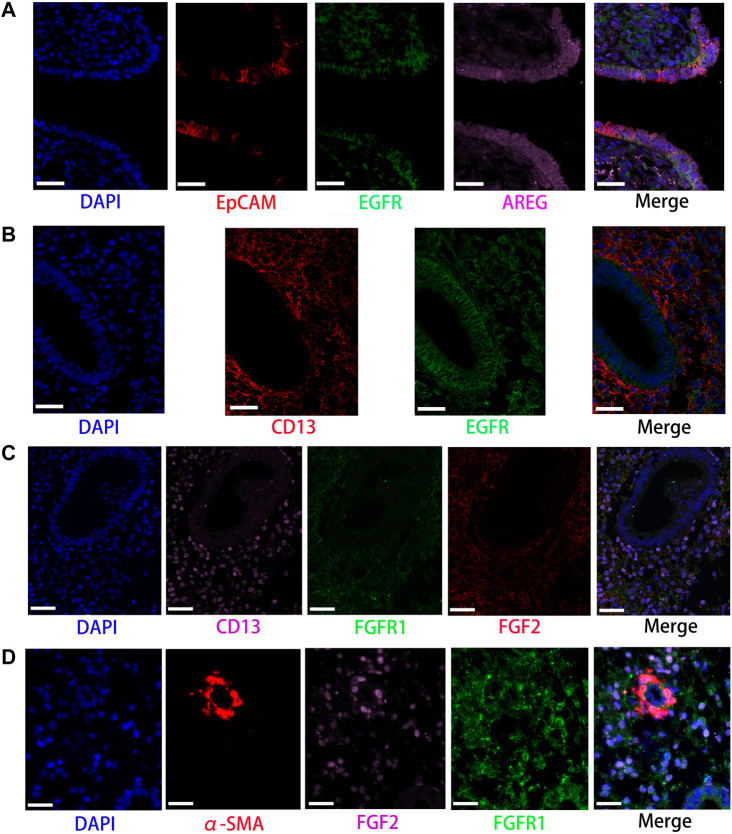
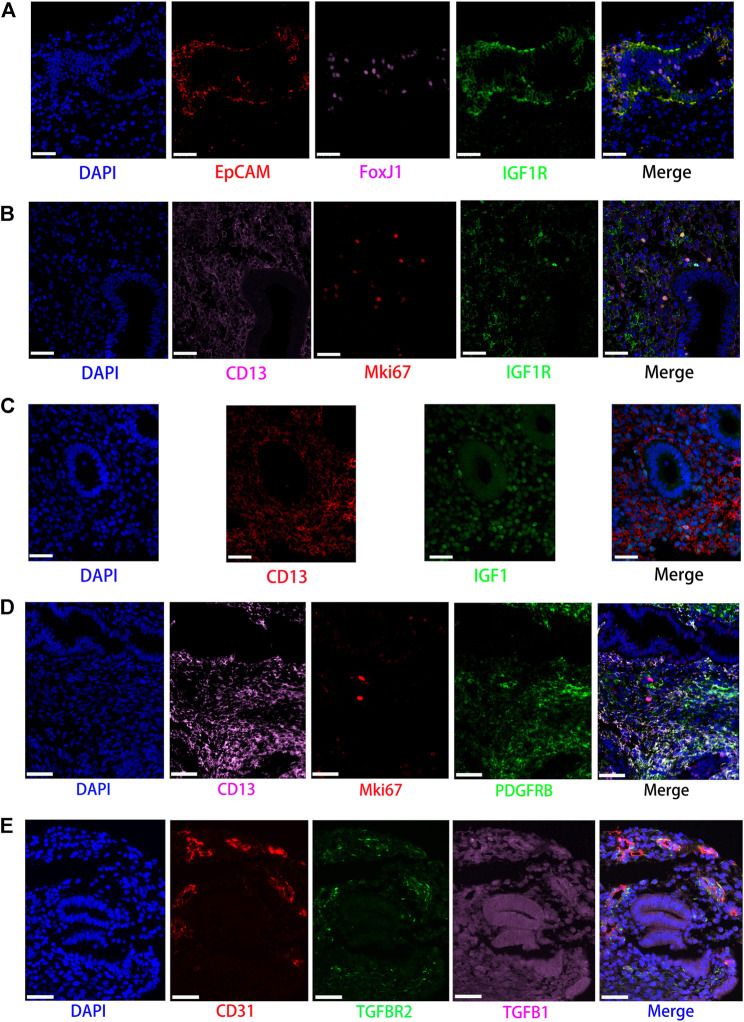
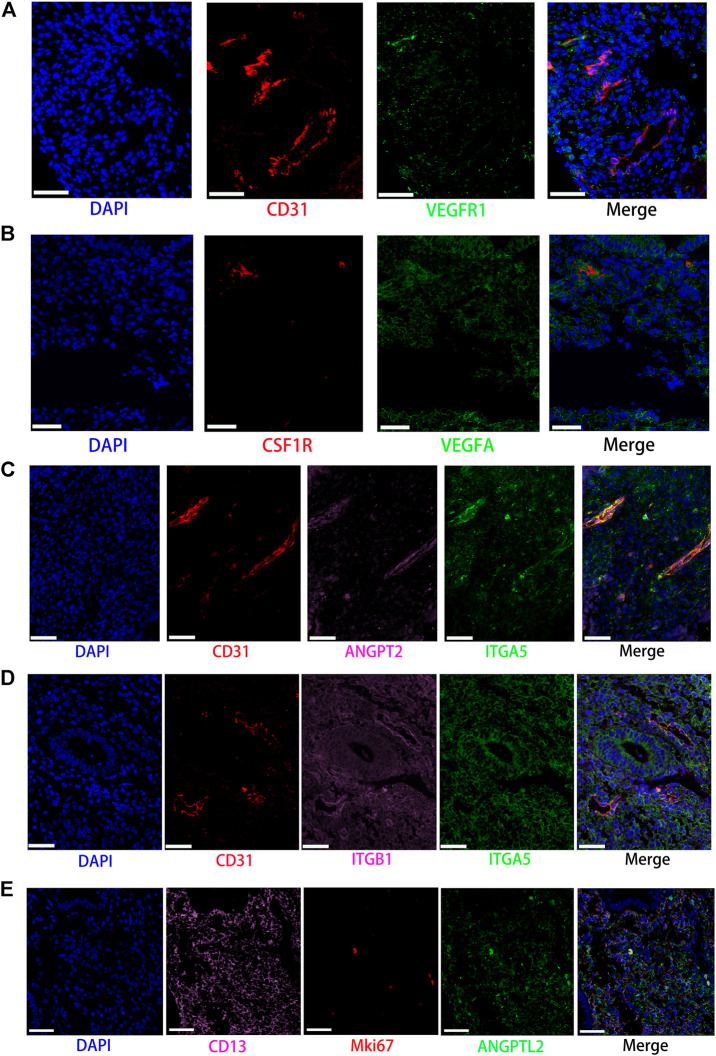
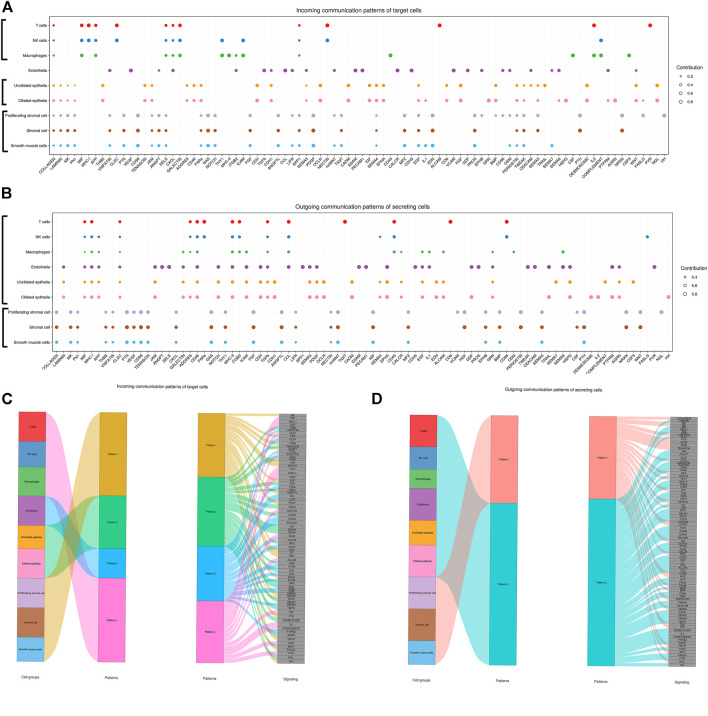
The endometrium thickness increases by which endometrial angiogenesis occurs in parallel with the rapid growth of endometrium during the proliferative phase, which is orchestrated by complex cell-cell interactions and cytokine networks. However, the intercellular communication has not been fully delineated. In the present work, we studied the cell-cell interactome among cells of human proliferative phase endometrium using single-cell transcriptomics. The transcriptomes of 33,240 primary endometrial cells were profiled at single-cell resolution. CellChat was used to infer the cell-cell interactome by assessing the gene expression of receptor-ligand pairs across cell types. In total, nine cell types and 88 functionally related signaling pathways were found. Among them, growth factors and angiogenic factor signaling pathways, including EGF, FGF, IGF, PDGF, TGFb, VEGF, ANGPT, and ANGPTL that are highly associated with endometrial growth, were further analyzed and verified. The results showed that stromal cells and proliferating stromal cells represented cell-cell interaction hubs with a large number of EGF, PDGF incoming signals, and FGF outgoing signals. Endothelial cells exhibited cell-cell interaction hubs with a plenty of VEGF, TGFb incoming signals, and ANGPT outgoing signals. Unciliated epithelial cells, ciliated epithelial cells, and macrophages exhibited cell-cell interaction hubs with substantial EGF outgoing signals. Ciliated epithelial cells represented cell-cell interaction hubs with a large number of IGF and TGFb incoming signals. Smooth muscle cells represented lots of PDGF incoming signals and ANGPT and ANGPTL outgoing signals. This study deconvoluted complex intercellular communications at the single-cell level and predicted meaningful biological discoveries, which deepened the understanding of communications among endometrial cells.

Keywords: angiogenesis; cell communication network; endometrium; proliferation; single-cell sequencing.


Conflict of interest statement

The authors declare that the research was conducted in the absence of any commercial or financial relationships that could be construed as a potential conflict of interest.

Figures

FIGURE 1
FIGURE 1
Single-cell expression atlas of human proliferating phase endometrium. (A) Cell type assignment following UMAP-based visualization of expression differences for 33,240 single cells from three healthy human proliferating phase endometrium samples using established lineage markers. (B) Violin plots showing the expression of known lineage markers and coexpressed lineage-specific genes. (C) Proportion of cell types of three healthy human proliferating phase endometrium samples.
FIGURE 2
FIGURE 2
Interaction plot of endometrial cells and intercellular communication networks for spatially colocalized endometrial cell populations. (A) Interaction net count plot of endometrial cells. The interaction weight plot of endometrial cells. The thicker the line represented, the more the number of interactions, and the stronger the interaction weights/strength between the two cell types. (B) Intercellular communication networks for spatially colocalized endometrial cell populations. The circle plot showed the inferred intercellular communication network for proliferation and angiogenesis-related signaling pathways. The thicker the line represented, the more the number of interactions, and the stronger the interaction weights/strength between the two cell types.
FIGURE 3
FIGURE 3
Heatmap of signaling pathways related to proliferation and angiogenesis and the relative importance of each cell group based on the computed network centrality measures of signaling networks. (A) For the heatmap of signaling pathways related to proliferation and angiogenesis. The communication probability of a signaling pathway was computed by summarizing the probabilities of its associated ligand–receptor pairs. The darker the color, the greater the communication probability between the two cell types. (B) For the relative importance of each cell group based on the computed network centrality measures of signaling networks. Influencer represents a kind of cell that can control information flow within a signaling network, and a higher value indicates greater control on the information flow. Gatekeeper represents a kind of cell that can control communication flow between any two cell groups, and a higher value indicates greater capability to control the communication flow. The meaning of importance is the magnitude of the possibility of four roles (sender, receiver, mediator, and influencer) that the cell types play. The darker the color, the greater the role cells play.
FIGURE 4
FIGURE 4
Relative contribution of each ligand–receptor pair to the overall communication network of signaling pathways and the expression patterns of signaling genes involved in the inferred signaling network. (A) Relative contribution of each ligand–receptor pair to the overall communication network of signaling pathways, which is the ratio of the total communication probability of the inferred network of each ligand–receptor pair to that of signaling pathways. (B) Violin plot showing the expression patterns of signaling genes involved in the inferred signaling network. Normalized expression levels are shown in the violin plot.
FIGURE 5
FIGURE 5
Partly ligand and receptor immunofluorescence staining of EGF and FGF signaling pathway. (A) Co-staining of EpCAM (epithelia, red) with EGF receptor (green), AREG (pink), and nucleus (blue) by immunofluorescence. (B) Co-staining of CD13 (stromal cells, red) with EGF (green) and nucleus (blue) by immunofluorescence. (C) Co-staining of CD13 (stromal cells, pink) with FGFR1 (green), FGF2 (red), and nucleus (blue) by immunofluorescence. (D) Co-staining of α-SMA (smooth muscle cells, red) with FGFR1 (green), FGF2 (pink), and nucleus (blue) by immunofluorescence. (Scale bars = 50 μm).
FIGURE 6
FIGURE 6
Partly ligand and receptor immunofluorescence staining of the IGF, PDGF, as well as TGFb signaling pathway. (A) Co-staining of EpCAM (epithelial cell, red) with FoxJ1 (Cilia, pink), IGF1R (green), and nucleus (blue) by immunofluorescence. (B) Co-staining of CD13 (stromal cell, pink) with Mki67 (red), IGF1R (green), and nucleus (blue) by immunofluorescence. (C) Co-staining of CD13 (stromal cell, red) with IGF1 (green) and nucleus (blue) by immunofluorescence. (D) Co-staining of CD13 (stromal cells, pink) with MKI67 (red), PDGFRB (green), and nucleus (blue) by immunofluorescence. (E) Co-staining of CD31 (endothelial cell, red) with TGFBR2 (green), TGFB1 (pink), as well as nucleus (blue) by immunofluorescence. (Scale bars = 50 μm).
FIGURE 7
FIGURE 7
Partly ligand and receptor immunofluorescence staining of VEGF, ANGPT, as well as ANGPTL signaling pathway. (A) Co-staining of CD31 (endothelial cell, red) with VEGFR1 (green) and nucleus (blue) by immunofluorescence. (B) Co-staining of CSF1R (macrophage, red) with VEGFA (green) and nucleus (blue) by immunofluorescence. (C) Co-staining of CD31 (endothelial cell, red) with ANGPT2 (pink) and ITGA5 (green) as well as nucleus (blue) by immunofluorescence. (D) Co-staining of CD31 (endothelial cell, red) with ITGB1 (pink) and ITGA5 (green) as well as nucleus (blue) by immunofluorescence. (E) Co-staining of CD13 (stromal cell, pink) with MKI67 (red) and ANGPTL2 (green) as well as nucleus (blue) by immunofluorescence. (Scale bars = 50 μm).
FIGURE 8
FIGURE 8
Inferred incoming and outgoing communication patterns of endometrial cells. Incoming patterns show how the target cells (i.e., cells as signal receivers) coordinate with each other as well as how they coordinate with certain signaling pathways to respond to incoming signals. Outgoing patterns reveal how the sender cells (i.e., cells as signal sources) coordinate with each other as well as how they coordinate with certain signaling pathways to drive communication. Simply put, cell communication patterns are classified according to the similarity of cell communication. (A) Dot plot exhibited incoming communication patterns of target cells. (B) Dot plot exhibited outgoing communication patterns of secreting cells. (C) Inferred incoming communication patterns of target cells. Incoming patterns show how the target cells coordinate with each other as well as how they coordinate with certain signaling pathways to respond to signals. (D) Inferred outgoing communication patterns of secreting cells, which show the correspondence between the inferred latent patterns and cell groups, as well as signaling pathways. The thickness of the flow indicates the contribution of the cell group or signaling pathway to each latent pattern.

Similar articles

Cited by

References

    1. Abudukeyoumu A., Li M. Q., Xie F. (2020). Transforming Growth Factor-β1 in Intrauterine Adhesion. Am. J. Reprod. Immunol. 84 (2), e13262. 10.1111/aji.13262 - DOI - PubMed
    1. Aghajanova L., Bjuresten K., Altmäe S., Landgren B.-M., Stavreus-Evers A. (2008). HB-EGF but Not Amphiregulin or Their Receptors HER1 and HER4 Is Altered in Endometrium of Women with Unexplained Infertility. Reprod. Sci. 15 (5), 484–492. 10.1177/1933719108314624 - DOI - PubMed
    1. Albrecht E. D., Pepe G. J. (2003). Steroid Hormone Regulation of Angiogenesis in the Primate Endometrium. Front. Biosci. 8, d416–429. 10.2741/1001 - DOI - PubMed
    1. Annunziata M., Luque R. M., Duran-Prado M., Baragli A., Grande C., Volante M., et al. (2012). Somatostatin and Somatostatin Analogues Reduce PDGF-Induced Endometrial Cell Proliferation and Motility. Hum. Reprod. 27 (7), 2117–2129. 10.1093/humrep/des144 - DOI - PubMed
    1. Ariyanti A. D., Sisjayawan J., Zhang J., Zhang J.-Q., Wang G.-X., Miyagishi M., et al. (2017). Elevating VEGF-A and PDGF-BB Secretion by Salidroside Enhances Neoangiogenesis in Diabetic Hind-Limb Ischemia. Oncotarget 8 (57), 97187–97205. 10.18632/oncotarget.21907 - DOI - PMC - PubMed

LinkOut - more resources