

Dynamics of thyroid diseases and thyroid-axis gland masses
- PMID: 35938225
- PMCID: PMC9358402
- DOI: 10.15252/msb.202210919
Dynamics of thyroid diseases and thyroid-axis gland masses
Abstract
Thyroid disorders are common and often require lifelong hormone replacement. Treating thyroid disorders involves a fascinating and troublesome delay, in which it takes many weeks for serum thyroid-stimulating hormone (TSH) concentration to normalize after thyroid hormones return to normal. This delay challenges attempts to stabilize thyroid hormones in millions of patients. Despite its importance, the physiological mechanism for the delay is unclear. Here, we present data on hormone delays from Israeli medical records spanning 46 million life-years and develop a mathematical model for dynamic compensation in the thyroid axis, which explains the delays. The delays are due to a feedback mechanism in which peripheral thyroid hormones and TSH control the growth of the thyroid and pituitary glands; enlarged or atrophied glands take many weeks to recover upon treatment due to the slow turnover of the tissues. The model explains why thyroid disorders such as Hashimoto's thyroiditis and Graves' disease have both subclinical and clinical states and explains the complex inverse relation between TSH and thyroid hormones. The present model may guide approaches to dynamically adjust the treatment of thyroid disorders.
Keywords: HPT; hysteresis; pituitary; systems biology; thyroid disorders.
© 2022 The Authors. Published under the terms of the CC BY 4.0 license.
Figures
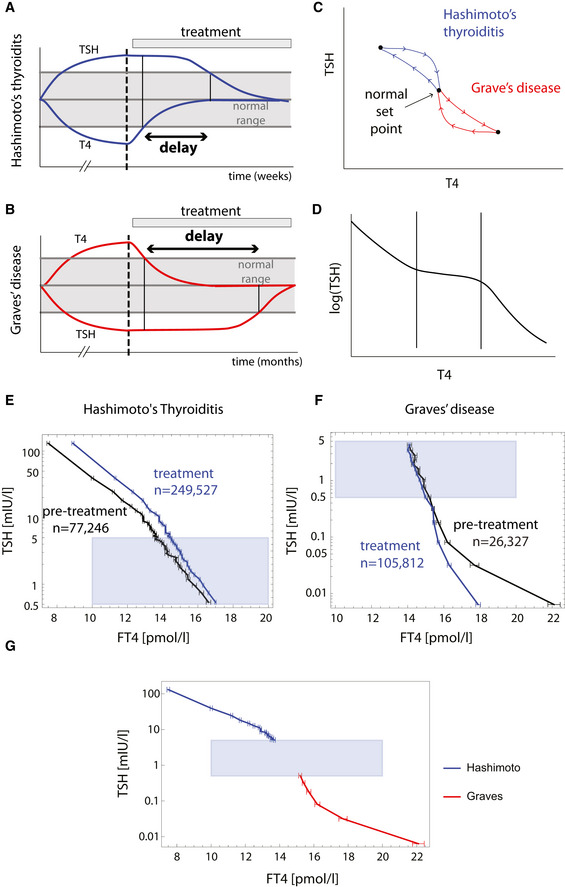
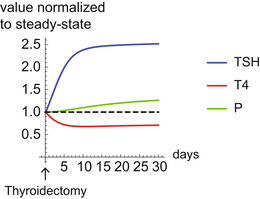
- A, B
Hysteresis is a delay of serum TSH level equilibration after thyroxine level is normalized. It occurs when thyroid disorders are treated, as schematically seen in Hashimoto's thyroiditis (A) and Graves' disease (B). Note that the disease develops on a much longer timescale than the treatment part of the Figure.
- C
Hysteresis can be visualized as a loop in the TSH‐T4 plane.
- D
Schematic of three‐regime TSH‐T4 relation.
- E
Mean FT4 in bins of TSH in a population before and after treatment of Hashimoto's thyroiditis from the Clalit dataset.
- F
Mean FT4 in bins of TSH in a population before and after treatment of Graves' disease from Clalit dataset. Gray regions in (E) and (F) are TSH and FT4 in their normal range. Error bars are standard errors.
- G
Pretreatment means and standard errors for Hashimoto (blue) and Graves (red) patients (same data as in E, F), together with the normal TSH, FT4 range for reference (gray rectangle), forming the inverse “log‐linear” TSH‐FT4 relation.
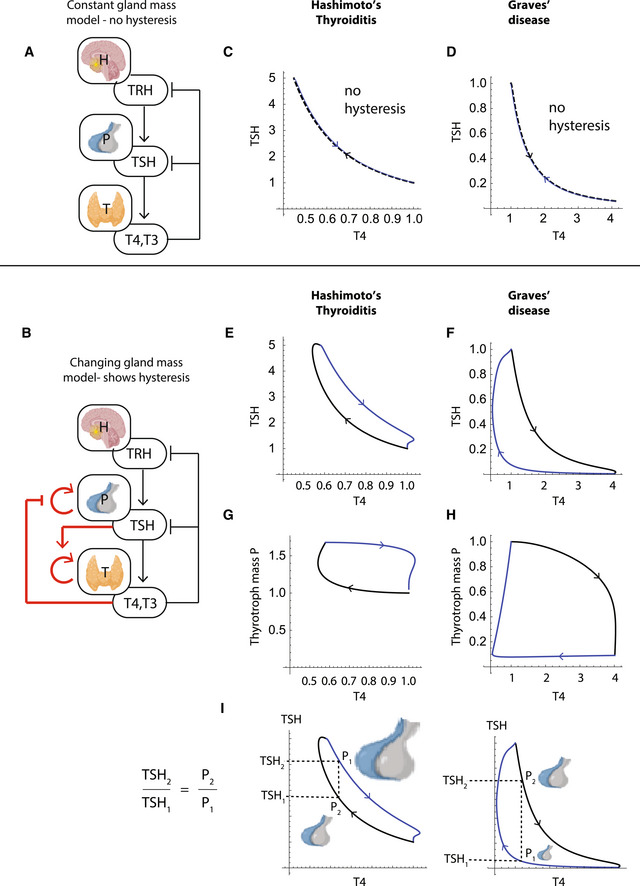
- A
HPT model with constant gland mass.
- B
HPT model with gland‐mass changes, with new interactions in red. Thyrotroph and thyrocyte turnover times are on the order of a month.
- C, D
The constant mass model does not show hysteresis in simulations of (C) Hashimoto's thyroiditis and (D) Graves' disease. TSH is uniquely determined by TH levels.
- E, F
TSH‐T4 trajectories in a model with gland‐mass changes show TSH delay in Hashimoto's thyroiditis (E) and in Graves' disease (F).
- G, H
TSH‐thyrotroph mass P trajectories show that the delay is due to an enlarged thyrotroph mass that takes many weeks to shrink back to baseline after T4 is normalized in Hashimoto's thyroiditis (G), or due to atrophied thyrotroph mass that takes months to regrow after T4 is normalized by treatment in Graves' disease (H).
- I
Model indicates that the ratio of thyrotroph masses at a given T4 level before and after treatment is equal to the ratio of TSH levels.
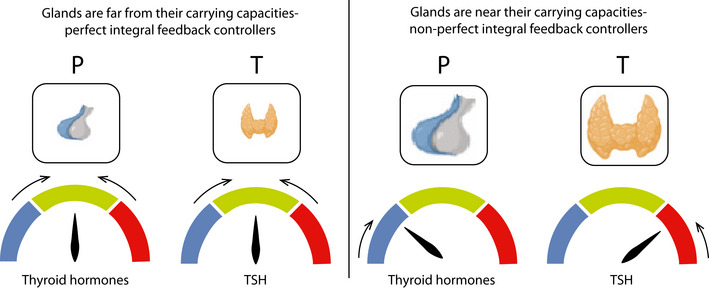
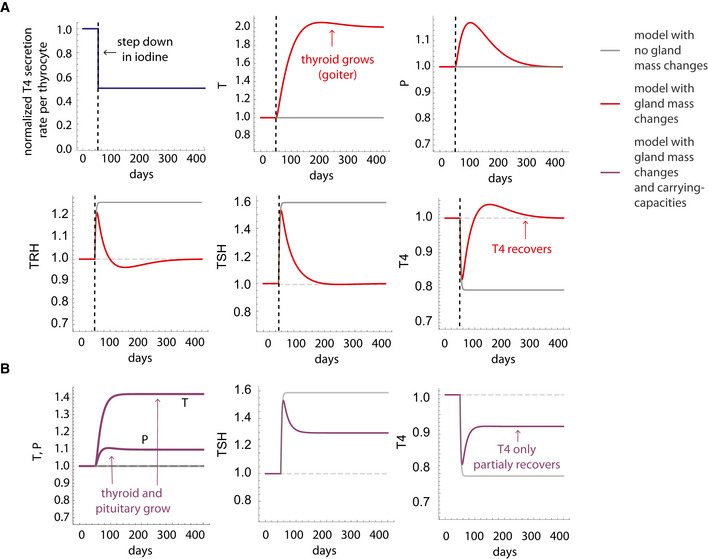
- A
Simulation of a step reduction in maximal TH production per unit thyroid mass, as occurs in iodine deficiency, in the gland‐mass model (without carrying capacities) shows compensation to a euthyroid state: enlarged thyroid, a transient growth in thyrotroph mass and return of hormones to baseline. A model with no gland‐mass changes shows hypothyroidism for the same step change (gray lines).
- B
Adding carrying capacities to the gland‐mass model limits compensation. Simulations show hypothyroidism for a large step reduction in iodine that causes the enlarged thyroid and thyrotroph mass to approach their carrying capacity. Red lines—model with mass changes, purple lines—model with mass changes and carrying capacity, gray lines—model with no gland‐mass changes. For parameters see Materials and Methods.
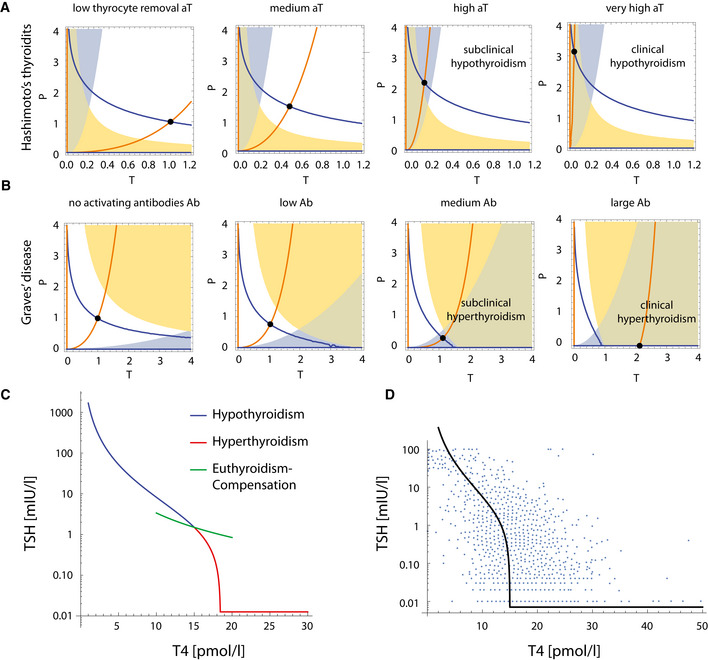
- A
Hashimoto's thyroiditis transitions from a subclinical state when thyroid removal rate is raised moderately, to a clinical hypothyroid state when is very high. The blue line is steady‐state P at a given T (dP/dt = 0 nullcline), and the orange line is steady‐state T at a given P (dT/dt = 0 nullcline). Euthyroid (white), hypothyroid (green), subclinical (hyper‐TSH/normo‐T4, blue), and normo‐TSH/hypo‐T4 (yellow) regions are shown.
- B
Graves' disease transitions from a subclinical state when autoantibody effect Ab is moderate, to clinical hyperthyroidism when Ab is high. Nullclines are as in (A), euthyroid (white), hyperthyroid (green), subclinical (hypo‐TSH/normo‐T4, blue) and normo‐TSH/hyper‐T4 (yellow) regions are shown. Note that in B the colored regions change with parameters because they correspond to hormone levels for equations (1–3), not gland masses (Materials and Methods).
- C
The TSH‐T4 relation in the model shows three regimes. Blue/red curve—analytical solution from the model; Green line—TSH and T4 from the fast timescale relation , shown for T4 values in the normal range.
- D
Non‐parameterized TSH‐T4 relation assuming a healthy set point of T4 = 15 pmol/L, TSH = 1.5 mIU/L, and thyrotroph carrying capacity of fivefold (Khawaja, 2006), with data from Midgley et al (blue points, Materials and Methods) (Midgley et al, 2013).
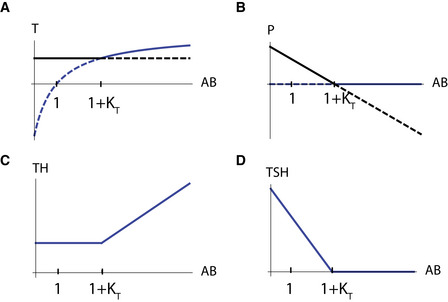
- A–D
Steady‐state values for thyroid gland size T (A), pituitary gland size P (B), thyroid hormone levels TH (C), and TSH levels (D), when perturbing the levels of the normalized thyroid autoantibodies in the system . Black and blue lines in panels A, B are the two fixed points of the system (i) and (ii), respectively, see Appendix Supplementary Text section “Dependence on antibody parameter in Graves' disease”). When the black fixed point is stable (full line) while the blue fixed point is unstable (dashed line). Above this value the fixed point stability switches, in a transcritical bifurcation. When increasing up to , P shrinks and TSH levels drop, compensating for the autoantibodies stimulatory effect, and allowing for T and TH to remain constant (subclinical hyperthyroidism, Figs 4B and EV3C). Crossing this threshold such that , P and TSH become zero and cannot compensate anymore, and thus T and TH rise together with (clinical hyperthyroidism, Figs 4B and EV3E). is the scaled thyroid gland carrying capacity term .
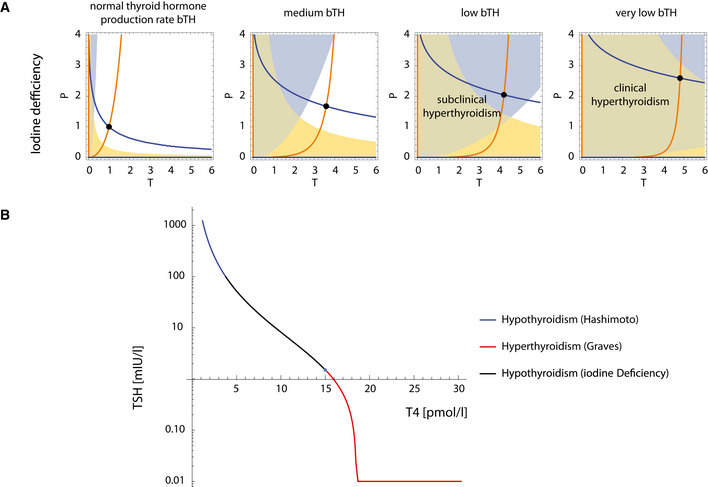
- A
When thyroid hormone production rate per thyrocyte is reduced, the thyroid and pituitary gland grow to compensate. However, when is reduced to extreme values, the system transitions to a subclinical and then a clinical hypothyroid state (Materials and Methods). The blue line is steady‐state P at a given T (dP/dt = 0 nullcline), and the orange line is steady‐state T at a given P (dT/dt = 0 nullcline). Euthyroid (white), hypothyroid (green), subclinical (hyper‐TSH/normo‐T4, blue), and normo‐TSH/hypo‐T4 (yellow) regions are shown.
- B
The TSH‐T4 relation with TSH and T4 fixed points for Hashimoto's thyroiditis and Graves' disease (blue, red, respectively, same as in Fig 4) and in iodine deficiency conditions, determined for a range of values (Materials and Methods).
References
-
- Ahmed M, Banna M, Sakati N, Woodhouse N (1989) Pituitary gland enlargement in primary hypothyroidism: a report of 5 cases with follow‐up data. Horm Res 32: 188–192 - PubMed
-
- Alon U (2019) An introduction to systems biology: design principles of biological circuits second. Boca Raton, FL: Chapman & Hall/CRC;
-
- Andersen S, Pedersen KM, Bruun NH, Laurberg P (2002) Narrow individual variations in serum T4 and T3 in Normal subjects: a clue to the understanding of subclinical thyroid disease. J Clin Endocrinol Metab 87: 1068–1072 - PubMed
-
- Balicer RD, Afek A (2017) Digital health nation: Israel's global big data innovation hub. Lancet 389: 2451–2453 - PubMed
MeSH terms
Substances
LinkOut - more resources
Full Text Sources
Medical
