

Imaging and detection of long-lived fluorescence probes in presence of highly emissive and scattering background
- PMID: 35938479
- PMCID: PMC9679360
- DOI: 10.1177/15353702221112121
Imaging and detection of long-lived fluorescence probes in presence of highly emissive and scattering background
Abstract
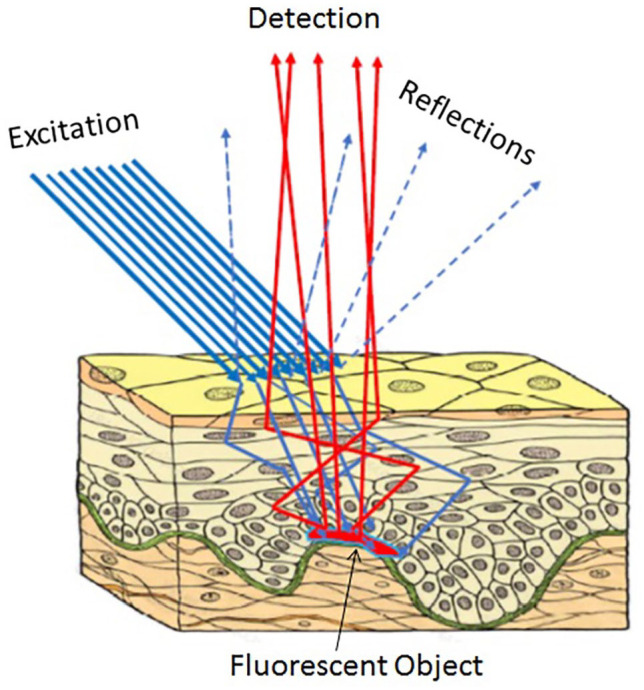
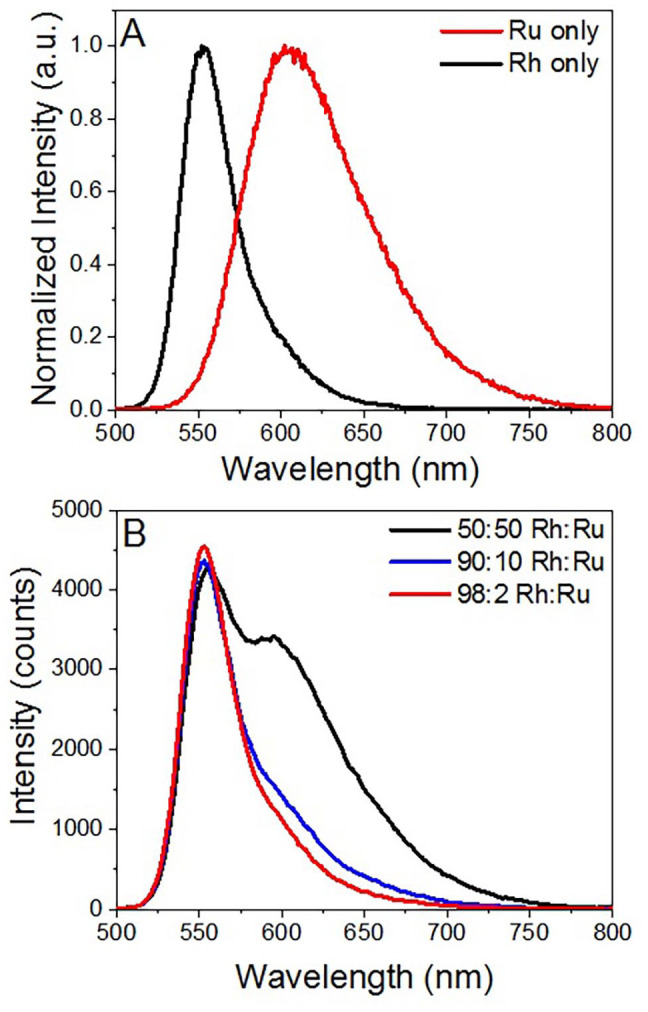
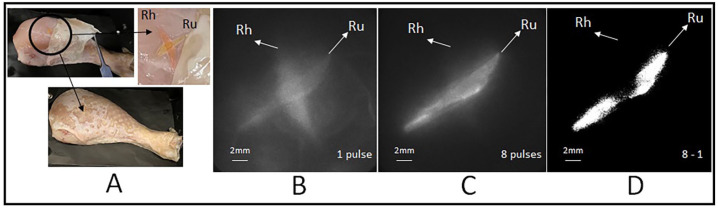
Optical biomedical imaging and diagnostics is a rapidly growing field that provides both structural and functional information with uses ranging from fundamental to practical clinical applications. Nevertheless, imaging/visualizing fluorescence objects with high spatial resolution in a highly scattering and emissive biological medium continues to be a significant challenge. A fundamental limiting factor for imaging technologies is the signal-to-background ratio (SBR). For a long time to improve the SBR, we tried to improve the brightness of fluorescence probes. Many novel fluorophores with improved brightness (almost reaching the theoretical limit), redshifted emission, highly improved photostability, and biocompatibility greatly helped advance fluorescence detection and imaging. However, autofluorescence, scattering of excitation light, and Raman scattering remain fundamental limiting problems that drastically limit detection sensitivity. Similarly, significant efforts were focused on reducing the background. High-quality sample purification eliminates the majority of autofluorescence background and in a limited confocal volume allows detection to reach the ultimate sensitivity to a single molecule. However, detection and imaging in physiological conditions does not allow for any sample (cells or tissue) purification, forcing us to face a fundamental limitation. A significant improvement in limiting background can be achieved when fluorophores with a long fluorescence lifetime are used, and time-gated detection is applied. However, all long-lived fluorophores present low brightness, limiting the potential improvement. We recently proposed to utilize multipulse excitation (burst of pulses) to enhance the relative signal of long-lived fluorophores and significantly improve the SBR. Herein, we present results obtained with multipulse excitation and compare them with standard single-pulse excitation. Subtraction of images obtained with a single pulse from those obtained with pulse burst (differential image) highly limits background and instrumental noise resulting in more specific/sensitive detection and allows to achieve greater imaging depth in highly scattering media, including skin and tissue.
Keywords: DNA intercalator; Multipulsing; bioimaging; biomedical; fluorescence spectroscopy; time-resolved imaging.
Conflict of interest statement
The author(s) declared no potential conflicts of interest with respect to the research, authorship, and/or publication of this article.
Figures


Similar articles
-
Multiple-pulse pumping for enhanced fluorescence detection and molecular imaging in tissue.Methods. 2014 Mar 15;66(2):292-8. doi: 10.1016/j.ymeth.2013.08.026. Epub 2013 Aug 29. Methods. 2014. PMID: 23994243 Free PMC article.
-
Generating multiple-pulse bursts for enhanced fluorescence detection.Methods Appl Fluoresc. 2014 May 14;2(2):024009. doi: 10.1088/2050-6120/2/2/024009. Methods Appl Fluoresc. 2014. PMID: 29148459
-
Optically modulated fluorescence bioimaging: visualizing obscured fluorophores in high background.Acc Chem Res. 2014 May 20;47(5):1545-54. doi: 10.1021/ar400325y. Epub 2014 Apr 14. Acc Chem Res. 2014. PMID: 24725021 Free PMC article. Review.
-
Nanoparticles as Nonfluorescent Analogues of Fluorophores for Optical Nanoscopy.ACS Nano. 2015 Jun 23;9(6):6196-205. doi: 10.1021/acsnano.5b01503. Epub 2015 May 15. ACS Nano. 2015. PMID: 25950994
-
[Comparison and progress review of various super-resolution fluorescence imaging techniques].Se Pu. 2021 Oct;39(10):1055-1064. doi: 10.3724/SP.J.1123.2021.06015. Se Pu. 2021. PMID: 34505427 Free PMC article. Review. Chinese.
Cited by
-
An update on recent advances in fluorescent materials for fluorescence molecular imaging: a review.RSC Adv. 2025 Jun 30;15(28):22267-22284. doi: 10.1039/d5ra03102h. eCollection 2025 Jun 30. RSC Adv. 2025. PMID: 40599579 Free PMC article. Review.
References
-
- Jameson DM. Introduction to fluorescence. Abington: Taylor & Francis/CRC Press, 2014
-
- Lakowicz JR. Principles of fluorescence spectroscopy. 3rd ed. Berlin: Springer, 2006
-
- Gryczynski Z, Gryczynski I. Practical fluorescence spectroscopy. Abington: Taylor & Francis/CRC Press, 2020
-
- Valeur B, Berberan-Santos MN. Molecular fluorescence: principles and applications. Weiheim: Wiley-vch Verlag Gmbh & Co. Kgaa, 2012
Publication types
MeSH terms
Substances
LinkOut - more resources
Full Text Sources