. 2022 Dec 15;43(18):5389-5407.
doi: 10.1002/hbm.26018. Epub 2022 Aug 8.

Automated slice-specific z-shimming for functional magnetic resonance imaging of the human spinal cord

Affiliations

Automated slice-specific z-shimming for functional magnetic resonance imaging of the human spinal cord

Merve Kaptan et al. Hum Brain Mapp. .

Abstract

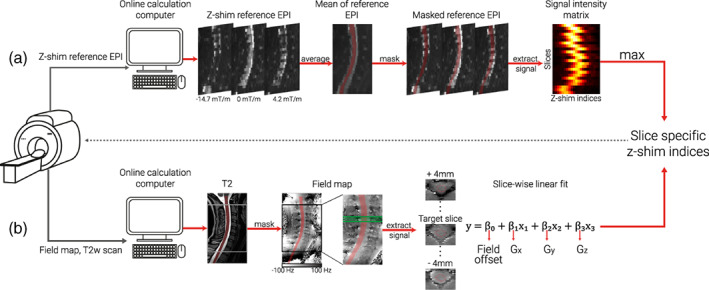
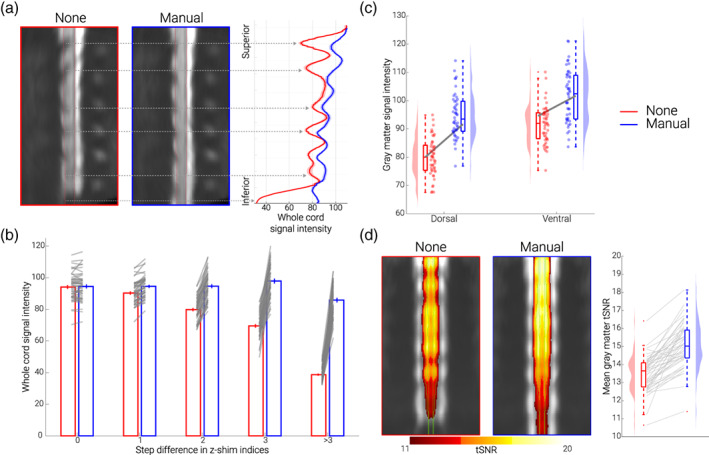
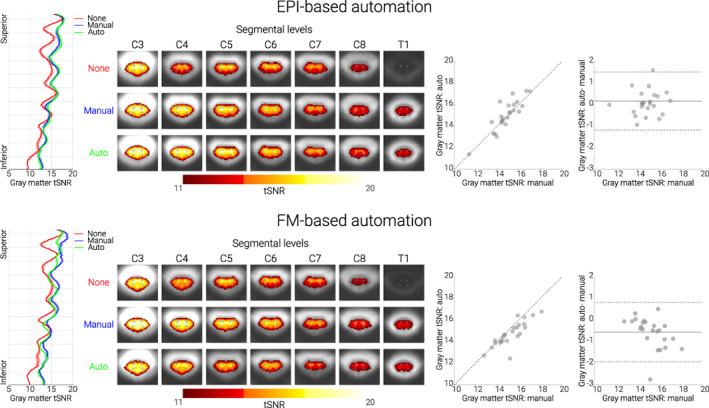
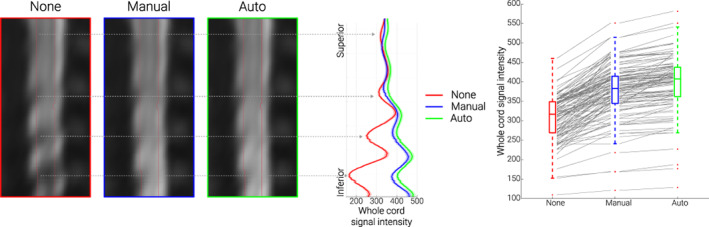
Functional magnetic resonance imaging (fMRI) of the human spinal cord faces many challenges, such as signal loss due to local magnetic field inhomogeneities. This issue can be addressed with slice-specific z-shimming, which compensates for the dephasing effect of the inhomogeneities using a slice-specific gradient pulse. Here, we aim to address outstanding issues regarding this technique by evaluating its effects on several aspects that are directly relevant for spinal fMRI and by developing two automated procedures in order to improve upon the time-consuming and subjective nature of manual selection of z-shims: one procedure finds the z-shim that maximizes signal intensity in each slice of an EPI reference-scan and the other finds the through-slice field inhomogeneity for each EPI-slice in field map data and calculates the required compensation gradient moment. We demonstrate that the beneficial effects of z-shimming are apparent across different echo times, hold true for both the dorsal and ventral horn, and are also apparent in the temporal signal-to-noise ratio (tSNR) of EPI time-series data. Both of our automated approaches were faster than the manual approach, lead to significant improvements in gray matter tSNR compared to no z-shimming and resulted in beneficial effects that were stable across time. While the field-map-based approach performed slightly worse than the manual approach, the EPI-based approach performed as well as the manual one and was furthermore validated on an external corticospinal data-set (N > 100). Together, automated z-shimming may improve the data quality of future spinal fMRI studies and lead to increased reproducibility in longitudinal studies.

Keywords: automated z-shim; functional magnetic resonance imaging; magnetic field inhomogeneities; signal loss; spinal cord; temporal signal-to-noise ratio.


Conflict of interest statement

The Max Planck Institute for Human Cognitive and Brain Sciences has an institutional research agreement with Siemens Healthcare. Nikolaus Weiskopf holds a patent on acquisition of MRI data during spoiler gradients (US 10,401,453 B2). Nikolaus Weiskopf was a speaker at an event organized by Siemens Healthcare and was reimbursed for the travel expenses.

Figures

FIGURE 1
FIGURE 1
Schematic depiction of automated z‐shim methods. After the acquisition of the necessary scans for each method (z‐shim reference EPI for EPI‐based approach, T2‐weighted image and field map for field map based approach), DICOM images were exported to an online calculation computer, and converted to NIfTI format before further processing. (a) EPI‐based selection . The z‐shim reference scan was then averaged across its 21 volumes (one volume per z‐shim moment; three volumes are depicted here as mid‐sagittal sections to illustrate the varying signal loss) and the resulting mean image was segmented (the segmentation is shown here as a transparent red overlay for display purposes). The mean signal intensities for each slice and z‐shim moment were extracted from the segmented cord, resulting in a 24 × 21 signal intensity matrix (slices×volumes). For each slice, the z‐shim value (i.e., the corresponding index in the reference scan) resulting in the maximum intensity was selected. (b) Field map based selection. A high‐resolution T2‐weighted image was segmented and used to determine the field map voxels to be included in the fitting procedure (the segmentation is shown as a transparent red overlay for display purposes). The gray and the black boxes depict the EPI coverage on the T2‐weighted image and field map, respectively. Voxels within a 9 mm thick slab (i.e., nine transversal field map slices, corresponding to a 5 mm EPI slice +2 mm on each side) were included in a slice‐wise fitting procedure. The green lines on the field map indicate the input volume for fitting an exemplary target slice (dashed green line). Exemplary transversal slices are also shown, with the red line outlining the spinal cord. Slice‐wise fitting, including three linear field coefficients (Gx, Gy, and Gz) along the main axes of the imaging volume and a spatially homogenous field term (field offset), was repeated over slices and the z‐shim (Gz) moments corresponding to the center of the EPI slices were selected
FIGURE 2
FIGURE 2
Replication and extension of previous results. (a) Direct replication of Finsterbusch et al. (2012). The mid‐sagittal EPI sections consist of the group‐average single volume EPI data in template space of 48 participants acquired under different conditions (no z‐shim and manual z‐shim); red lines indicate the spinal cord outline. On the right side, group‐averaged signal intensity in the spinal cord is shown for no (red) and manual (blue) z‐shim sequences along the rostro‐caudal axis of the cord. The solid line depicts the mean value and the shaded area depicts the standard error of the mean. (b) Slice‐by‐slice characterization of z‐shim effects. Bar graphs are grouped according to the absolute step size difference in the z‐shim indices (x‐axis) between no z‐shim (red) and manual z‐shim (blue) selections. The bars depict the mean signal intensity in the spinal cord for 48 participants for no and manual z‐shim single volume acquisitions in native space. The vertical lines depict the standard error of the mean and the gray lines indicate participant‐specific mean signal intensity changes between the no and manual z‐shim conditions. (c) Z‐shim effects in gray matter regions. Signal intensity changes in different gray matter regions (dorsal horn, ventral horn) under different conditions (no z‐shim, manual z‐shim) are depicted via box‐plots and raincloud plots. For the box plots, the median is denoted by the central mark and the bottom and top edges of the boxes represent the 25% and 75%, respectively, with the whiskers encompassing ~99% of the data and outliers being represented by red dots. The circles represent individual participants and half‐violin plots show the distribution of the gray matter intensity values across participants. The thick gray lines show the mean signal intensity across participants in the dorsal and ventral gray matter under different conditions. (d) Z‐shim effects on time‐series data. Group‐average coronal tSNR maps for the no z‐shim and manual z‐shim conditions as obtained from the motion‐corrected EPI data in template space. The maps are overlaid onto the group‐average mean image of the motion‐corrected EPI data and depict a tSNR range from 11 to 20. The green line marks the outline of the gray matter. In the right panel, the participant‐specific mean gray matter tSNR of the data acquired with and without z‐shim are shown. Box plots are identical to those in C, the gray lines indicate individual tSNR changes between both conditions and the half‐violin plots show the distribution across participants
FIGURE 3
FIGURE 3
Performance of both automated methods. Top panel. EPI‐based automation. Bottom panel. FM‐based automation. In both panels, the left‐most plots show the group‐averaged gray‐matter tSNR for no (red), manual (blue), and automated (green) z‐shim sequences along the rostro‐caudal axis of the cord. The solid line depicts the mean value and the shaded area depicts the standard error of the mean. Condition‐wise group‐average tSNR maps of the transversal slices at the middle of each segment are shown in the second graphs from the left. The maps are overlaid onto the group‐average mean image of the motion‐corrected EPI data and depict a tSNR range from 11 to 20. The outlines of the thresholded gray matter mask are marked by green lines. The scatter plots to the right show gray matter tSNR for manual (x‐axis) and automated z‐shim sequences (y‐axis) plotted against each other (N = 24 for each automation subgroup). Bland–Altman plots show the gray matter tSNR for manual z‐shim plotted as the ground truth (x‐axis) and the difference in gray matter tSNR between automated and manual sequences plotted on the y‐axis. The horizontal solid gray line represents the mean difference in the gray matter tSNR between the two (automated and manual) sequences, and the dotted lines show the 95% limits of agreement (1.96 × standard deviation of the differences)
FIGURE 4
FIGURE 4
Validation of EPI‐based automation on an independent data‐set. The mid‐sagittal EPI sections on the left consist of the group‐average reconstructed z‐shim reference scan EPI data in template space for the three different conditions (note that “EPI reconstruction” was carried out via creating a single volume for each participant from the corresponding 15‐volume z‐shim reference scan by selecting for each slice the volume in which the z‐shim moment maximized the signal intensity; for no z‐shim reconstruction, the 8th volume of the z‐shim reference scan was selected, which corresponds to the central/neutral z‐shim moment, as this acquisition had a range of 15 moments). The line plots in the middle depict the group‐averaged spinal cord signal intensity (obtained from the reconstructed z‐shim reference‐scan EPIs) along the rostro‐caudal axis of the cord for the different conditions. The solid lines depict the group‐mean values and the shaded areas depict the standard error of the mean. The box plots on the right show the group‐mean spinal cord signal intensity averaged over the entire slice‐stack. The median values are denoted by the central marks and the bottom and top edges of the boxes represent the 25% and 75%, respectively. The whiskers encompass approximately 99% of the data and outliers are represented by red dots. The gray lines indicate the participant‐specific data (N = 113) upon which the box‐plots are based

Similar articles

Cited by

References

    1. Balteau, E. , Hutton, C. , & Weiskopf, N. (2010). Improved shimming for fMRI specifically optimizing the local BOLD sensitivity. NeuroImage, 49(1), 327–336. 10.1016/j.neuroimage.2009.08.010 - DOI - PMC - PubMed
    1. Barry, R. L. , Conrad, B. N. , Maki, S. , Watchmaker, J. M. , McKeithan, L. J. , Box, B. A. , Weinberg, Q. R. , Smith, S. A. , & Gore, J. C. (2021). Multi‐shot acquisitions for stimulus‐evoked spinal cord BOLD fMRI. Magnetic Resonance in Medicine, 85(4), 2016–2026. 10.1002/mrm.28570 - DOI - PMC - PubMed
    1. Barry, R. L. , & Smith, S. A. (2019). Measurement of T2* in the human spinal cord at 3T. Magnetic Resonance in Medicine, 82(2), 743–748. 10.1002/mrm.27755 - DOI - PMC - PubMed
    1. Barry, R. L. , Smith, S. A. , Dula, A. N. , & Gore, J. C. (2014). Resting state functional connectivity in the human spinal cord. eLife, 3, e02812. 10.7554/eLife.02812 - DOI - PMC - PubMed
    1. Brooks, J. C. W. , Beckmann, C. F. , Miller, K. L. , Wise, R. G. , Porro, C. A. , Tracey, I. , & Jenkinson, M. (2008). Physiological noise modelling for spinal functional magnetic resonance imaging studies. NeuroImage, 39(2), 680–692. 10.1016/j.neuroimage.2007.09.018 - DOI - PubMed

Publication types

MeSH terms