. 2022 Aug 8;7(15):e160247.
doi: 10.1172/jci.insight.160247.

Pharmacological induction of AMFR increases functional EAAT2 oligomer levels and reduces epileptic seizures in mice

Affiliations

Pharmacological induction of AMFR increases functional EAAT2 oligomer levels and reduces epileptic seizures in mice

Longze Sha et al. JCI Insight. .

Abstract

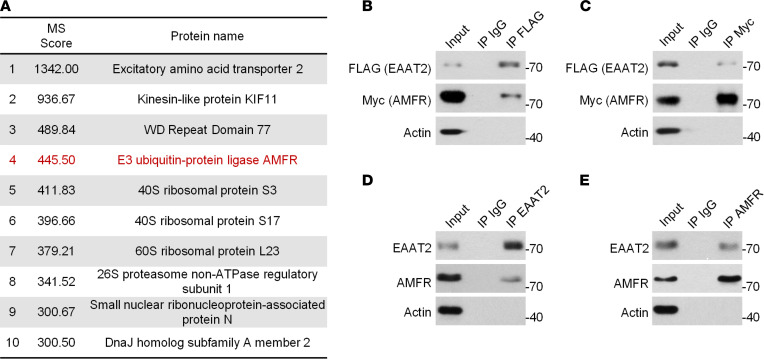
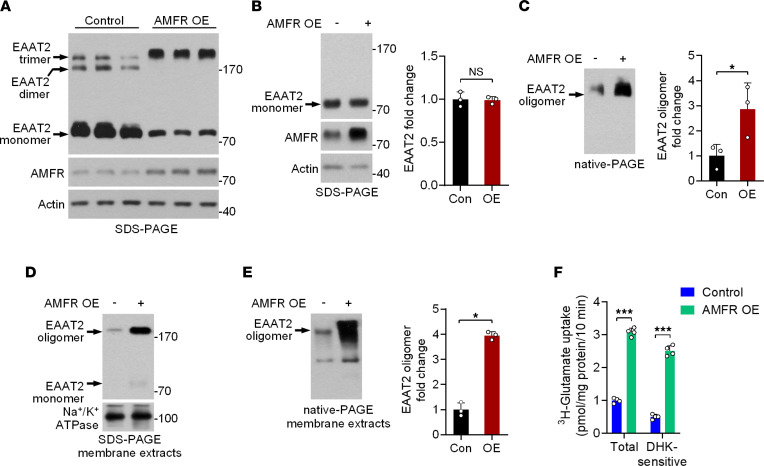
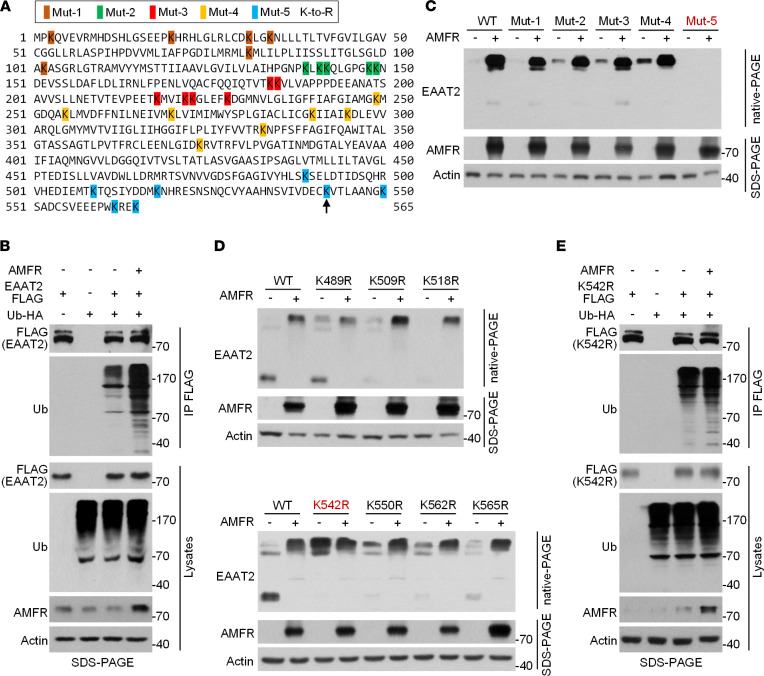
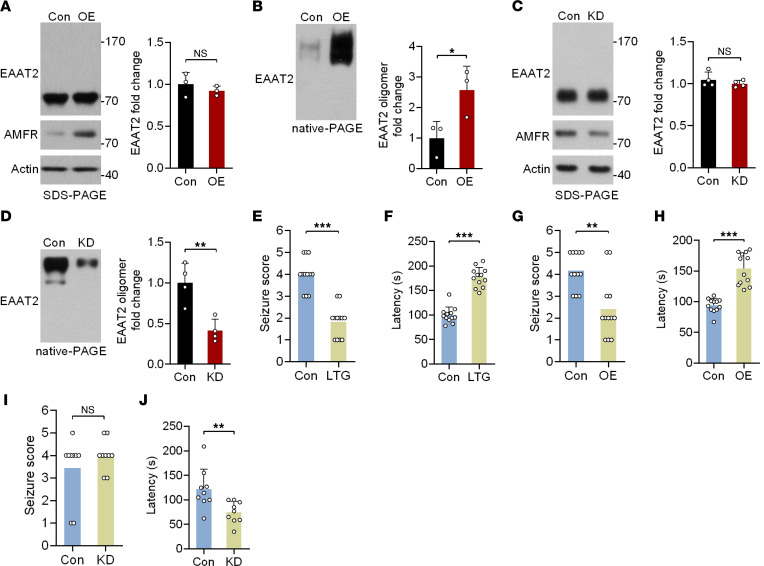
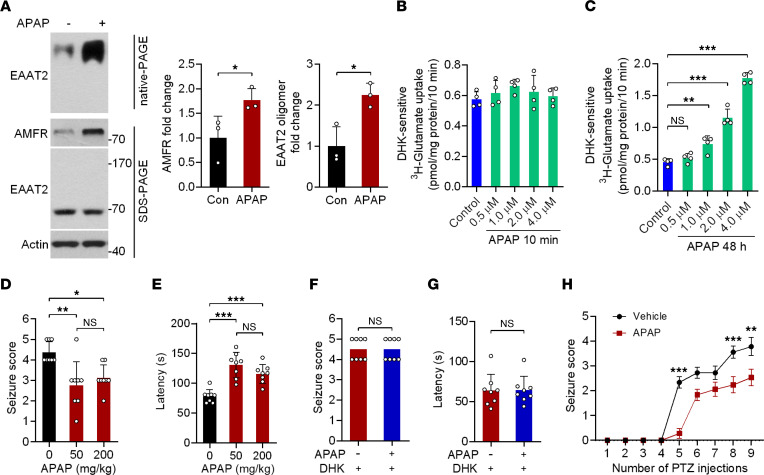
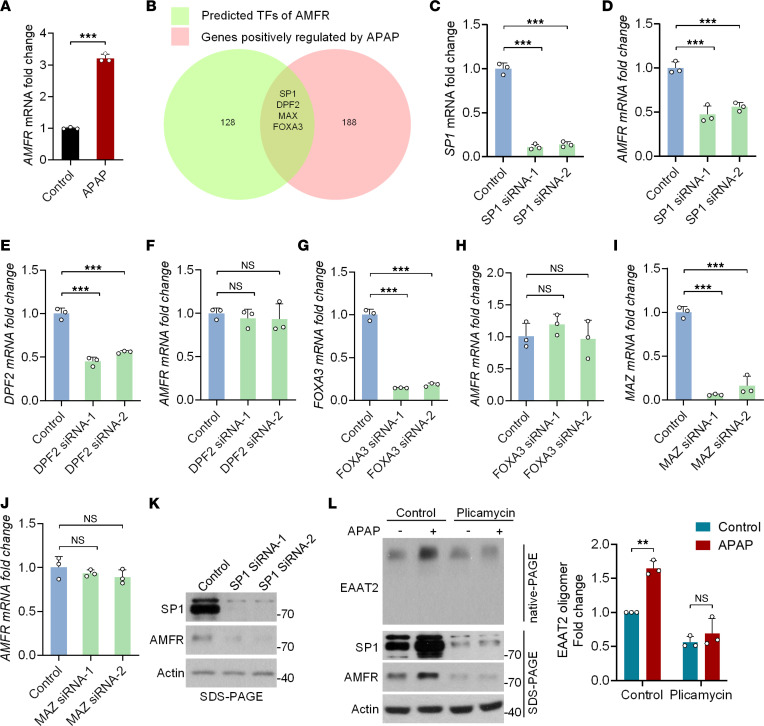
Dysregulation of excitatory amino acid transporter 2 (EAAT2) contributes to the development of temporal lobe epilepsy (TLE). Several strategies for increasing total EAAT2 levels have been proposed. However, the mechanism underlying the oligomeric assembly of EAAT2, impairment of which inhibits the formation of functional oligomers by EAAT2 monomers, is still poorly understood. In the present study, we identified E3 ubiquitin ligase AMFR as an EAAT2-interacting protein. AMFR specifically increased the level of EAAT2 oligomers rather than inducing protein degradation through K542-specific ubiquitination. By using tissues from humans with TLE and epilepsy model mice, we observed that AMFR and EAAT2 oligomer levels were simultaneously decreased in the hippocampus. Screening of 2386 FDA-approved drugs revealed that the most common analgesic/antipyretic medicine, acetaminophen (APAP), can induce AMFR transcriptional activation via transcription factor SP1. Administration of APAP protected against pentylenetetrazol-induced epileptogenesis. In mice with chronic epilepsy, APAP treatment partially reduced the occurrence of spontaneous seizures and greatly enhanced the antiepileptic effects of 17AAG, an Hsp90 inhibitor that upregulates total EAAT2 levels, when the 2 compounds were administered together. In summary, our studies reveal an essential role for AMFR in regulating the oligomeric state of EAAT2 and suggest that APAP can improve the efficacy of EAAT2-targeted antiepileptic treatments.

Keywords: Epilepsy; Neuroscience.


Figures

Figure 1
Figure 1. Identification of the interaction between EAAT2 and AMFR.
(A) List of EAAT2-interacting proteins with a score value greater than 300 identified by MS. (B) Western blot analysis of EAAT2-FLAG after immunoprecipitation of AMFR-Myc. (C) Western blot analysis of AMFR-Myc after immunoprecipitation of EAAT2-FLAG. In B and C, HEK293 cells were cotransfected with EAAT2-FLAG and AMFR-Myc for 48 hours and lysed for immunoprecipitation. (D) Western blot analysis of immunoprecipitation of hippocampal lysates with an EAAT2-specific antibody followed by EAAT2 and AMFR immunoblotting. (E) Western blot analysis of immunoprecipitation of hippocampal lysates with an AMFR-specific antibody followed by AMFR and EAAT2 immunoblotting. In BE, nonspecific rabbit IgG was used as a negative control. The blots are representative of 2 or 3 independent experiments. Numbers on the right of blots indicate kilodaltons.
Figure 2
Figure 2. The effects of AMFR expression on EAAT2 oligomer levels.
(A) SDS-PAGE followed by immunoblotting analysis of lysates of cultured astrocytes 48 hours posttransduction with AAV5-AMFR (OE) or control virus. (B and C) SDS-PAGE and native-PAGE followed by immunoblot analysis of lysates of cultured astrocytes 48 hours posttransduction of AAV5-AMFR or control virus. BME and DTT were used to promote the dissociation of EAAT2 oligomers in SDS-PAGE, except in A. The intensity of the EAAT2 bands was normalized to that of the Actin bands (n = 3). (D and E) SDS-PAGE and native-PAGE followed by immunoblot analysis of membrane extracts of cultured astrocytes 48 hours posttransduction of AAV5-AMFR or control virus. In E, the intensity of the EAAT2 oligomer bands was normalized to that of the Na+/K+ ATPase bands (n = 3). Numbers on the right of blots indicate kilodaltons. (F) Statistical analysis of 3H-glutamate uptake (n = 4). Cultured astrocytes were transduced with AAV5-AMFR or control virus for 72 hours, and DHK (100 μM), an EAAT2 inhibitor, was added 1 hour before the assay to distinguish DHK-sensitive glutamate uptake. OE, overexpression. Con, control. Student’s t test. *P < 0.05, ***P < 0.001.
Figure 3
Figure 3. AMFR regulates the oligomeric state of EAAT2 through ubiquitination at K542.
(A) Illustration of the EAAT2 K-to-R mutant constructs. The 31 lysine residues were divided into 5 groups, which are marked with different background colors. The arrow indicates the K542 site. (B) SDS-PAGE followed by immunoblot analysis of anti-FLAG–immunoprecipitated proteins from HEK293 cells transfected with AMFR, EAAT2-FLAG, Ub-HA, or the indicated combinations. (C) SDS-PAGE and native-PAGE followed by immunoblotting of HEK293 cells 48 hours posttransfection of expression vectors encoding WT/mutant EAAT2 and AMFR. Empty vector was used as a control for the AMFR vector. (D) SDS-PAGE and native-PAGE followed by immunoblot analysis of HEK293 cells 48 hours posttransfection of expression vectors encoding AMFR and WT or EAAT2 mutants, each of which harbored 1 of the 7 mutations in Mut-5. (E) Immunoblotting analysis of lysates of anti-FLAG-immunoprecipitated proteins from HEK293 cells transfected with AMFR, EAAT2 (K542R)-FLAG, Ub-HA, or the indicated combinations. Mut, mutant. The blots are representative of 2 or 3 independent experiments. Numbers on the right of blots indicate kilodaltons.
Figure 4
Figure 4. The expression of AMFR in the hippocampi of patients with TLE and KA-induced TLE model mice.
(A) SDS-PAGE and native-PAGE followed by immunoblot of lysates of non-HS and HS samples. (B) Statistical analysis of EAAT2, AMFR (SDS-PAGE), and EAAT2 oligomer (native-PAGE) levels in the sclerotic hippocampi of mice 0–8 weeks after KA-induced SE. Western blots are shown in Supplemental Figure 2. Numbers on the right of blots indicate kilodaltons. (C) IF staining of AMFR (red) and GFAP (green) and DAPI staining (blue) in the sclerotic hippocampi of mice 4 weeks after KA-induced SE and in the hippocampi of saline-injected control mice (left). Quantification of the AMFR IF intensity in GFAP-labeled astrocytes (right; n = 9 slices from 3 mice). Scale bar: 20 μm. Student’s t test (B and C). **P < 0.01, ***P < 0.001.
Figure 5
Figure 5. The antiepileptic effects of AMFR expression in the pentylenetetrazol-induced acute seizure mouse model.
(A and B) SDS-PAGE and native-PAGE followed by immunoblotting of lysates from the hippocampi of mice at 4 weeks after hippocampal injection of AAV5-AMFR OE or control virus (n = 3). (C and D) SDS-PAGE and native-PAGE followed by immunoblotting analysis of lysates from the hippocampi of mice at 4 weeks after hippocampal injection of AAV-AMFR KD or control virus (n = 4). Numbers on the right of blots indicate kilodaltons. (EJ) Statistical analyses of the seizure score and latency of the acute response to PTZ. (E and F) Mice were administered LTG (20 mg/kg) or vehicle 1 hour before PTZ injections. (n = 12). (G and H) Mice were studied 4 weeks after bilateral injection of AAV5-AMFR OE or control virus (n = 12). (I and J) Mice were studied 4 weeks after bilateral injection of AAV5-AMFR KD or control virus. (n = 9.) Student’s t test (AJ). *P < 0.05, **P < 0.01, ***P < 0.001.
Figure 6
Figure 6. APAP upregulates AMFR protein expression and exhibits antiepileptic effects.
(A) SDS-PAGE and native-PAGE followed by immunoblotting analysis of lysates from the hippocampus ipsilateral to KA injection (left). Five weeks after hippocampal injection of KA, mice were given 50 mg/kg APAP or vehicle for 5 days. Statistical analyses of AMFR levels in samples subjected to SDS-PAGE and EAAT2 oligomer levels in samples subjected to native-PAGE (right). Numbers on the right of blots indicate kilodaltons. (B and C) Statistical analyses of DHK-sensitive 3H-glutamate uptake (n = 4). Cultured astrocytes were treated with 0.5 to 4 μM APAP or vehicle for 10 minutes or 48 hours, and DHK (100 μM) was added 1 hour before the assays to distinguish DHK-sensitive glutamate uptake. (D and E) Acute model of epilepsy. Statistical analyses of the difference in seizure scores and latency of the acute response to PTZ in vehicle control– and APAP-pretreated mice at 50 or 200 mg/kg (n = 8). (F and G) PTZ-induced model of acute seizure. Statistical analyses of the difference in seizure scores and latency of the acute response to PTZ in APAP-pretreated (50 mg/kg) and APAP/DHK-pretreated mice (n = 8). DHK (10 mg/kg) was i.p. injected 30 minutes before PTZ. (H) Statistical analyses of the difference in seizure scores in the PTZ kindling model of epileptogenesis (n = 18). Student’s t test (A, F, G). One-way ANOVA followed by Dunnett’s post hoc test (BE). Two-way ANOVA followed by post hoc multiple comparisons test (H). *P < 0.05, **P < 0.01, ***P < 0.001.
Figure 7
Figure 7. APAP upregulates AMFR protein expression through the transcription factor SP1.
(A) Quantitative PCR and statistical analysis of the mRNA level of AMFR in primary cultured astrocytes 24 hours after APAP treatment (2 μM). (B) The transcription factors (TFs) predicted to upregulate AMFR expression (green, 128 genes) and APAP-regulated TFs (red, 188 genes). The shared TFs were DPF2, FOXA3, MAZ, and SP1. (C and D) Quantitative PCR and statistical analysis of SP1 and AMFR mRNA levels in primary cultured astrocytes 48 hours after transfection with 2 independent siRNAs targeting SP1 (n = 3). (E and F) Quantitative PCR and statistical analysis of DPF2 and AMFR mRNA levels in primary cultured astrocytes 48 hours after transfection with 2 independent siRNAs targeting DPF2 (n = 3). (G and H) Quantitative PCR and statistical analysis of FOXA3 and AMFR mRNA levels in primary cultured astrocytes 48 hours after transfection with 2 independent siRNAs targeting FOXA3 (n = 3). (I and J) Quantitative PCR and statistical analysis of MAZ and AMFR mRNA levels in primary cultured astrocytes 48 hours after transfection with 2 independent siRNAs targeting MAZ (n = 3). (K) Immunoblot analysis of primary cultured astrocytes 48 hours after transfection with 2 independent siRNAs targeting SP1. (L) Western blot analysis of primary cultured astrocytes 48 hours after treatment with the SP1 inhibitor plicamycin (1 μM), APAP (2 μM), or their combination as indicated. Numbers on the right of blots indicate kilodaltons. Student’s t test (A and L). One-way ANOVA followed by Dunnett’s post hoc test (CJ). **P < 0.01, ***P < 0.001.
Figure 8
Figure 8. The antiepileptic effects of APAP in a mouse model of chronic TLE.
(A) Experimental design. (B) Examples of daily recordings of spontaneous recurrent seizures in the vehicle, LTG, APAP, and APAP/17AAG treatment groups. LTG was administered i.p. at a dose of 20 mg/kg daily (n = 6). APAP was administered i.p. at a dose of 50 mg/kg daily (n = 8). 17AAG was administered i.p. at a dose of 25 mg/kg once every other day (n = 6). DMSO was used as a vehicle control (n = 6). (CF) Statistical analyses of the difference in seizure frequency (average number of seizures per day) between baseline and after treatment. (G) Statistical analysis of the difference in the fold change in seizure frequency before and after treatment with vehicle, LTG, 17AAG, or APAP/17AAG. (H) Native-PAGE and SDS-PAGE followed by immunoblotting analysis of lysates from the hippocampus ipsilateral to KA injection (left; n = 5). Five weeks after hippocampal injection of KA, mice were given APAP, 17AAG, or their combination for 2 weeks. Statistical analysis of the level of total EAAT2 in samples subjected to SDS-PAGE and EAAT2 oligomer levels in samples subjected to native-PAGE (right). Numbers on the right of blots indicate kilodaltons. Paired t test (CF). Student’s t test (G). Two-way ANOVA followed by post hoc multiple comparisons test (H). **P < 0.01, ***P < 0.001.

Similar articles

Cited by

References

    1. Fattorusso A, et al. The pharmacoresistant epilepsy: an overview on existant and new emerging therapies. Front Neurol. 2021;12:674483. doi: 10.3389/fneur.2021.674483. - DOI - PMC - PubMed
    1. Patel DC, et al. Neuron-glia interactions in the pathophysiology of epilepsy. Nat Rev Neurosci. 2019;20(5):282–297. doi: 10.1038/s41583-019-0126-4. - DOI - PMC - PubMed
    1. Takahashi K, et al. Glutamate transporter EAAT2: regulation, function, and potential as a therapeutic target for neurological and psychiatric disease. Cell Mol Life Sci. 2015;72(18):3489–3506. doi: 10.1007/s00018-015-1937-8. - DOI - PMC - PubMed
    1. Kim K, et al. Role of excitatory amino acid transporter-2 (EAAT2) and glutamate in neurodegeneration: opportunities for developing novel therapeutics. J Cell Physiol. 2011;226(10):2484–2493. doi: 10.1002/jcp.22609. - DOI - PMC - PubMed
    1. Malik AR, Willnow TE. Excitatory amino acid transporters in physiology and disorders of the central nervous system. Int J Mol Sci. 2019;20(22):5671. doi: 10.3390/ijms20225671. - DOI - PMC - PubMed

Publication types

MeSH terms