. 2022 Aug 30;13(4):e0189722.
doi: 10.1128/mbio.01897-22. Epub 2022 Aug 8.

The Plasmodium falciparum Nuclear Protein Phosphatase NIF4 Is Required for Efficient Merozoite Invasion and Regulates Artemisinin Sensitivity

Affiliations

The Plasmodium falciparum Nuclear Protein Phosphatase NIF4 Is Required for Efficient Merozoite Invasion and Regulates Artemisinin Sensitivity

Xiaotong Zhu et al. mBio. .

Abstract

Artemisinin resistance in Plasmodium falciparum has been associated with a mutation in the NLI-interacting factor-like phosphatase PfNIF4, in addition to the mutations in the Kelch13 protein as the major determinant. We found that PfNIF4 was predominantly expressed at the schizont stage and localized in the nuclei of the parasite. To elucidate the functions of PfNIF4 in P. falciparum, we performed PfNIF4 knockdown (KD) using the inducible ribozyme system. PfNIF4 KD attenuated merozoite invasion and affected gametocytogenesis. PfNIF4 KD parasites also showed significantly increased in vitro susceptibility to artemisinins. Transcriptomic and proteomic analysis revealed that PfNIF4 KD led to the downregulation of gene categories involved in invasion and artemisinin resistance (e.g., mitochondrial function, membrane, and Kelch13 interactome) at the trophozoite and/or schizont stage. Consistent with PfNIF4 being a protein phosphatase, PfNIF4 KD resulted in an overall upregulation of the phosphoproteome of infected erythrocytes. Quantitative phosphoproteomic profiling identified a set of PfNIF4-regulated phosphoproteins with functional similarity to FCP1 substrates, particularly proteins involved in chromatin organization and transcriptional regulation. Specifically, we observed increased phosphorylation of Ser2/5 of the tandem repeats in the C-terminal domain (CTD) of RNA polymerase II (RNAPII) upon PfNIF4 KD. Furthermore, using the TurboID-based proteomic approach, we identified that PfNIF4 interacted with the RNAPII components, AP2-domain transcription factors, and chromatin-modifiers and binders. These findings suggest that PfNIF4 may act as the RNAPII CTD phosphatase, regulating the expression of general and parasite-specific cellular pathways during the blood-stage development. IMPORTANCE Protein phosphorylation regulates a multitude of cellular processes. The eukaryotic FCP1 phosphatase acts as a CTD-phosphatase to critically balance the phosphorylation status of the CTD of the RNAPII, controlling the accurate execution of the transcription process. Here, we identified PfNIF4 as the FCP1-like phosphatase in P. falciparum. PfNIF4 KD specifically downregulated genes involved in merozoite invasion, resulting in the attenuation of this process. Consistent with the earlier finding of the association of PfNIF4 mutations with artemisinin resistance in Southeast Asian parasite populations, PfNIF4 KD significantly increased in vitro susceptibility to artemisinins. The regulation of these cellular processes in P. falciparum by PfNIF4 is likely realized through RNAPII-mediated transcription, because PfNIF4 was found to interact with RNAPII subunits and KD of PfNIF4 caused CTD hyperphosphorylation. Our results reveal the functions of the PfNIF4 phosphatase in controlling the transcription of invasion- and resistance-related genes in the malaria parasite.

Keywords: RNA polymerase II; asexual development; invasion; malaria; protein phosphatase.


Conflict of interest statement

The authors declare no conflict of interest.

Figures

FIG 1
FIG 1
Expression of PfNIF4-Ty protein during asexual and gametocyte development. (A) Diagram showing the integration of the Ty-ribozyme sequence at the pfnif4 locus using the CRISPR/cas9 method. The positions of primers (genoF1, genoR1, and genoR2) are indicated. (B) Confirmation of Ty-glmS integration at the pfnif4 locus by integration-specific PCR using genomic DNA from NIF4iKD clones C3 and C6 (iKD) and the parental 3D7 strain (WT). Lane 1, primers genoF1+genoR1 (WT, 1,243 bp; iKD,1,628 bp); Lane 2, primers genoF1+genoR2 (iKD, 982 bp). (C) Western blot analysis of WT and NIF4iKD parasite lysates of asynchronous cultures with (right panel) or without (left panel) alkaline phosphatase treatment using the anti-Ty antibody. Arrows indicate the position of the NIF4-Ty protein. Protein loading per lane was verified using the anti-Hsp70 MAb. (D) Western blot of PfNIF4-Ty protein expression at the ring (R), trophozoite (T), schizont (S), and gametocyte (G) stages of NIF4iKD parasites with the anti-Ty antibody. GAPDH was used as the protein loading control. The relative NIF4-Ty/GAPDH signal intensity ratios calculated with the Image J software are shown below the gel image.
FIG 2
FIG 2
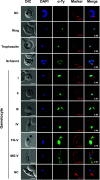
Subcellular localization of PfNIF4-Ty protein during asexual and gametocyte stages by IFA. Representative images of the ring, trophozoite, schizont, and stage I to V gametocytes showing localization of the PfNIF4-Ty protein. Parasites were probed with the anti-Ty MAb (mouse, 1:500) together with anti-EXP2 sera (rabbit, 1:500, for asexual stage parasites) or anti-Pfs16 (rabbit, 1:500, for gametocytes). Secondary antibodies were anti-mouse Alexa Fluor 488 (green) and anti-rabbit Alexa Fluor 594 (red). The IFA analysis of schizonts and gametocytes of the parental 3D7 strain (WT) stained with anti-EXP2 sera and anti-Pfs16 antibody were used as negative control (NC). The nuclei were visualized with DAPI (blue). Numbers in the merged images show the Pearson’s correlation coefficients for DAPI/Ty in the NIF4iKD strain. Scale bar: 5 μm. DIC, differential interference contrast image; FG, female gametocyte; MG, male gametocyte.
FIG 3
FIG 3
Phenotypic characterization of PfNIF4 KD across the asexual life cycle. (A) Western blot analysis of NIF4-Ty protein expression in the presence of 0, 0.3, 0.6, 1.3, 2.5, 5, and 10 mM GlcN. Protein loading per lane was monitored by the anti-Hsp70 MAb. (B) Analysis of relative NIF4-Ty protein KD in panel A by using the Image J software. ** (P < 0.01) and *** (P < 0.001) indicate statistical comparisons of PfNID4 band intensity between the control and GlcN-treated parasites. (C) Asexual growth of the 3D7 and NIF4iKD (clone C3) parasites cultured in the presence or absence of 2.5 mM GlcN. All parasites were seeded at 0.1% parasitemia and 2% hematocrit and parasitemia was monitored daily using Giemsa-stained smears. ** indicates a significant difference in parasitemia between the GlcN-treated NIF4iKD parasites and untreated parasites. (D) Multiplication rates of the parasites. The multiplication rate was determined for each clone as the fold increase in parasitemia per 48 h measured over three cycles. (E) Comparison of the progression of the ring, trophozoite and schizont stage across the IDC using the synchronized NIF4iKD C3 clone in the presence or absence of 2.5 mM GlcN. At each time point, the percentages of the ring (green), trophozoite (red) and schizont (blue) stages are shown. The cultures were monitored every 2 h through a 56-h period. (F) Merozoites number/schizont. The number of merozoites in each mature schizont was counted under a light microscope. (G) The percentages of ruptured schizonts in the 3D7 and NIF4iKD parasites cultured in the presence or absence of 2.5 mM GlcN. (H) Comparison of the merozoite invasion efficiency. The number of rings per ruptured schizont was determined for each parasite line under the specified GlcN treatment conditions.
FIG 4
FIG 4
Ring-stage survival assays of the 3D7 and NIF4iKD parasites. Tightly synchronized 3D7 (A) and NIF4iKD (B) parasites at the early ring (0 to 3 hpi) stage were exposed to a 3-h pulse of DHA at the indicated concentrations. Parasite viability was determined by Giemsa-stained smear at 72 hpi. Bar graphs correspond to the percent survival (mean + SD), equivalent to the parasitemia of DHA-treated parasites divided by the parasitemia of the DMSO-treated parasites. Data are from three or four independent experiments, each conducted in duplicate. Statistical significance between GlcN-treated and -untreated parasites was determined by two-tailed Student’s t tests. *, P < 0.05; **, P < 0.01; ***, P < 0.001.
FIG 5
FIG 5
Global transcriptional analysis of GlcN-treated and -untreated NIF4iKD parasites by RNA-seq. (A) Induced knockdown of PfNIF4-Ty protein in the NIF4iKD parasites. Proteins were extracted from tightly synchronized NIF4iKD parasites collected at 12, 24, and 36 hpi, respectively. Cultures were maintained with (+) or without (–) 2.5 mM GlcN supplement beginning at 3 hpi. Arrow indicates the recombinant NIF4-Ty protein band detected with the anti-Ty MAb. GAPDH was used as the control for equal protein loading. Representative images of three independent experiments are shown. (B) Pearson correlation coefficient of the transcriptomes for the ring (R), trophozoite (T), and schizont stages (S) of the NIF4iKD parasite treated with (+) or without (–) 2.5 mM GlcN. (C) Volcano plots displaying the log2 (fold change) for GlcN+/GlcN– versus the –log10 P values at the ring, trophozoite, and schizont stages of the NIF4iKD parasites. Each point represents a P. falciparum gene. The significantly differentially expressed genes (p-adj < 0.05 and >2-fold difference) are highlighted in red (upregulated genes) and blue (downregulated). The numbers of the differentially expressed genes are shown above the plots. (D) Gene ontology (GO) enrichment analysis of upregulated (left panel) and downregulated (right panel) genes in the NIF4iKD parasites upon GlcN treatment at the ring (R), trophozoite (T), and schizont (S) stages, respectively. The color density indicates the level of significance (p-adj value) of the enriched GO term. (E) qRT-PCR validation of the expression of invasion-related genes in GlcN-treated parasites compared with untreated parasites. Tightly synchronized parasites were collected at the schizont stage (36 hpi). Error bars indicate SD from three biological replicates.
FIG 6
FIG 6
Global proteome analysis of GlcN-treated and -untreated NIF4iKD parasites. (A) Heatmap displaying pairwise Pearson correlations of quantified proteomes of biological triplicates. (B) Volcano plot depicting the log2 (fold change) of PfNIF4iKD parasites grown + or – GlcN at trophozoite and schizont stages in the second IDC cycle. Significantly up- and downregulated proteins are highlighted in orange and dark green, respectively. The numbers of the differentially expressed proteins are shown above the plots. (C) Heatmap displaying global changes in protein expression caused by PfNIF4 KD at the trophozoite and schizont stages. The proteins are organized according to the similarity in expression by K-means and combined into three classes. (D) Gene ontology (GO) enrichment analysis of dysregulated proteins in the NIF4iKD parasites upon GlcN treatment. The three classes by K-means are indicated by different colors. The gray color indicates the expected number of proteins as the fraction of proteins in the whole genome.
FIG 7
FIG 7
Phosphoproteome analysis of GlcN+ and GlcN– PfNIF4iKD parasites. (A) Volcano plots showing proteins with differential phosphorylation levels in PfNIF4iKD parasites (+) GlcN relative to (–) GlcN at trophozoite and schizont stages. Proteins with log2 (fold change) in phosphorylation levels higher or lower than 0 and adjusted P values of <0.1 are shown in orange (upregulated) and dark green (downregulated) dots, respectively. The numbers of respective proteins are indicated above the plots. (B) Heatmap displaying global changes of the protein phosphorylation levels caused by PfNIF4 KD at the trophozoite and schizont stages. The differentially regulated phosphoproteins are classified into three classes by K-means clustering. (C) Sequence logo showing consensus sequence surrounding phosphosites (position 0) significantly increased in the PfNIF4 KD parasites. (D) Immunoblots confirming the increased phosphorylation of Rpb1 CTD (pSer2/5) following PfNIF4 KD in parasites at 24 hpi in the first and second cycles. The band intensity was evaluated by Image J software. The fold increase (2.3× and 5.0×) indicates band intensity detected by the anti-Phospho-PfRpb1 CTD (Ser-2/5) antibody normalized to total Rpb1 detected with the anti-Rpb1 CTD (4H8) mouse MAb. The full Western blots are shown in Fig. S5. (E) GO enrichment analysis based on the three classes in (B). (F) Protein domain enrichment analysis of proteins classified into three classes. The gray bars in (E0 and (F) indicate the expected number of proteins as the fraction of proteins in the whole genome.

Similar articles

Cited by

References

    1. WHO Organization. 2020. World malaria report 2020. Global Malaria Programme, World Health Organization.
    1. Miller LH, Baruch DI, Marsh K, Doumbo OK. 2002. The pathogenic basis of malaria. Nature 415:673–679. doi:10.1038/415673a. - DOI - PubMed
    1. Alam MM, Solyakov L, Bottrill AR, Flueck C, Siddiqui FA, Singh S, Mistry S, Viskaduraki M, Lee K, Hopp CS, Chitnis CE, Doerig C, Moon RW, Green JL, Holder AA, Baker DA, Tobin AB. 2015. Phosphoproteomics reveals malaria parasite Protein Kinase G as a signalling hub regulating egress and invasion. Nat Commun 6:7285. doi:10.1038/ncomms8285. - DOI - PMC - PubMed
    1. Lasonder E, Green JL, Grainger M, Langsley G, Holder AA. 2015. Extensive differential protein phosphorylation as intraerythrocytic Plasmodium falciparum schizonts develop into extracellular invasive merozoites. Proteomics 15:2716–2729. doi:10.1002/pmic.201400508. - DOI - PubMed
    1. Pease BN, Huttlin EL, Jedrychowski MP, Talevich E, Harmon J, Dillman T, Kannan N, Doerig C, Chakrabarti R, Gygi SP, Chakrabarti D. 2013. Global analysis of protein expression and phosphorylation of three stages of Plasmodium falciparum intraerythrocytic development. J Proteome Res 12:4028–4045. doi:10.1021/pr400394g. - DOI - PMC - PubMed

Publication types

MeSH terms