. 2022 Aug 30;13(4):e0194422.
doi: 10.1128/mbio.01944-22. Epub 2022 Aug 8.

Human Nasal Organoids Model SARS-CoV-2 Upper Respiratory Infection and Recapitulate the Differential Infectivity of Emerging Variants

Affiliations

Human Nasal Organoids Model SARS-CoV-2 Upper Respiratory Infection and Recapitulate the Differential Infectivity of Emerging Variants

Man Chun Chiu et al. mBio. .

Abstract

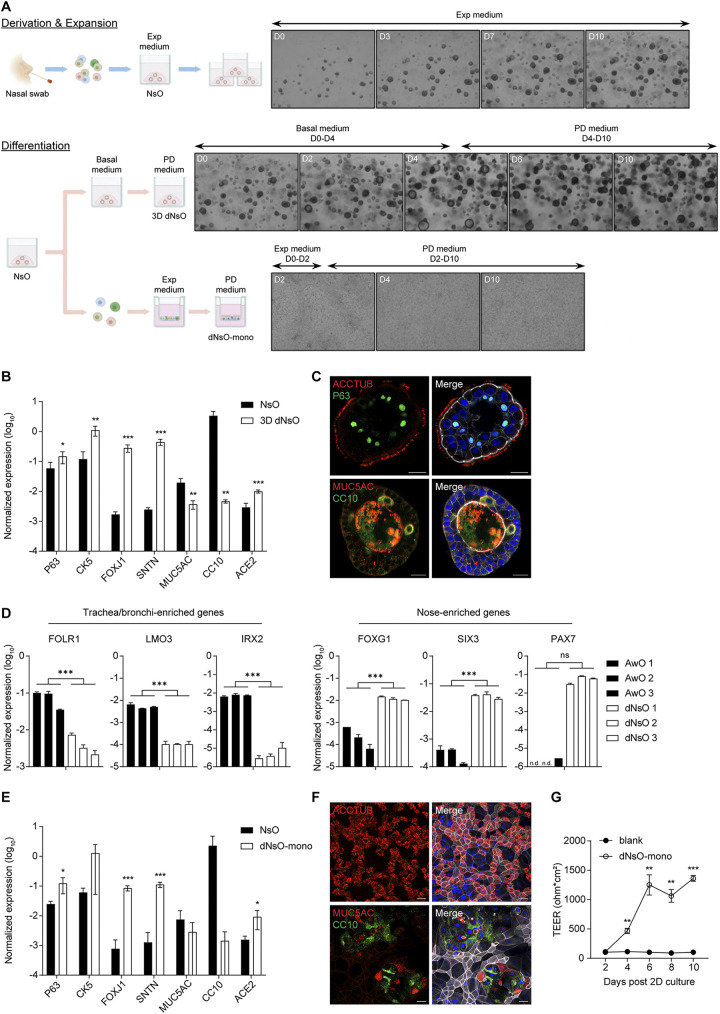
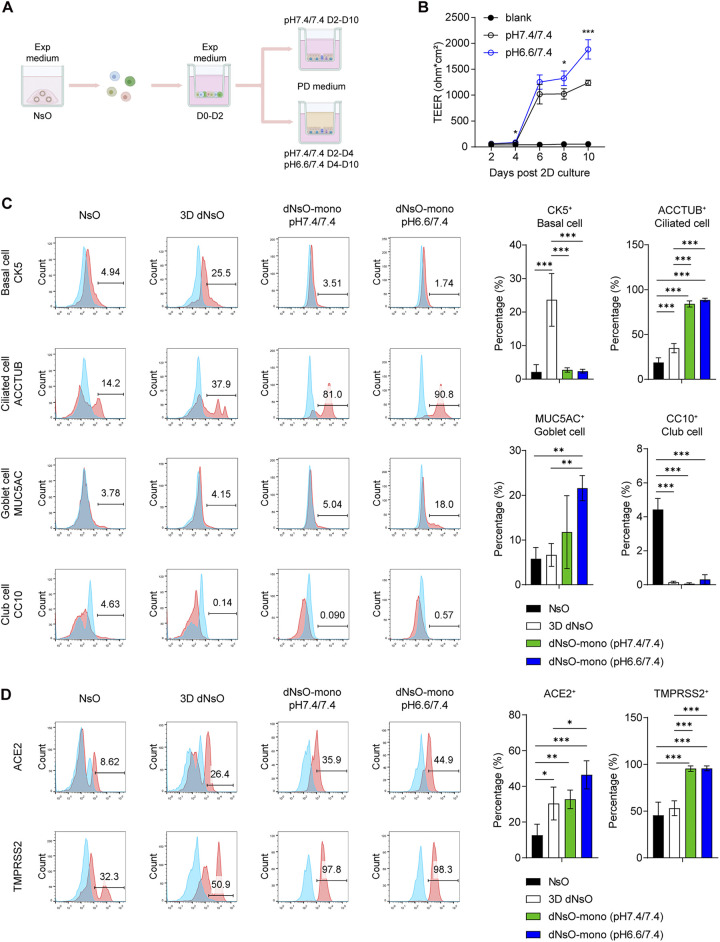
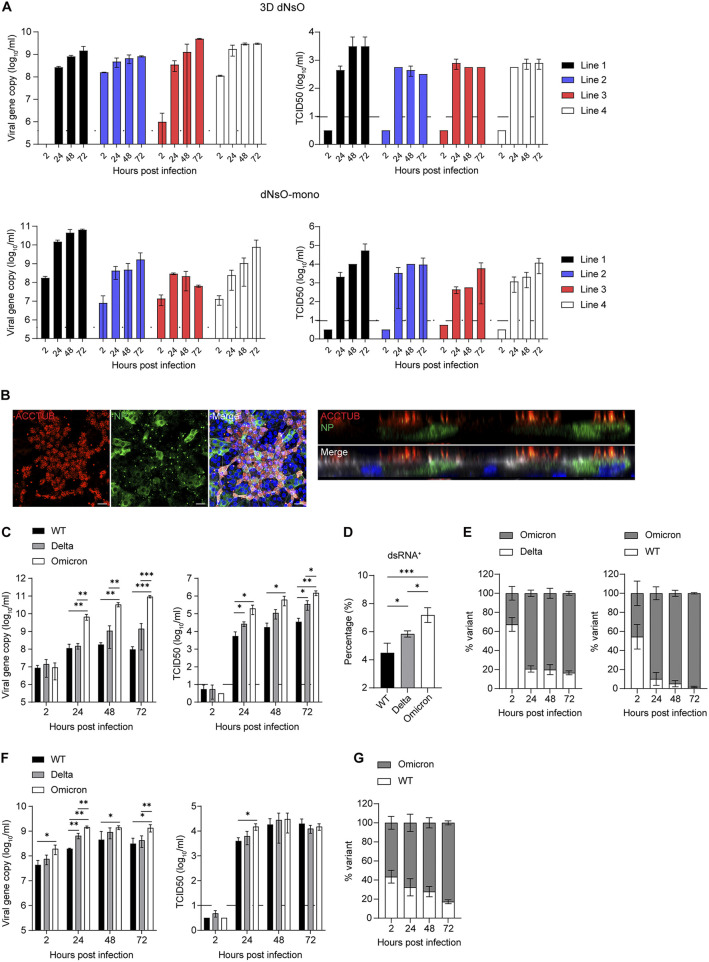
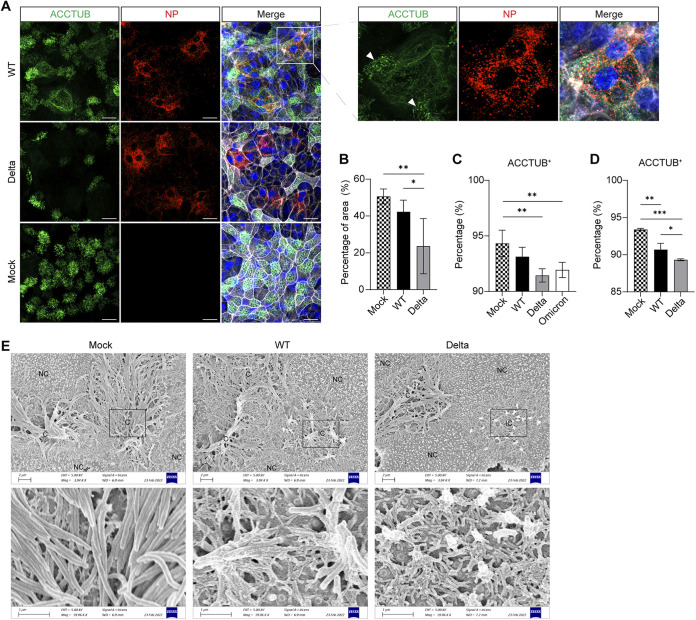
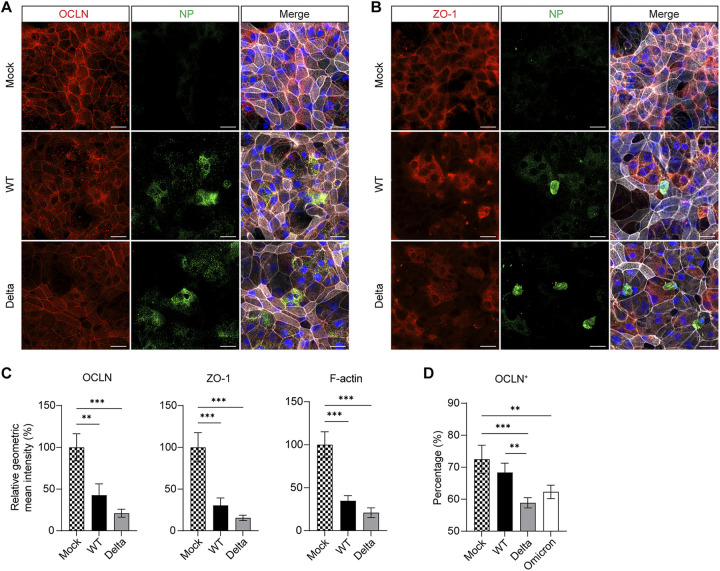
The human upper respiratory tract, specifically the nasopharyngeal epithelium, is the entry portal and primary infection site of respiratory viruses. Productive infection of SARS-CoV-2 in the nasal epithelium constitutes the cellular basis of viral pathogenesis and transmissibility. Yet a robust and well-characterized in vitro model of the nasal epithelium remained elusive. Here we report an organoid culture system of the nasal epithelium. We derived nasal organoids from easily accessible nasal epithelial cells with a perfect establishment rate. The derived nasal organoids were consecutively passaged for over 6 months. We then established differentiation protocols to generate 3-dimensional differentiated nasal organoids and organoid monolayers of 2-dimensional format that faithfully simulate the nasal epithelium. Moreover, when differentiated under a slightly acidic pH, the nasal organoid monolayers represented the optimal correlate of the native nasal epithelium for modeling the high infectivity of SARS-CoV-2, superior to all existing organoid models. Notably, the differentiated nasal organoid monolayers accurately recapitulated higher infectivity and replicative fitness of the Omicron variant than the prior variants. SARS-CoV-2, especially the more transmissible Delta and Omicron variants, destroyed ciliated cells and disassembled tight junctions, thereby facilitating virus spread and transmission. In conclusion, we establish a robust organoid culture system of the human nasal epithelium for modeling upper respiratory infections and provide a physiologically-relevant model for assessing the infectivity of SARS-CoV-2 emerging variants. IMPORTANCE An in vitro model of the nasal epithelium is imperative for understanding cell biology and virus-host interaction in the human upper respiratory tract. Here we report an organoid culture system of the nasal epithelium. Nasal organoids were derived from readily accessible nasal epithelial cells with perfect efficiency and stably expanded for more than 6 months. The long-term expandable nasal organoids were induced maturation into differentiated nasal organoids that morphologically and functionally simulate the nasal epithelium. The differentiated nasal organoids adequately recapitulated the higher infectivity and replicative fitness of SARS-CoV-2 emerging variants than the ancestral strain and revealed viral pathogenesis such as ciliary damage and tight junction disruption. Overall, we established a human nasal organoid culture system that enables a highly efficient reconstruction and stable expansion of the human nasal epithelium in culture plates, thus providing a facile and robust tool in the toolbox of microbiologists.

Keywords: SARS-CoV-2; airway organoids; ciliary damage; nasal organoids; tight junction.


Conflict of interest statement

The authors declare a conflict of interest. J.Z., K.Y.Y., M.C.C., and C.L. are listed as inventors on the patent of airway organoids (publication No: US-2021-0207081-A1). J.Z., M.C.C., C.L., and K.Y.Y. are listed as inventors on the provisional patent of nasal organoids (US application No: 63/358,795) describing the methods in this paper. All other authors declare no competing interests.

Figures

FIG 1
FIG 1
Establishment and characterization of human nasal organoids. (A) A schematic graph outlines the derivation, expansion, and differentiation of human nasal organoids. The upper panel shows the derivation of nasal organoids (NsO) from nasal cells. 3D undifferentiated nasal organoids undergo expansion in the expansion (Exp) medium. Photomicrographs show growing organoids on day 0 (D0), 3, 7, and 10 (magnification ×40). The bottom panel shows nasal organoids undergoing differentiation protocols to generate 3D differentiated nasal organoids (3D dNsO) or differentiated nasal organoid monolayer (dNsO-mono). Photomicrographs present differentiating 3D organoids on day 0, 2, 4, 6, and 10 in basal medium and PD medium sequentially (magnification ×40). Photomicrographs show differentiating organoid monolayers on day 2, 4, and 10 in expansion medium and PD medium sequentially (magnification ×100). (B) Parental 3D nasal organoids (NsO) and 3D differentiated nasal organoids (3D dNsO) were assessed for the expression level of cell-specific marker genes and SARS-CoV-2 receptor ACE2. Data represent the mean and s.d. of a representative experiment, n = 4. Two-tailed unpaired Student's t test. The experiment was independently performed in four organoid lines. (C) 3D dNsOs were subjected to immunofluorescence staining to label ACCTUB+ ciliated cells (top, red) and P63+ (top, green) basal cells, or MUC5AC+ goblet cells (bottom, red) and CC10+ (bottom, green) club cells. Nuclei and actin filaments were counterstained with DAPI (blue) and Phalloidin-647 (white), respectively. Scale bar, 20 μm. (D) Three lines of 3D differentiated human airway organoids (AwO) and other three lines of 3D differentiated nasal organoids (dNsO) were assessed for the expression levels of trachea/bronchi-enriched genes and nose-enriched genes. Data represent the mean and s.d., n = 2 in each of the organoid lines. Two-tailed unpaired Student's t test. (E) Parental 3D nasal organoids (NsO) and the differentiated nasal organoid monolayers (dNsO-mono) were assessed for the expression level of cell-specific marker genes and SARS-CoV-2 receptor ACE2. Data represent the mean and s.d. of a representative experiment, n = 4. Two-tailed unpaired Student's t test. The experiment was independently performed in two organoid lines. (F) Differentiated nasal organoid monolayers were subjected to immunofluorescence staining to label ACCTUB+ ciliated cells (top, red), or MUC5AC+ goblet cells (bottom, red) and CC10+ (bottom, green) club cells. Nuclei and actin filaments were counterstained with DAPI (blue) and Phalloidin-647 (white), respectively. Scale bar, 20 μm. (G) Trans-epithelial electrical resistance (TEER) of the dNsO-mono on the Transwell insert was measured every other day over 10 days. Blank insert without cell was measured as the baseline reading. Data represent the mean and s.d. of a representative experiment, n = 4. Two-tailed unpaired Student's t test. The experiment was independently performed in two organoid lines.
FIG 2
FIG 2
Optimization and characterization of differentiated nasal organoid monolayers. (A) A schematic graph outlines the generation of optimized differentiated nasal organoid monolayers (dNsO-mono). (B) Trans-epithelial electrical resistance (TEER) of the dNsO-mono differentiated at pH 7.4/7.4 or pH 6.6/7.4 PD medium were measured every other day over 10 days. A blank insert without any cell was measured as the baseline. Data represent the mean and s.d. of a representative experiment, n = 4. Two-tailed unpaired Student's t test. The experiment was independently performed in two organoid lines. (C) Parental 3D NsO, 3D dNsO, and dNsO-mono differentiated at pH 7.4/7.4 or pH 6.6/7.4 were applied to flow cytometry to examine the abundance of CK5+ basal cells, ACCTUB+ ciliated cells, MUC5AC+ goblet cells, and CC10+ club cells. Representative histograms are shown on the left. Red, cells stained with specific antibodies; blue, cells stained with isotype controls. Data on the right represent the mean and s.d. of a representative experiment, n = 4. Ordinary one-way ANOVA with Tukey's multiple comparison test. The experiment was independently performed in two organoid lines. (D) The organoids were applied to flow cytometry to examine the expression of ACE2 and TMPRSS2. Representative histograms are shown on the left. Red, cells stained with specific antibodies; blue, cells stained with isotype controls. Data on the right represent the mean and s.d. of a representative experiment, n = 4. Ordinary one-way ANOVA with Tukey's multiple comparison test. The experiment was independently performed in two organoid lines.
FIG 3
FIG 3
SARS-CoV-2 infection and replicative fitness in differentiated nasal organoids. (A) At the indicated hours postinoculation, culture media were harvested from four lines of 3D dNsO (top, 1 MOI) or dNsO-mono (bottom, 0.1 MOI) infected with SARS-CoV-2 and applied to viral load detection of RdRp gene by RT-qPCR and viral titration by TCID50 assay. Data represent mean and s.d., n = 2 in each of the organoid lines. The dashed line indicates the detection limit. (B) At 24 h postinoculation (5 MOI), SARS-CoV-2 infected dNsO-mono were co-stained with α-NP (green) and α-ACCTUB (red). Confocal images of en face (top) and cross-section (bottom) are shown. Nuclei and actin filaments were counterstained with DAPI (blue) and Phalloidin-647 (white). Scale bar, 20 μm. (C) At the indicated hours postinoculation with wildtype (WT), Delta, or Omicron variant (0.1 MOI), culture media were harvested from the top chambers of the dNsO-mono and applied to viral load detection and viral titration. Data show mean and s.d. of a representative experiment, n = 3. Multiple unpaired t test with multiple comparisons using Holm-Sidak method. The experiment was independently performed in two organoid lines. (D) At 24 h postinoculation (1 MOI), SARS-CoV-2 WT, Delta, or Omicron infected dNsO-mono were dissociated and applied to flow cytometry to detect dsRNA+ cells. Data represent the mean and s.d. of a representative experiment, n = 4. Ordinary one-way ANOVA with Tukey's multiple comparison test. The experiment was independently performed in two organoid lines. (E) At the indicated hours postinoculation with 1:1 mixture of Omicron and Delta (left), or mixture of Omicron and WT viruses (right) (total 0.1 MOI), culture media were harvested from the top chambers of the dNsO-mono and applied to viral load detection using variant specific primers and probes. Data represent the mean and s.d. of a representative experiment, n = 3. (F) At the indicated hours postinoculation with wildtype (WT), Delta, or Omicron variant (0.1 MOI), culture media were harvested from the apical chambers of the airway organoid monolayer (AwO-mono) and applied to viral load detection and viral titration. Data show the mean and s.d. of a representative experiment, n = 3. Multiple unpaired t test with multiple comparisons using Holm-Sidak method. (G) At the indicated hours postinoculation with 1:1 mixture of Omicron and WT (total 0.1 MOI), culture media were harvested from the apical chambers of the AwO-mono and applied to viral load detection using variant-specific primers and probes. Data represent the mean and s.d. of a representative experiment, n = 3.
FIG 4
FIG 4
SARS-CoV-2 targets ciliated cells. (A) At 24 h postinoculation (1 MOI), WT-, or Delta-infected or mock-infected dNsO-mono were co-stained with α-NP (red) and α-ACCTUB (green). Nuclei and actin filaments were counterstained with DAPI (blue) and Phalloidin-647 (white). Scale bar, 20 μm. An enlarged image of the boxed area is shown on the right. Arrows indicate the remaining cilia on an infected ciliated cell. (B) Image quantification of the immunofluorescence staining of mock-, WT-, or Delta-infected dNsO-mono. The percentage of area covered by ACCTUB labeled cilia was shown. Data represent the mean and s.d. of a representative experiment, n = 5. Ordinary one-way ANOVA with Tukey's multiple comparison test. (C) At 24 h postinoculation (1 MOI), mock-, WT-, Delta-, or Omicron-infected dNsO-mono were dissociated and applied to flow cytometry to detect ACCTUB+ ciliated cells. Data represent the mean and s.d. of a representative experiment, n = 4. Ordinary one-way ANOVA with Tukey's multiple comparison test. The experiment was independently performed in two organoid lines. (D) At 24 h postinoculation (1 MOI), mock-, WT-, or Delta -infected airway organoid monolayer (AwO-mono) were dissociated and applied to flow cytometry to detect ACCTUB+ ciliated cells. Data represent the mean and s.d. of a representative experiment, n = 3. Ordinary one-way ANOVA with Tukey's multiple comparison test. The experiment was independently performed in two organoid lines. (E) At 24 h postinoculation (1 MOI), mock-, WT-, or Delta-infected dNsO-mono were applied to scanning electron microscopy. NC, non-ciliated cell; C, ciliated cell; IC, infected ciliated cell. The enlarged images of the box areas are shown at the bottom.
FIG 5
FIG 5
SARS-CoV-2 damages cellular junction. At 24 h postinoculation (1 MOI), mock-, WT-, or Delta-infected dNsO-mono were co-stained with (A) α-NP (green) and α-OCLN (red), or (B) α-NP (green) and α-ZO-1 (red). Nuclei and actin filaments were counterstained with DAPI (blue) and Phalloidin-647 (white). Scale bar, 20 μm. (C) Image quantification of the immunofluorescence labeled mock-, WT-, or Delta-infected dNsO-mono. Geometric mean intensity relative to OCLN (left), ZO-1 (middle), and F-actin (right) in mock-infected organoids is shown. Data represent the mean and s.d. of a representative experiment, n = 3. Ordinary one-way ANOVA with Tukey's multiple comparison test. (D) At 24 h postinoculation (1 MOI), mock-, WT-, Delta-, or Omicron-infected dNsO-mono were dissociated and applied to flow cytometry to detect OCLN+ cells. Data represent the mean and s.d. of a representative experiment, n = 4. Ordinary one-way ANOVA with Tukey's multiple comparison test. The experiment was independently performed in two organoid lines.

Similar articles

Cited by

References

    1. Chan JF, Yuan S, Kok KH, To KK, Chu H, Yang J, Xing F, Liu J, Yip CC, Poon RW, Tsoi HW, Lo SK, Chan KH, Poon VK, Chan WM, Ip JD, Cai JP, Cheng VC, Chen H, Hui CK, Yuen KY. 2020. A familial cluster of pneumonia associated with the 2019 novel coronavirus indicating person-to-person transmission: a study of a family cluster. Lancet 395:514–523. doi:10.1016/S0140-6736(20)30154-9. - DOI - PMC - PubMed
    1. Zhu N, Zhang D, Wang W, Li X, Yang B, Song J, Zhao X, Huang B, Shi W, Lu R, Niu P, Zhan F, Ma X, Wang D, Xu W, Wu G, Gao GF, Tan W, China Novel Coronavirus I, Research T. 2020. A novel coronavirus from patients with pneumonia in China, 2019. N Engl J Med 382:727–733. doi:10.1056/NEJMoa2001017. - DOI - PMC - PubMed
    1. Gandhi RT, Lynch JB, Del Rio C. 2020. Mild or moderate Covid-19. N Engl J Med 383:1757–1766. doi:10.1056/NEJMcp2009249. - DOI - PubMed
    1. Ziegler CGK, Miao VN, Owings AH, Navia AW, Tang Y, Bromley JD, Lotfy P, Sloan M, Laird H, Williams HB, George M, Drake RS, Christian T, Parker A, Sindel CB, Burger MW, Pride Y, Hasan M, Abraham GE, 3rd, Senitko M, Robinson TO, Shalek AK, Glover SC, Horwitz BH, Ordovas-Montanes J. 2021. Impaired local intrinsic immunity to SARS-CoV-2 infection in severe COVID-19. Cell 184:4713–4733.e22. doi:10.1016/j.cell.2021.07.023. - DOI - PMC - PubMed
    1. Ahn JH, Kim J, Hong SP, Choi SY, Yang MJ, Ju YS, Kim YT, Kim HM, Rahman MDT, Chung MK, Hong SD, Bae H, Lee CS, Koh GY. 2021. Nasal ciliated cells are primary targets for SARS-CoV-2 replication in the early stage of COVID-19. J Clin Invest 131. doi:10.1172/JCI148517. - DOI - PMC - PubMed

Publication types

Supplementary concepts