. 2022 Oct 3;219(10):e20210663.
doi: 10.1084/jem.20210663. Epub 2022 Aug 8.

Profiling of epigenetic marker regions in murine ILCs under homeostatic and inflammatory conditions

Affiliations

Profiling of epigenetic marker regions in murine ILCs under homeostatic and inflammatory conditions

Michael Beckstette et al. J Exp Med. .

Abstract

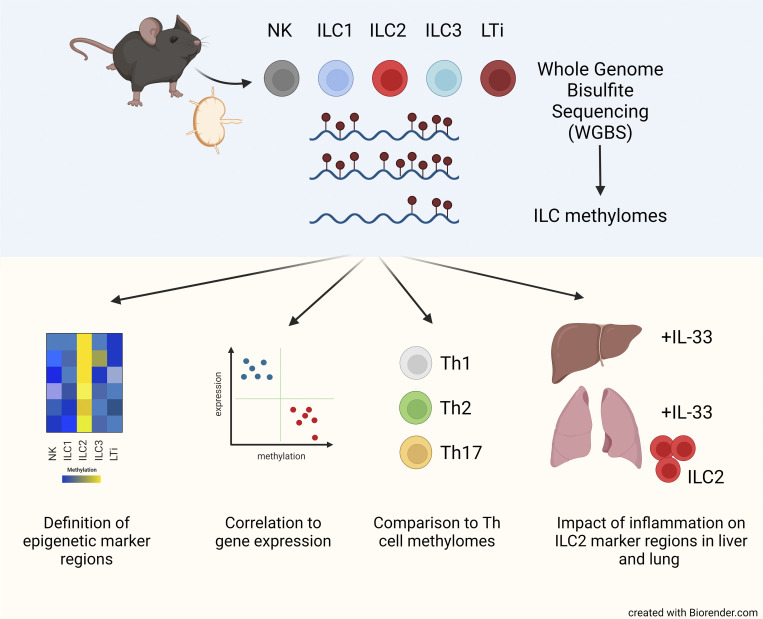
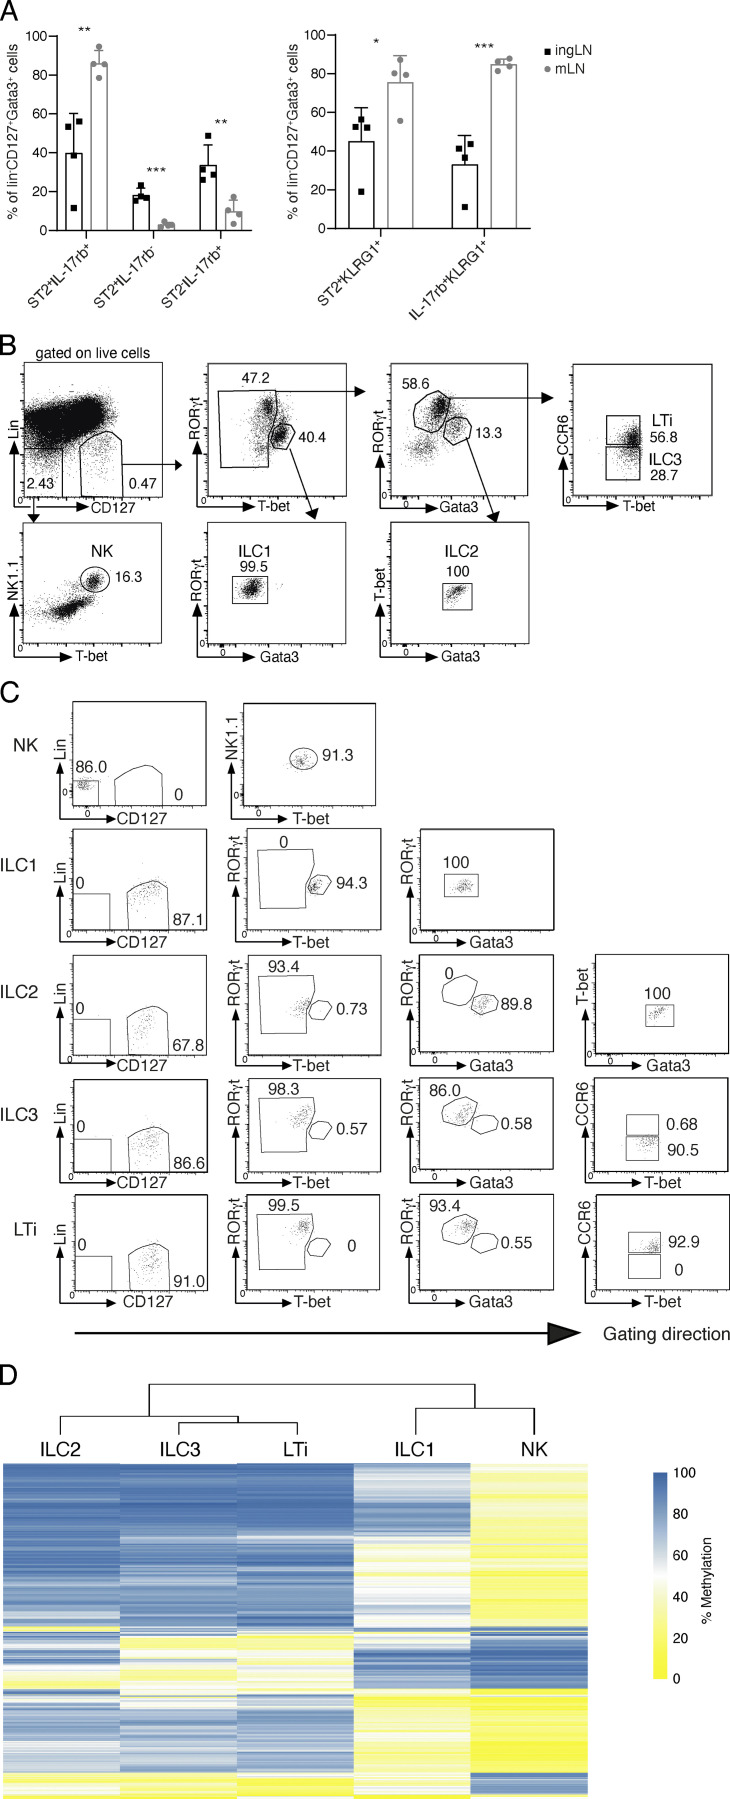
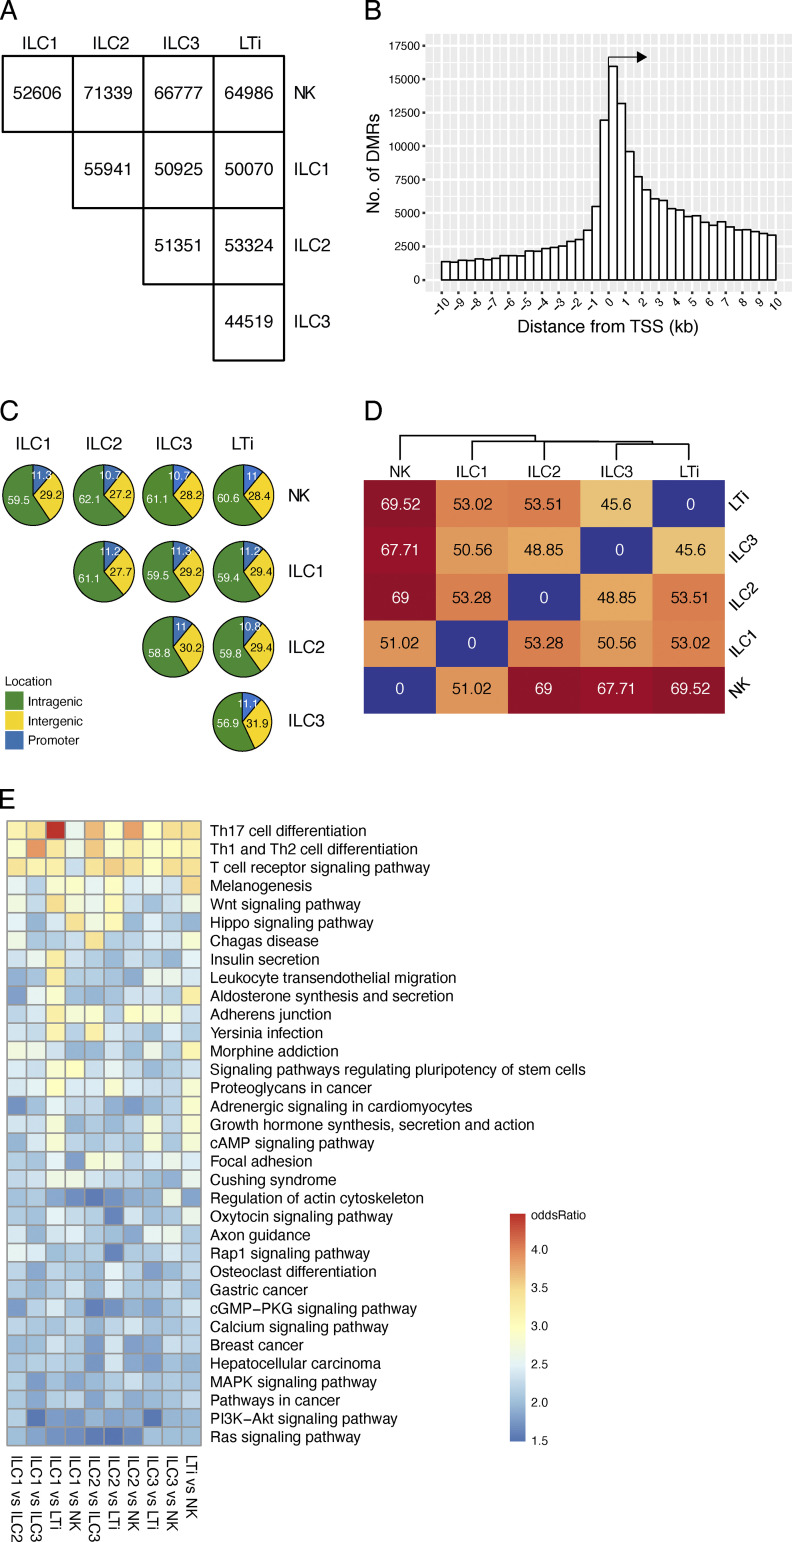
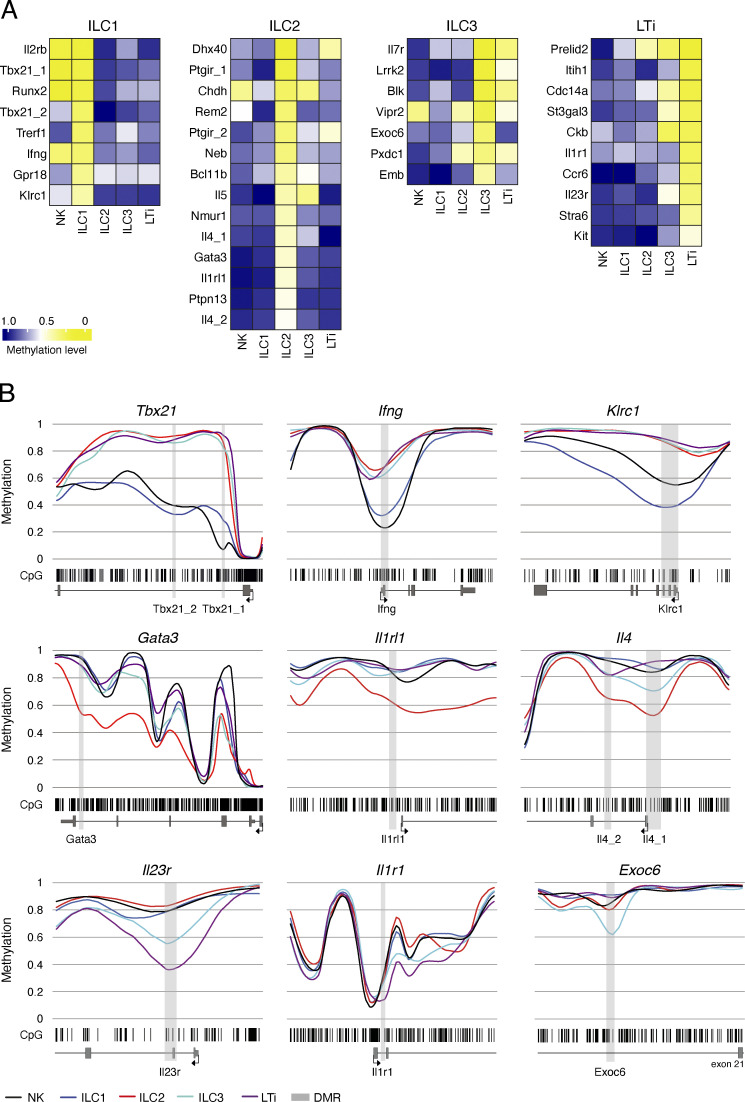
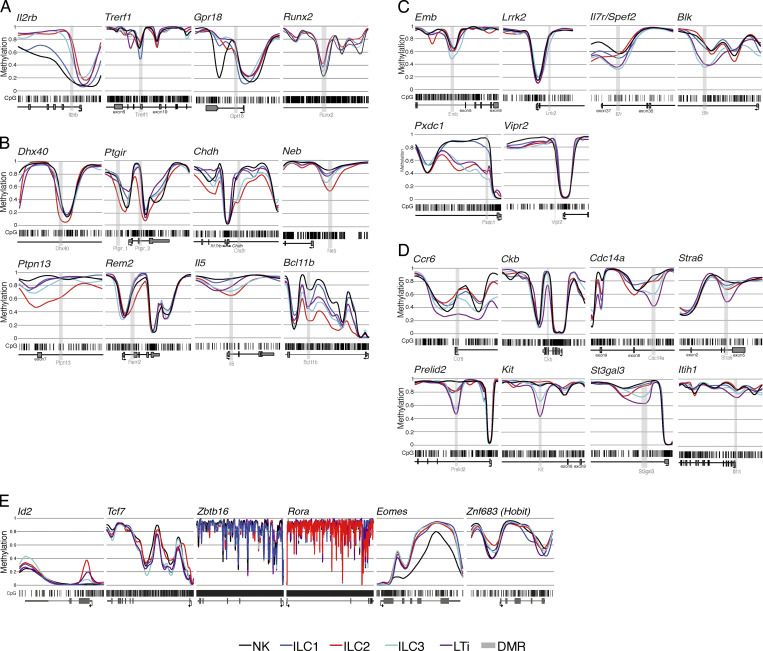
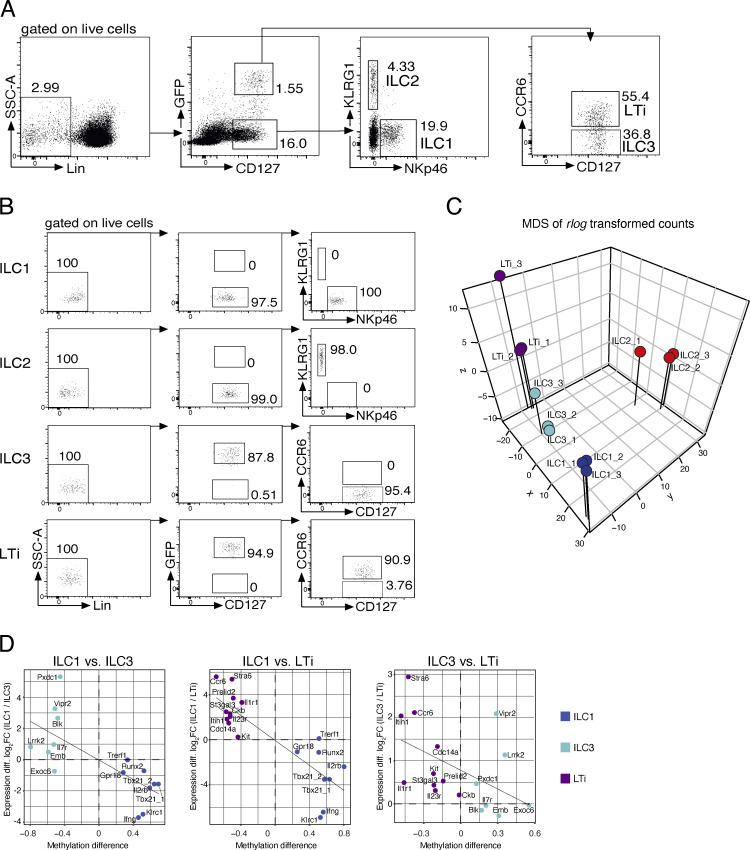
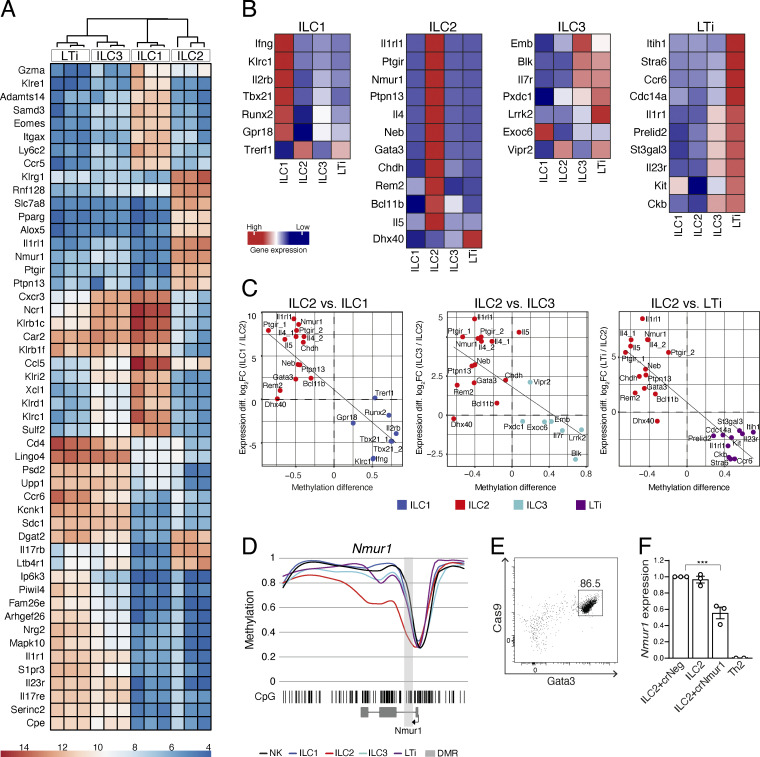
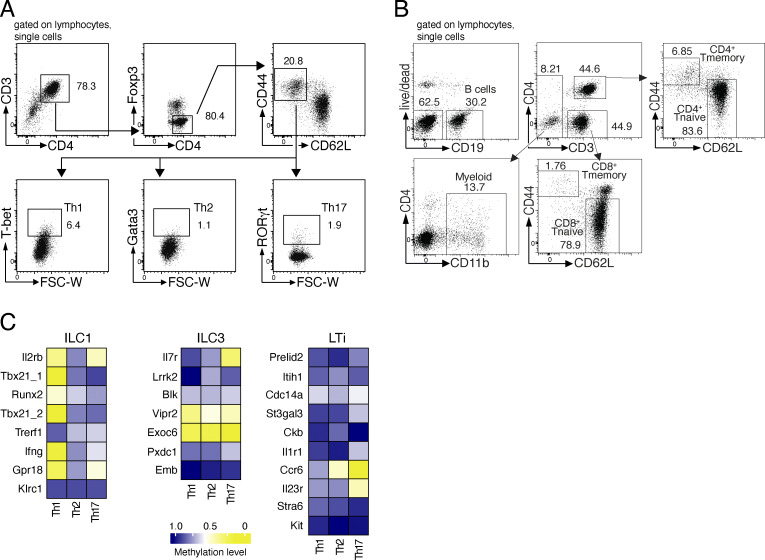
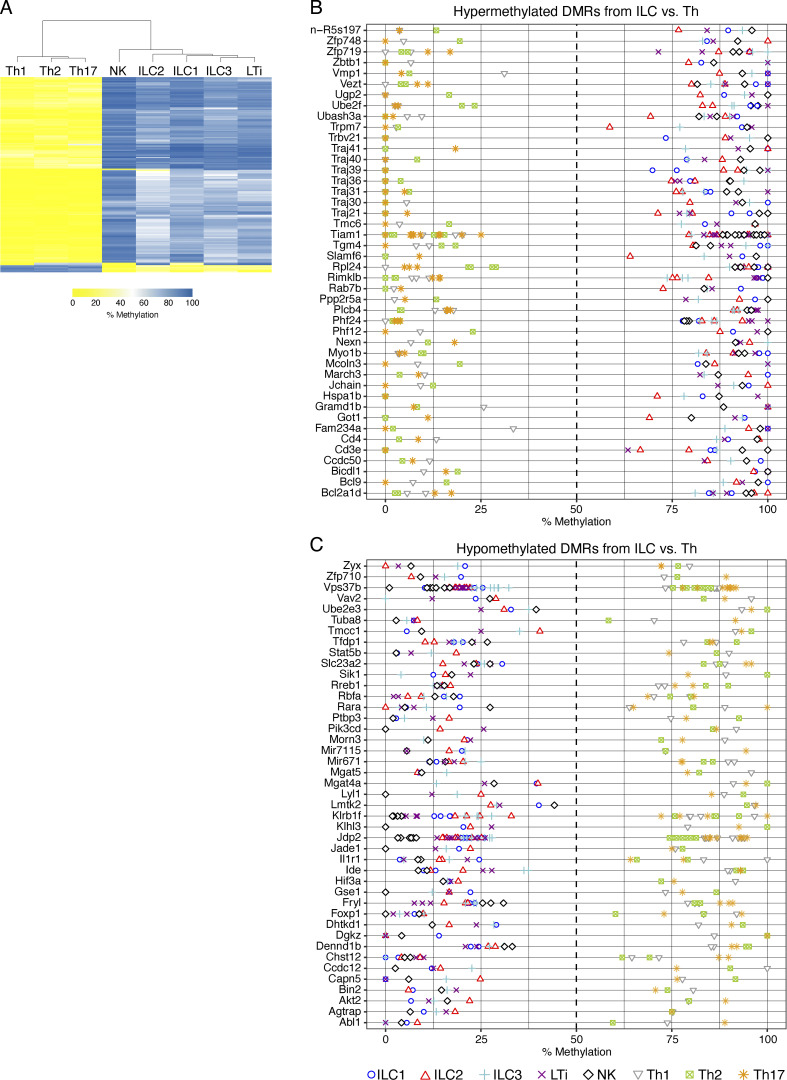
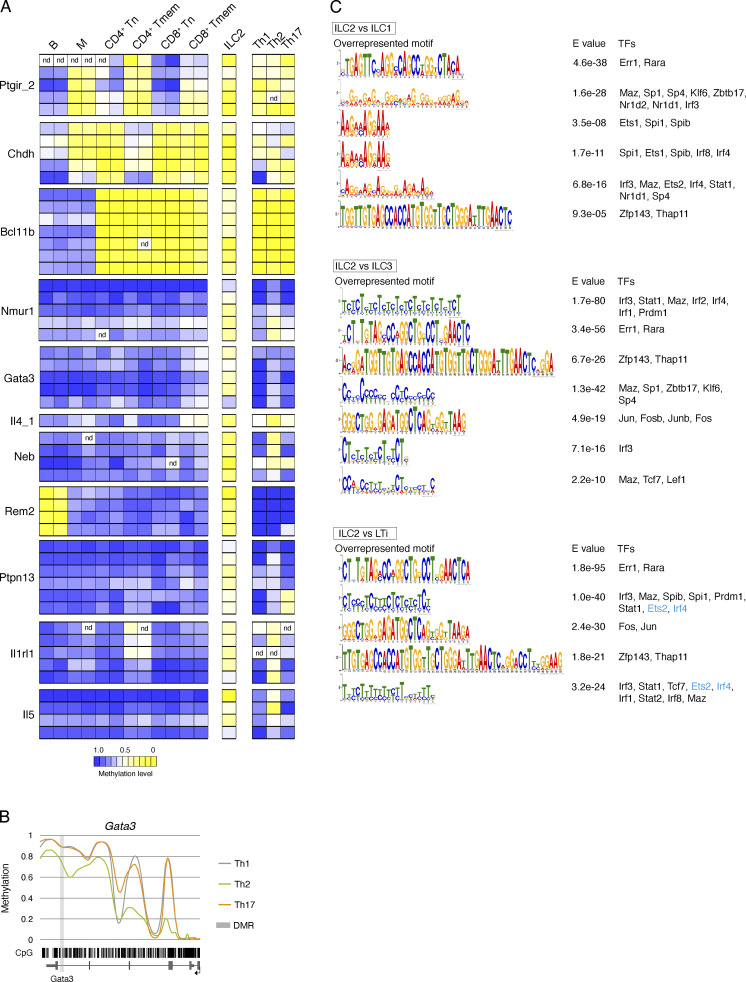
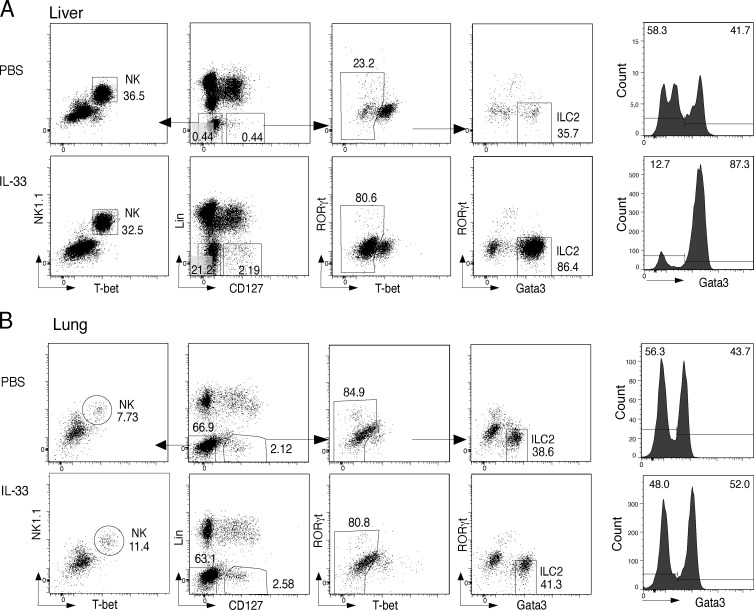
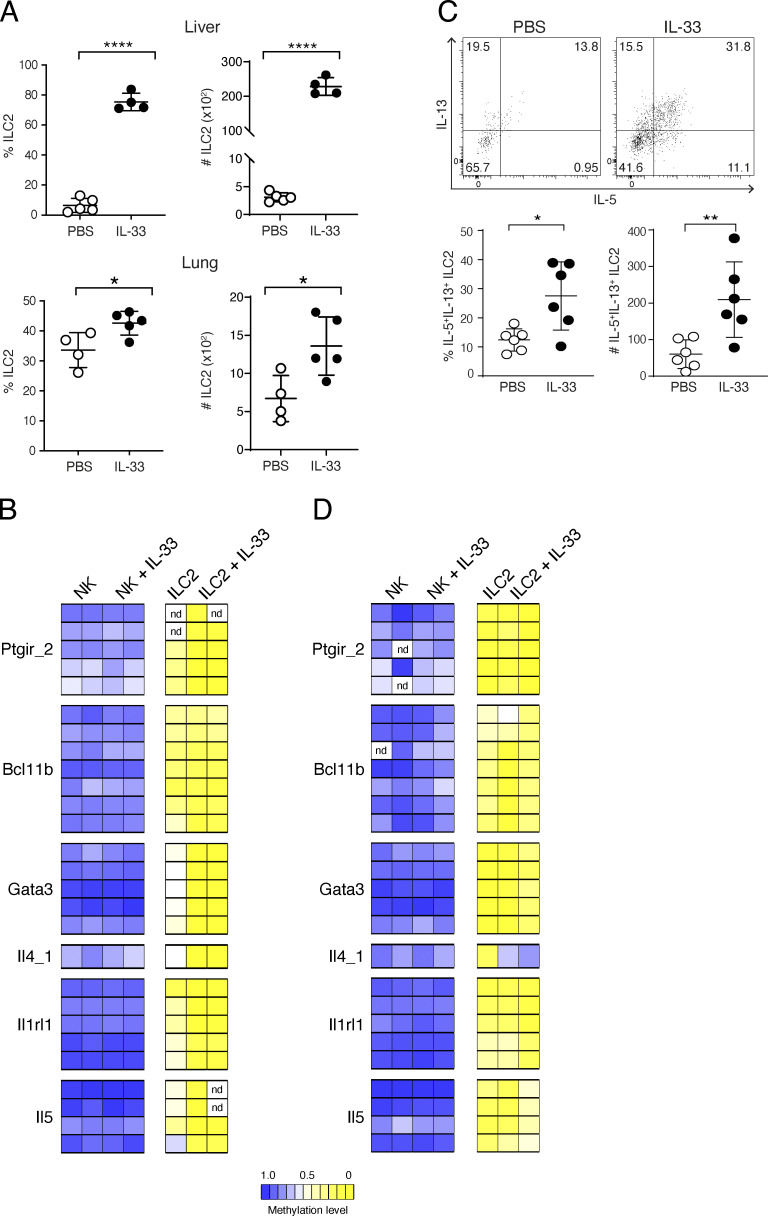
Epigenetic modifications such as DNA methylation play an essential role in imprinting specific transcriptional patterns in cells. We performed genome-wide DNA methylation profiling of murine lymph node-derived ILCs, which led to the identification of differentially methylated regions (DMRs) and the definition of epigenetic marker regions in ILCs. Marker regions were located in genes with a described function for ILCs, such as Tbx21, Gata3, or Il23r, but also in genes that have not been related to ILC biology. Methylation levels of the marker regions and expression of the associated genes were strongly correlated, indicating their functional relevance. Comparison with T helper cell methylomes revealed clear lineage differences, despite partial similarities in the methylation of specific ILC marker regions. IL-33-mediated challenge affected methylation of ILC2 epigenetic marker regions in the liver, while remaining relatively stable in the lung. In our study, we identified a set of epigenetic markers that can serve as a tool to study phenotypic and functional properties of ILCs.


Conflict of interest statement

Disclosures: The authors declare no competing interests exist.

Figures

None
Graphical abstract
Figure S1.
Figure S1.
Genome-wide methylation analysis of LN ILCs. (A) Characterization of ILC2 in different LNs. Cells were isolated from inguinal (ingLN) or mesenteric (mLN) lymph nodes of Gata3 reporter mice (Gatir mice; Rao et al., 2020). ILC2 were gated as LinCD127+Gata3-YFPhigh cells and further discriminated by expression of ST2, IL17RB, and Klrg1. Data pooled from n = 2 independent experiments with n = 2 mice per group. Statistical significance was analyzed using unpaired two-tailed Student’s t test with *, P ≤ 0.05; **, P ≤ 0.01; ***, P ≤ 0.001. (B) Sorting strategy for ILC WGBS. ILCs from pooled murine pLNs of WT C57BL/6J mice were sorted by indicated marker. Lineage markers (Lin) included CD3 and CD19. NK cells (LinCD127NK1.1+Tbet+), ILC1 (LinCD127+Tbet+Gata3RORgt), ILC2 (LinCD127+TbetGata3+RORgt), ILC3 (LinCD127+CCR6TbetGata3RORgt+), and LTi cells (LinCD127+CCR6+TbetGata3RORgt+). (C) Purity reanalysis of sorted ILCs. (D) Unsupervised hierarchical clustering of the top 1,000 DMRs among ILC subsets. The color represents the degree of mean methylation value, ranging from yellow (methylation level = 0) to blue (methylation level = 100%).
Figure 1.
Figure 1.
Genome-wide methylation analysis of LN-derived ILCs. For initial WGBS, ILC populations were pooled from >10 independent sorts of a total of n = 200 mice. WGBS was performed in unicates for NK cells, ILC1, ILC2, ILC3, and LTi cells. (A) Number of DMRs among ILC populations in pairwise comparisons. Methylomes were built from bisulfite sequencing data that were mapped against the reference genome. Numbers indicated the DMRs discovered by metilene software, containing at least three CpG motifs and a 25% methylation difference. (B) Number of discovered DMRs at various distances (x axis) relative to the TSS of the closest gene. (C) Pie charts indicating the location of the DMRs identified in groupwise comparisons. Numbers show the frequency of DMRs in intergenic, intragenic, or promoter regions according to their genomic position. (D) Euclidian sample distances of DMR methylation values from pairwise comparisons. Distance value and associated color code (red to blue) is shown. (E) Identification of pathways that are associated with identified DMRs by a KEGG-based pathway enrichment analysis. The odds ratio of the resulting pathways from the indicated pairwise comparisons were translated into a color code and ordered according to their value.
Figure 2.
Figure 2.
Identification of epigenetic marker regions in LN-derived ILCs. (A) Heatmaps showing the methylation level of selected epigenetic marker regions for ILC1, ILC2, ILC3, and LTi cells. Short DMRs produced by metilene software were extended to include adjacent differentially methylated CpG motifs to generate marker regions. The regions were named after the associated gene locus and numbered if more than one region was linked to a locus. The mean methylation value was calculated from the CpG motifs located within the marker region. The values were translated into a color code ranging from yellow (0% methylation = 0) via white (50% methylation = 0.5) to blue (100% methylation = 1.0). (B) Methylation profiles of marker-associated gene loci. Smoothed, linear display of CpG motifs (bar code), methylation values of the DMR (light gray box), and the surrounding gene body (exons in dark gray boxes, TSS indicated by arrow). Colored lines depict the methylation values ranging from 0 (0% methylation) to 1 (100% methylation) for each ILC subset (blue, ILC1; red, ILC2; cyan, ILC3; dark magenta, LTi; black, NK). Three selected gene loci for ILC1/NK (top), ILC2 (middle), and ILC3/LTi (bottom) are shown.
Figure S2.
Figure S2.
Methylation profiles of CpG motifs within gene loci associated to ILCs. (A) ILC1 marker regions (Il2rb, Trerf1, Gpr18, Runx2). (B) ILC2 marker regions (Dhx40, Ptgir, Chdh, Neb, Ptpn13, Rem2, Il5, Bcl11b). (C) ILC3 marker regions (Emb, Lrrk2, Il7r, Blk, Pxdc1, Vipr2). (D) LTi cell marker regions (Ccr6, Ckb, Cdc14a, Stra6, Prelid2, Kit, St3gal3, Itih1). (E) Methylation profiles covering the gene loci of Id2, Tcf7, Zbtb16, Rora, Eomes, and Znf683. Smoothed, linear display of CpG motifs (bar code) methylation values of the DMR (light gray box) and the surrounding gene body (exons in dark gray boxes, TSS indicated by arrow). Colored lines depict the methylation values ranging from 0 (0% methylation) to 1 (100% methylation) for each ILC subset (ILC1 = blue, ILC2 = red, ILC3 = cyan, LTi = dark magenta, NK = black).
Figure S3.
Figure S3.
RNA-seq of LN ILCs. (A) Sorting strategy for ILC RNA-seq. ILCs were sorted from pooled pLNs of RorcGFP reporter mice by surface markers as ILC1 (LinCD127+RORγtGFP−NKp46+KLRG1), ILC2 (LinCD127+RORγtGFP−NKp46KLRG1+), ILC3 (LinCD127+RORγtGFP+CCR6), LTi cells (LinCD127+RORγtGFP+CCR6+). SSC, side scatter. (B) Purity reanalysis of sorted ILCs. (C) Multidimensional scaling (MDS) of rlog-transformed expression counts in ILCs. Sample relationship similarity is shown in 3D plot including sample group color code (ILC1 = blue, ILC2 = red, ILC3 = cyan, LTi = dark magenta). (D) Correlation analyses visualize the relation between methylation status of marker regions (methylation difference, x axis) and associated gene expression (log2 fold-change, y axis). Analysis of ILC1 vs. ILC3, ILC1 vs. LTi, or ILC3 vs. LTi revealed R = −0.71 (P = 0.003), R = −0.84 (P < 0.001), or R = −0.49 (P = 0.047), respectively. Plots show the comparison between ILC1 (blue dots), ILC3 (cyan dots), or LTi (magenta dots) including the linear regression line.
Figure 3.
Figure 3.
Transcriptome analysis revealed high correlation between demethylation of marker regions and expression of the associated genes. (A) Heatmap showing the top 50 most variable genes in an unbiased hierarchical clustering of ILC1-3 and LTi cells, as revealed by DESeq2 expression analysis (B) Expression values (reads per kilobase maximum transcript length per million mapped reads) of marker-associated genes were translated into a heatmap and ranked according to the respective ILC population. (C) Correlation analyses visualize the relation between methylation status of marker regions (methylation difference, x axis) and associated gene expression (log2 fold-change [FC], y axis). Analysis of ILC1 vs. ILC2, ILC3 vs. ILC2, or LTi vs. ILC2 revealed R = −0.82 (P < 0.001), R = −0.67 (P < 0.001), or R = −0.86 (P < 0.001), respectively. Plots show the comparison between ILC2 (red dots) and ILC1 (blue dots), ILC3 (cyan dots), or LTi (magenta dots) including the linear regression line. (D) Methylation profile of the Nmur1 locus for ILC1-3 and LTi cells, including smoothed linear display of CpG motifs (bar code), methylation values of the marker region (light gray box), and the surrounding gene body (exons in dark gray boxes, TSS indicated by arrow). (E) Representative flow cytometry plot showing Gata3 expression in ILC2 following 7 d of expansion in the presence of IL-2, IL-7, and IL-33. (F) sgRNA recognizing Nmur1-associated marker region (crNmur1) or negative control sgRNA (crNeg) were electroporated into in vitro–cultured ILC2 by electroporation. Nonelectroporated ILC2 and in vitro–differentiated Th2 cells served as additional controls. Graph depicts expression of Nmur1 determined 3 d after electroporation, shown as relative expression to Actb. RNA-seq was performed in n = 3 independent experiments and shown as triplicates (A) or mean values (B). Methylation data for the correlation analysis (C and D) was derived from the initial WGBS. In vitro targeting of ILC and Th2 cells (E and F) was performed in n = 3 independent experiments. Statistical significance was analyzed using unpaired two-tailed Student’s t test with ***, P ≤ 0.001.
Figure S4.
Figure S4.
Analysis of non-ILC immune cell subsets. (A) Sorting strategy for the isolation of Th1, Th2, and Th17 cells. CD4+ cells from pooled pLNs and spleen of C57BL/6J mice were magnetically enriched by using anti-CD4 microbeads and the autoMacs Pro separator (Miltenyi Biotec). The enriched CD4+ cells were gated on single lymphocytes and sorted in high purity for Th1 (CD3+CD4+Foxp3CD44hiCD62LlowT-bet+), Th2 (CD3+CD4+Foxp3CD44hiCD62LlowGata3+), and Th17 cells (CD3+CD4+Foxp3CD44hiCD62LlowRORγt+). (B) Sorting strategy for the isolation of main immune cell subsets. B cells (CD19+), myeloid cells (CD19CD3CD11b+), and both CD4+ and CD8+ T (CD19CD3+) cells were sorted from murine lymph nodes. T cells were further distinguished into naive (CD44CD62L+) and memory (CD44+CD62L) populations. (C) Heatmaps showing the methylation level of ILC1, ILC3, and LTi epigenetic marker regions in Th1, Th2, and Th17 cells. The mean methylation value was calculated from the CpG motifs located within the marker region. The values were translated into a color code ranging from yellow (0% methylation = 0) via white (50% methylation = 0.5) to blue (100% methylation = 1.0).
Figure 4.
Figure 4.
Differences between the methylomes of ILCs and Th cells. (A) Th1 (CD3+CD4+Foxp3CD44hiCD62LlowT-bet+), Th2 (CD3+CD4+Foxp3CD44hiCD62LlowGata3+), and Th17 cells (CD3+CD4+Foxp3CD44hiCD62LlowRORγt+) were sorted by flow cytometry from pooled pLNs and spleen and subjected to WGBS. (A) Unsupervised hierarchical clustering of the top 1,000 DMRs among Th and ILC subsets. The color represents the degree of mean methylation value, ranging from yellow (methylation level = 0) to blue (methylation level = 100%). (B and C) Methylation values of the top 75 hypermethylated (B) and hypomethylated (C) DMRs derived from the comparisons of ILC vs. Th cell groups. The list is sorted according to the absolute mean methylation difference between the groups in descending order. Individual sample methylation values are represented by the displayed symbols. Multiple symbols indicate multiple DMRs in the same gene locus. Data for analysis of ILC methylomes was derived from the initial WGBS. Th cell populations were pooled from a total of n = 13 mice. WGBS was performed in unicates for Th1, Th2, and Th17 cells.
Figure 5.
Figure 5.
ILC2 show partial signature overlaps with Th cells and carry T cell–regulating factor binding sites in overrepresented motifs. (A) B cells (CD19+), myeloid cells (CD19CD3CD11b+), and naive (CD44CD62L+) and memory (CD44+CD62L) CD4+ and CD8+ (CD19CD3+) T cells were sorted by flow cytometry from the spleen of WT mice and analyzed for the methylation of CpG motifs within ILC2 marker regions by pyrosequencing. The mean methylation value of all CpG motifs within each region was calculated and transformed into a color-coded box, ranging from blue (100% methylation) and white (50% methylation) to yellow (0% methylation). Each box represents the methylation value of one CpG motif. The white box labeled with nd represents an invalid sequencing signal. The experiment was performed in n = 2 independent sorts. Methylation values shown for the CpG motifs of ILC2 were extracted from the WGBS data of Th1, Th2, and Th17 cells and LN-derived ILC2. B, B cells; M, myeloid cells; Tn, naive T cells; Tmem, memory T cells. (B) Methylation profile of Gata3 gene locus. Smoothed, linear display of CpG motif (bar code) methylation values of the DMR (light gray box) and the surrounding gene body (exons in dark gray boxes, TSS indicated by arrow). Colored lines depict the methylation values ranging from 0 (0% methylation) to 1 (100% methylation) for each Th subset (Th1 = gray, Th2 = green, Th17 = orange). (C) Overrepresented sequences and corresponding E values of identified overrepresented motifs (MEME analysis) among DMRs of ILC2 comparisons are shown as indicated. Motifs containing transcription factors (TFs) not expressed in ILC2 (RNA-seq analysis) or motifs without any transcription factor binding site were excluded. Transcription factors in blue are differentially expressed in ILC2.
Figure S5.
Figure S5.
Sorting strategy for ILC2 and NK cells from lung and liver. (A and B) ILC2 were sorted as Lin (CD3 and CD19)CD127+TbetGata3+RORγt; NK cells were sorted as LinCD127NK1.1+Tbet+ from lung (A) and liver (B) of both control and IL-33–treated mice. The histograms depicted the Gata3 expression against cell count.
Figure 6.
Figure 6.
Impact of IL-33–mediated challenge on ILC2-associated epigenetic marker in lung and liver. (A) NK cells and ILC2 were isolated from the liver or lung of mice under homeostatic conditions or after i.p. treatment with 300 ng IL-33 for three consecutive days (liver) or i.n. treatment for three consecutive days with 250 ng IL-33 (lung). Graphs show frequencies and total numbers of Gata3+ ILC2 within LinCD127+ cells. Data shown were generated from n = 4–5 independent cell sorts with n = 7–8 mice per sort. Statistical significance was analyzed using unpaired two-tailed Student’s t test with *, P ≤ 0.05 and ****, P ≤ 0.0001. (B) Pyrosequencing results show the methylation value of selected ILC2-associated marker regions in liver NK cells and ILC2 of both naive and IL-33–treated mice. The mean methylation value of all CpG motifs within each region was calculated and transformed into a color-coded box, ranging from blue (100% methylation) and white (50% methylation) to yellow (0% methylation). Data for untreated mice were generated by pooling ILC2 from several cell sorts with n = 20–30 mice per sort. n = 2 independent experiments were conducted for IL-33 challenge with n = 16 mice. (C) ILC2 were isolated from the lung of naive or IL-33–challenged mice and restimulated with PMA/ionomycin in vitro for intracellular cytokine staining. Representative flow cytometry plots of Gata3+ ILC2 producing IL-5/IL-13 from control (PBS) and IL-33–challenged mice. Graphs show frequencies and total cell numbers of Gata3+IL-5+IL-13+ ILC2. Data shown from n = 2 independent experiments with n = 3 mice per group. Statistical significance was analyzed using unpaired two-tailed Student’s t test with *, P ≤ 0.05 and **, P ≤ 0.01. (D) Pyrosequencing results show the methylation value of ILC2-associated marker regions in lung NK cells and ILC2 of both naive and IL-33–treated mice. The mean methylation value of all CpG motifs within each region was calculated and transformed into a color-coded box, ranging from blue (100% methylation) and white (50% methylation) to yellow (0% methylation). Data for untreated mice were generated by pooling ILC2 from several cell sorts with n = 10–20 mice per sort. n = 2 independent experiments were conducted for IL-33 challenge with n = 5 mice.

Similar articles

Cited by

References

    1. Ahmadi Rastegar, D., and Dzamko N.. 2020. Leucine rich repeat kinase 2 and innate immunity. Front. Neurosci. 14:193. 10.3389/fnins.2020.00193 - DOI - PMC - PubMed
    1. Allan, D.S.J., Cerdeira A.S., Ranjan A., Kirkham C.L., Aguilar O.A., Tanaka M., Childs R.W., Dunbar C.E., Strominger J.L., Kopcow H.D., and Carlyle J.R.. 2017. Transcriptome analysis reveals similarities between human blood CD3(−) CD56(bright) cells and mouse CD127(+) innate lymphoid cells. Sci. Rep. 7:3501. 10.1038/s41598-017-03256-0 - DOI - PMC - PubMed
    1. Antignano, F., Braam M., Hughes M.R., Chenery A.L., Burrows K., Gold M.J., Oudhoff M.J., Rattray D., Halim T.Y., Cait A., et al. . 2016. G9a regulates group 2 innate lymphoid cell development by repressing the group 3 innate lymphoid cell program. J. Exp. Med. 213:1153–1162. 10.1084/jem.20151646 - DOI - PMC - PubMed
    1. Artis, D., and Spits H.. 2015. The biology of innate lymphoid cells. Nature. 517:293–301. 10.1038/nature14189 - DOI - PubMed
    1. Bailey, T.L., and Elkan C.. 1994. Fitting a mixture model by expectation maximization to discover motifs in biopolymers. Proc. Int. Conf. Intell. Syst. Mol. Biol. 2:28–36 - PubMed

Publication types